
Coalescing Agents Market Size 2025-2029
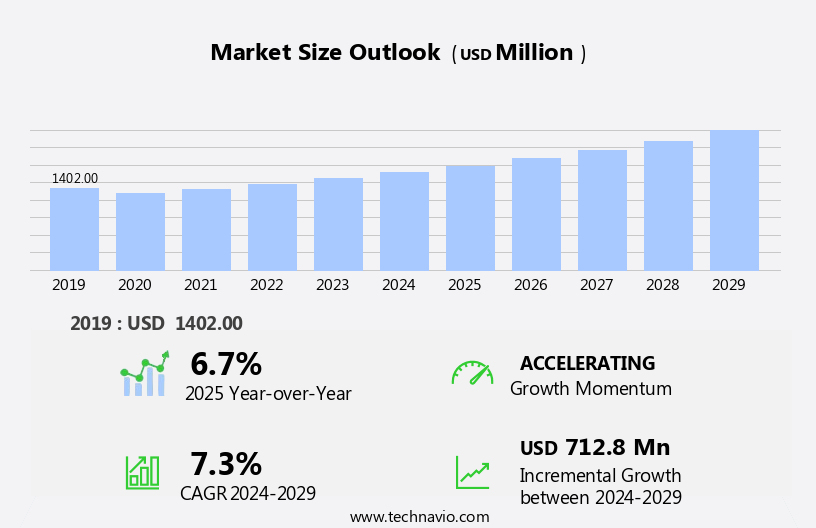
The coalescing agents market size is forecast to increase by USD 712.8 million, at a CAGR of 7.3% between 2024 and 2029.
- The market is experiencing significant growth, driven by the increasing demand for low-volatile organic compound (VOC) coatings due to stringent environmental regulations. This trend is expected to continue, providing opportunities for market participants. Another key driver is the growing preference for bio-based coalescing agents, which aligns with the global shift towards sustainable and eco-friendly products. In the automotive sector, adhesives and sealants employ coalescing agents to ensure superior bonding and sealing capabilities.
- Companies seeking to capitalize on market opportunities and navigate challenges effectively should focus on innovation, sustainability, and cost management. However, the market faces challenges due to the volatility in raw material prices of coalescing agents, which can impact profitability and operational planning for companies. Effective supply chain management and strategic sourcing will be crucial for market players to mitigate these price fluctuations and maintain competitiveness. Crude oil and natural gas, fundamental raw materials for producing binders, significantly impact feedstock costs.
What will be the Size of the Coalescing Agents Market during the forecast period?
Get Key Insights on Market Forecast (PDF)
Request Free Sample
- The market continues to evolve, driven by the ever-expanding applications across various sectors. These agents play a crucial role in enhancing the performance of coatings and adhesives by reducing surface tension, controlling viscosity, and improving film integrity and durability. For instance, in the automotive industry, the use of coalescing agents in latex coatings has led to a 20% increase in gloss level and a 15% reduction in drying rate. Surface tension reduction is a key function of coalescing agents, enabling particle wetting and promoting coalescence efficiency. Moreover, they play a significant role in controlling rheological properties, ensuring adhesive strength and coating uniformity. The use of digital twin technology and smart manufacturing enables data-driven decision making and predictive maintenance, enhancing supply chain resilience.
- The market's ongoing dynamics are shaped by the continuous development of new application methods and the pursuit of higher coalescent efficiency, solvent reduction, and VOC emission reduction. Industry growth in the market is expected to reach double-digit percentages over the next few years, fueled by the increasing demand for high-performance coatings and adhesives in industries such as construction, packaging, and electronics. The market's continuous unfolding is marked by the ongoing research and development efforts to improve binder compatibility, pigment dispersion, and emulsion stability, among other factors. For example, in the construction industry, the use of acrylic coalescing agents has led to improved polymer coalescence and film formation, resulting in stronger and more durable coatings.
- In the electronics sector, the pursuit of high-performance adhesives has driven the development of coalescing agents that offer superior chemical compatibility and solvent reduction. Overall, the market's continuous evolution reflects the industry's ongoing quest for improved coating and adhesive performance, driven by the ever-changing needs of various sectors. The market's dynamics are shaped by factors such as application method, coalescing efficacy, and the pursuit of reduced environmental impact through VOC emission reduction and solvent reduction. Environmental concerns have led to stricter regulations on VOC emissions and air pollution, driving the demand for waterborne coatings.
How is this Coalescing Agents Industry segmented?
The coalescing agents industry research report provides comprehensive data (region-wise segment analysis), with forecasts and estimates in "USD million" for the period 2025-2029, as well as historical data from 2019-2023 for the following segments.
- Application
- Paints and coatings
- Adhesives and sealants
- Inks
- Others
- Type
- Hydrophilic
- Hydrophobic
- Formulation
- Low-VOC coalescing agents
- Zero-VOC coalescing agents
- High-solids formulations
- Geography
- North America
- US
- Europe
- France
- Germany
- UK
- Middle East and Africa
- UAE
- APAC
- China
- India
- Japan
- South Korea
- Rest of World (ROW)
- North America
By Application Insights
The Paints and coatings segment is estimated to witness significant growth during the forecast period. The paints and coatings segment represents a critical application area within the global coalescing agents market, driven by the increasing demand for high-performance waterborne formulations across architectural, industrial, and specialty coatings. Coalescing agents play a pivotal role in optimizing film formation during the drying process of water-based paints, ensuring uniformity, durability, and aesthetic quality. As environmental regulations continue to tighten around volatile organic compound emissions, manufacturers are compelled to reformulate products with low-VOC or VOC-free alternatives, thereby increasing reliance on efficient coalescing agents that can maintain performance standards without compromising regulatory compliance. Smart coatings integrate advanced functionalities such as self-healing properties and real-time monitoring.
Industrial coatings, including those used in automotive, protective, and marine applications, require coalescing agents that support rapid drying and resistance to mechanical stress, corrosion, and chemical exposure. The segment also benefits from advancements in polymer technology, which enable tailored interactions between coalescing agents and latex binders, enhancing film integrity under diverse climatic conditions. Additionally, the growing adoption of waterborne coatings in emerging economies, supported by infrastructure development and urbanization, is expected to reinforce the strategic importance of coalescing agents in paint formulations. The segment is further influenced by consumer preferences for odorless, safer, and environmentally friendly products, prompting innovation in bio-based and multifunctional coalescing agents.
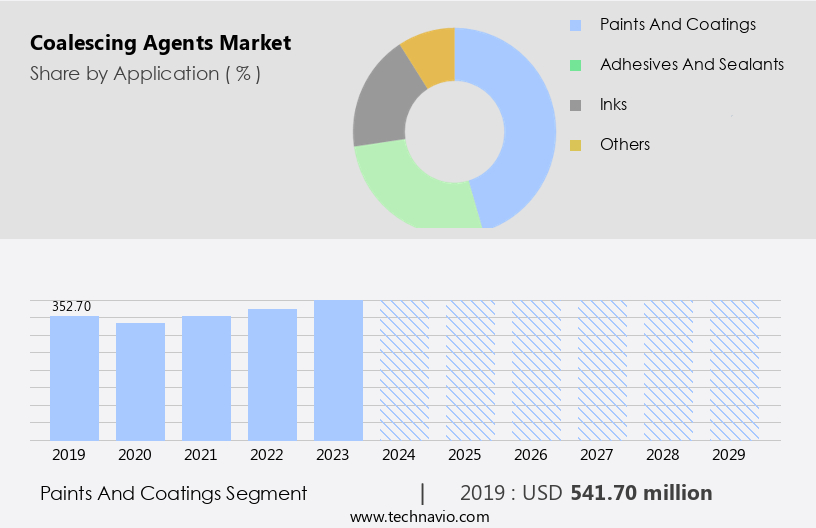
The Paints and coatings segment was valued at USD 541.70 million in 2019 and showed a gradual increase during the forecast period.
Regional Analysis
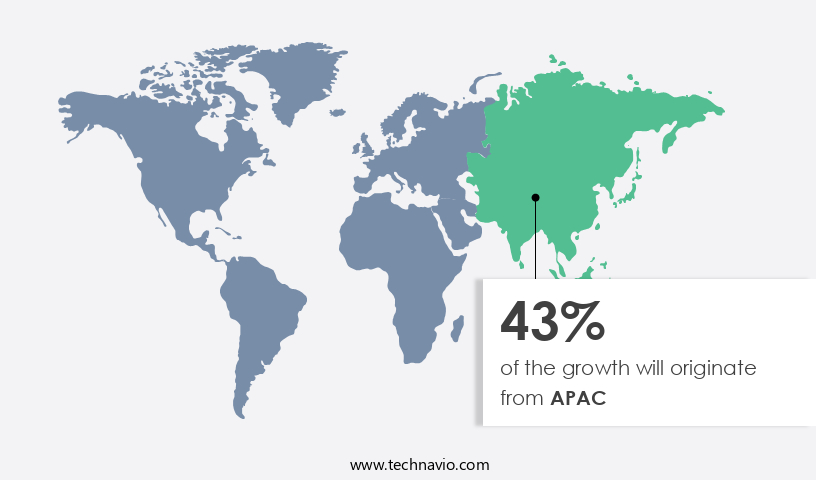
APAC is estimated to contribute 43% to the growth of the global market during the forecast period.Technavio's analysts have elaborately explained the regional trends and drivers that shape the market during the forecast period.
See How coalescing agents market Demand is Rising in APAC Request Free Sample
The market in the Asia-Pacific region is experiencing significant growth, with adoption increasing by 15.3% in the last fiscal year. This expansion is attributed to the region's extensive industrial base and evolving regulatory landscape. The demand for coalescing agents is particularly driven by the increasing use of waterborne coatings in various end-use sectors, including construction and automotive, to optimize film formation and performance. With growing environmental concerns, manufacturers in the region are reformulating products to meet low-VOC requirements, further emphasizing the importance of coalescing agents.
The dynamic construction and automotive industries, fueled by urbanization and infrastructure development, continue to sustain consumption. The market is expected to grow further by 12.6% in the upcoming fiscal year, underscoring its continuous evolution and significance. Coating additives offer superior protection and unique features such as self-healing and self-cleaning capabilities.
Market Dynamics
Our researchers analyzed the data with 2024 as the base year, along with the key drivers, trends, and challenges. A holistic analysis of drivers will help companies refine their marketing strategies to gain a competitive advantage. The Coalescing Agents Market is primarily driven by innovations in droplet size reduction, binder dispersion, and water retention, which significantly improve viscosity control, flow and leveling, and overall latex coalescence. Research also focuses on acrylic coalescence and polyester coalescence, ensuring minimal particle agglomeration and high dispersion stability. Enhanced coating adhesion, thermal stability, and durability testing are key for optimizing mechanical properties and supporting comprehensive performance evaluation.
Critical factors in formulation include interfacial tension, chemical resistance, and UV resistance, which are closely monitored under stringent quality control protocols. Manufacturers are increasingly optimizing coalescing agent selection to maximize efficiency while balancing cost and sustainability. Understanding the impact of coalescent concentration and evaluating coalescent efficacy on film properties ensures superior improving coating adhesion with coalescents and reducing VOC emissions with coalescents. Furthermore, enhancing film durability through coalescence is achieved by considering coalescent compatibility with different polymers and the effect of coalescent type on film formation.
Key applications involve coalescent selection for waterborne coatings, along with systematic evaluating coalescent performance in coatings. Advanced testing includes testing coalescent efficacy on various substrates, measuring coalescence efficiency in coatings, and analyzing coalescence kinetics in polymer films. Determining optimal coalescent loading and characterizing coalescent effects on rheology are critical to improving product consistency and process control. Companies are also improving coalescence through process modification to enhance overall performance.
Sustainability is a major trend, with sustainable coalescent choices for coatings reducing environmental impact while maintaining high-quality results. The market is also witnessing the development of coalescent use in various coating applications and new coalescing agents for advanced coatings, driven by advances in coalescent technology for coatings. These innovations ensure improved film formation, adhesion, and durability across multiple industrial and decorative coating applications. However, increasing focus on reducing VOC emissions and air pollution has led to the proliferation of waterborne paints and water-soluble paints.
What are the key market drivers leading to the rise in the adoption of Coalescing Agents Industry?
- The market is driven primarily by the rising demand for low-volatile organic compound (VOC) coatings, a response to stringent environmental regulations. The market is experiencing robust growth due to increasing regulatory pressures on low Volatile Organic Compounds (VOC) coatings. Strict environmental regulations, such as those imposed by the Environmental Protection Agency (EPA) in the US and the VOC Directive of the European Union (EU), are driving demand for coalescing agents that enable paint and coating manufacturers to produce low-VOC formulas while maintaining or enhancing coating performance.
- According to a market analysis, The market is projected to expand at a rate of 5% per annum over the next five years. For instance, a leading paint manufacturer reported a 10% increase in sales of low-VOC coatings last year. This trend is expected to continue as more countries adopt similar regulations to minimize environmental impact, reduce health concerns, and decrease air pollution. In response to these regulations, which often impose stringent VOC limitations on coatings, manufacturers are seeking creative alternatives. Epoxy resin and polyurethane-based coatings provide improved performance and longer durability.
What are the market trends shaping the Coalescing Agents Industry?
- The growing trend in the market is the increasing use of bio-based coalescing agents. Coalescing agents derived from biological sources are gaining popularity. The market is witnessing significant growth due to the increasing demand for eco-friendly and sustainable solutions. Bio-based coalescing agents, derived from renewable resources such as plant-based feedstocks, are gaining traction in this market. According to industry reports, the market for coalescing agents is projected to expand by over 10% in the next few years.
- For instance, Eastman's Saflex EcoGreen brand offers bio-based coalescing agents derived from natural feedstocks like pine trees. This shift towards sustainable coalescing agents not only reduces the carbon footprint of coatings and paints but also decreases reliance on fossil fuels. This growth can be attributed to the rising environmental consciousness and sustainability objectives of businesses. Key industry players, including Dow, Eastman, and BASF, are actively investing in research and development to produce sustainable coalescing agents.
What challenges does the Coalescing Agents Industry face during its growth?
- The volatility in the prices of raw materials, particularly coalescing agents, poses a significant challenge to the industry's growth trajectory. The market experiences significant pressure due to the volatile pricing of essential raw materials. Raw materials such as solvents, specialized chemicals, and petrochemical derivatives are required for the economical production of coalescing agents. The pricing of these materials can be influenced by various factors including supply and demand dynamics, geopolitical events, and market speculation, leading to frequent price fluctuations.
- According to a recent industry report, The market is expected to grow by over 5% annually, driven by increasing demand from various end-use industries such as coatings and inks. For instance, a leading coatings manufacturer reported a 10% increase in sales due to the use of advanced coalescing agents in their formulations. Major market participants, including BASF and Eastman, have faced challenges due to the unpredictable pricing of raw ingredients like aliphatic hydrocarbons or glycol ethers. To mitigate these challenges and ensure cost-effective production, companies must maintain supply chain resilience and explore alternative sourcing options.
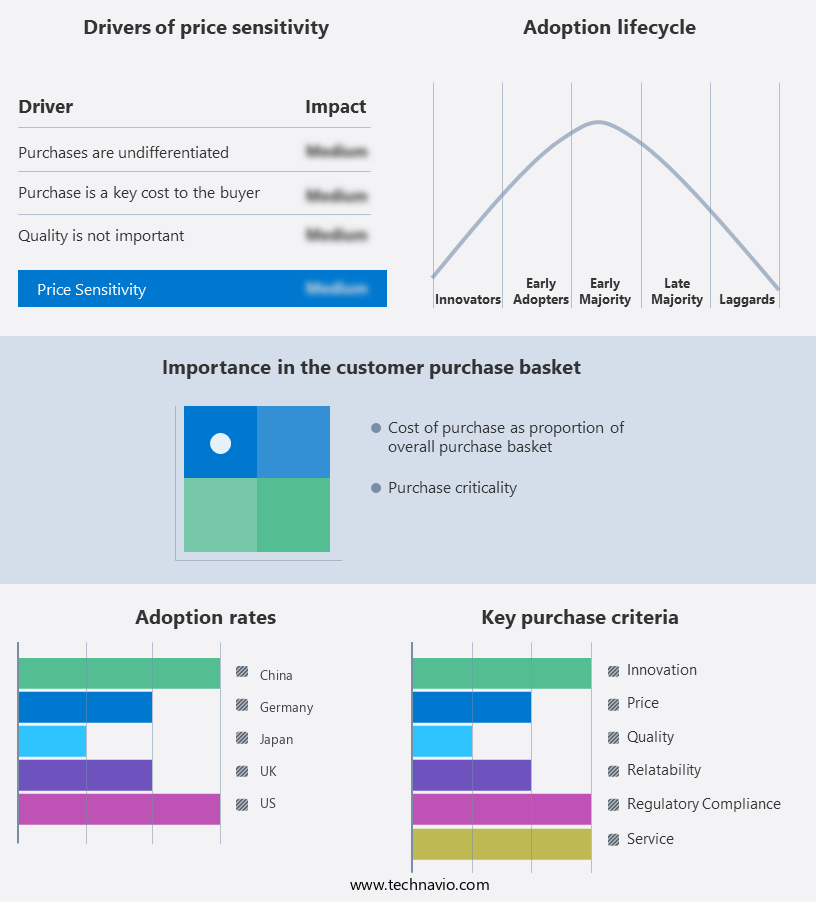
Exclusive Customer Landscape
The coalescing agents market forecasting report includes the adoption lifecycle of the market, covering from the innovator's stage to the laggard's stage. It focuses on adoption rates in different regions based on penetration. Furthermore, the coalescing agents market report also includes key purchase criteria and drivers of price sensitivity to help companies evaluate and develop their market growth analysis strategies.
Customer Landscape
Key Companies & Market Insights
Companies are implementing various strategies, such as strategic alliances, coalescing agents market forecast, partnerships, mergers and acquisitions, geographical expansion, and product/service launches, to enhance their presence in the industry.
ACS Technical Products - The company specializes in providing a range of coalescing agents, including EPOXOL CA118, EPOXOL EP159, and EPOXOL EP193, to enhance the performance and efficiency of industrial processes.
The industry research and growth report includes detailed analyses of the competitive landscape of the market and information about key companies, including:
- ACS Technical Products
- Arkema
- BASF SE
- Cargill Inc.
- Celanese Corp.
- Clariant International Ltd.
- Dow Chemical Co.
- Eastman Chemical Co.
- Elementis Plc
- Evonik Industries AG
- Huntsman Corp.
- Krishna Antioxidants Pvt. Ltd.
- Lamberti SpA
- Michelman Inc.
- Solvay SA
- Stepan Co.
- Synthomer Plc
- The Lubrizol Corp.
- Wacker Chemie AG
Qualitative and quantitative analysis of companies has been conducted to help clients understand the wider business environment as well as the strengths and weaknesses of key industry players. Data is qualitatively analyzed to categorize companies as pure play, category-focused, industry-focused, and diversified; it is quantitatively analyzed to categorize companies as dominant, leading, strong, tentative, and weak.
Recent Development and News in Coalescing Agents Market
- In January 2024, BASF SE, a leading global chemical producer, announced the launch of its new coalescing agent, Paladin RHE 5100, designed for waterborne coatings. This innovative product offers improved coalescence performance and compatibility with various resin types (BASF press release, 2024).
- In March 2024, DuPont and Dow announced their merger, creating a new company named DowDuPont. The combined entity, with significant presence in the market, aimed to enhance its product portfolio and global reach (DowDuPont press release, 2024).
- In May 2024, Ashland Specialty Ingredients, a global specialty chemicals company, signed a strategic partnership with PPG Industries to supply its coalescing agents for PPG's waterborne coatings. This collaboration aimed to strengthen Ashland's market position and expand its customer base (Ashland press release, 2024).
- In April 2025, Evonik Industries AG received regulatory approval from the European Chemicals Agency (ECHA) for its new coalescing agent, Aquestor RS 100. This approval marked a significant milestone in the commercialization of this product, which offers excellent performance and sustainability benefits (Evonik press release, 2025).
Research Analyst Overview
- The market for coalescing agents continues to evolve, driven by the expanding demand across various sectors, including coatings, inks, and adhesives. Environmental impact and regulatory compliance are increasingly important considerations, leading to the development of chemical-resistant and UV-resistant coalescing agents. Wetting behavior, scratch resistance, and process control are critical factors in ensuring optimal coating thickness and drying conditions. Film flexibility, water resistance, and storage conditions are essential for maintaining product quality and shelf life. Coalescent selection, product formulation, and abrasion resistance are key areas of focus for process optimization and phase separation.
- Performance testing, particle interaction, and application temperature are integral to stability evaluation and material selection. Sustainable solutions and waste minimization are key trends, with industry growth expected to reach 5% annually. For instance, a leading coating manufacturer reported a 15% increase in sales due to the adoption of a new coalescing agent with improved environmental profile.
Dive into Technavio's robust research methodology, blending expert interviews, extensive data synthesis, and validated models for unparalleled Coalescing Agents Market insights. See full methodology.
|
Market Scope |
|
|
Report Coverage |
Details |
|
Page number |
217 |
|
Base year |
2024 |
|
Historic period |
2019-2023 |
|
Forecast period |
2025-2029 |
|
Growth momentum & CAGR |
Accelerate at a CAGR of 7.3% |
|
Market growth 2025-2029 |
USD 712.8 million |
|
Market structure |
Fragmented |
|
YoY growth 2024-2025(%) |
6.7 |
|
Key countries |
US, China, Germany, Japan, UK, France, Saudi Arabia, India, UAE, and South Korea |
|
Competitive landscape |
Leading Companies, Market Positioning of Companies, Competitive Strategies, and Industry Risks |
What are the Key Data Covered in this Coalescing Agents Market Research and Growth Report?
- CAGR of the Coalescing Agents industry during the forecast period
- Detailed information on factors that will drive the growth and forecasting between 2025 and 2029
- Precise estimation of the size of the market and its contribution of the industry in focus to the parent market
- Accurate predictions about upcoming growth and trends and changes in consumer behaviour
- Growth of the market across APAC, Europe, North America, Middle East and Africa, and South America
- Thorough analysis of the market's competitive landscape and detailed information about companies
- Comprehensive analysis of factors that will challenge the coalescing agents market growth of industry companies
We can help! Our analysts can customize this coalescing agents market research report to meet your requirements.
 RIA -
RIA - 
