Cold Chain Monitoring Market Analysis, Size, and Forecast 2026-2030: North America (US, Canada, and Mexico), APAC (China, India, and Japan), Europe (Germany, UK, and France), Middle East and Africa (UAE, Saudi Arabia, and South Africa), South America (Brazil, Argentina, and Colombia), and Rest of World (ROW)

Cold Chain Monitoring Market Analysis, Size, and Forecast 2026-2030:
North America (US, Canada, and Mexico), APAC (China, India, and Japan), Europe (Germany, UK, and France), Middle East and Africa (UAE, Saudi Arabia, and South Africa), South America (Brazil, Argentina, and Colombia), and Rest of World (ROW)

Published: Mar 2026 284 Pages SKU: IRTNTR81270

Market Overview at a Glance

$5.91 B
Market Opportunity
11.6%
CAGR 2025 - 2030
33.5%
APAC Growth
$5.62 B
Hardware segment 2024

Cold Chain Monitoring Market Size 2026-2030

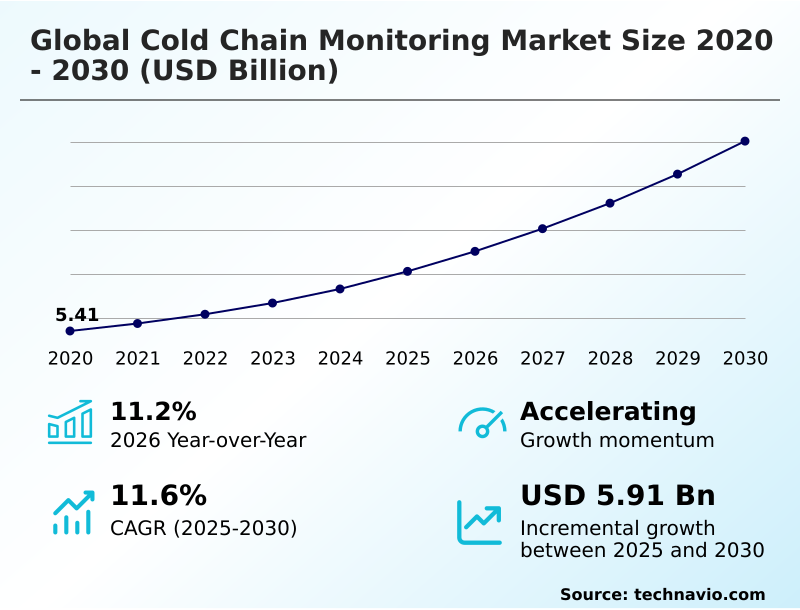
The cold chain monitoring market size is valued to increase by USD 5.91 billion, at a CAGR of 11.6% from 2025 to 2030. Increasing regulatory stringency in pharmaceutical logistics will drive the cold chain monitoring market.

Major Market Trends & Insights

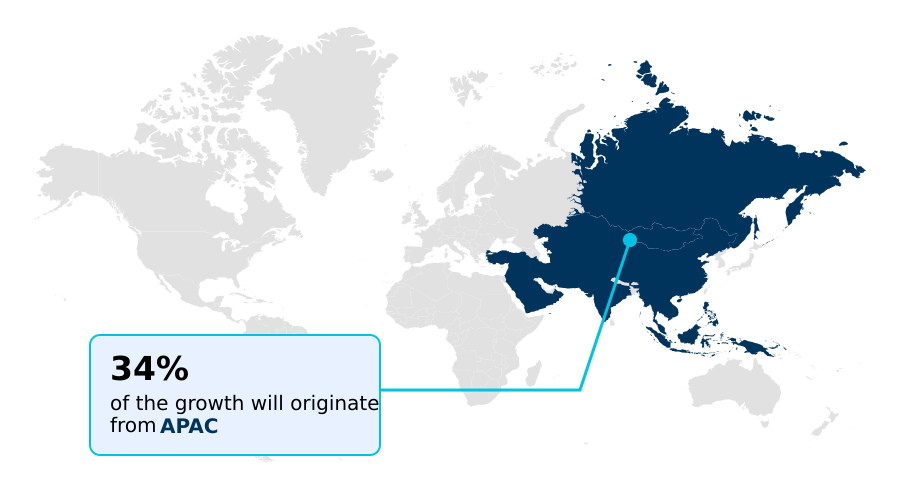
  • APAC dominated the market and accounted for a 33.5% growth during the forecast period.
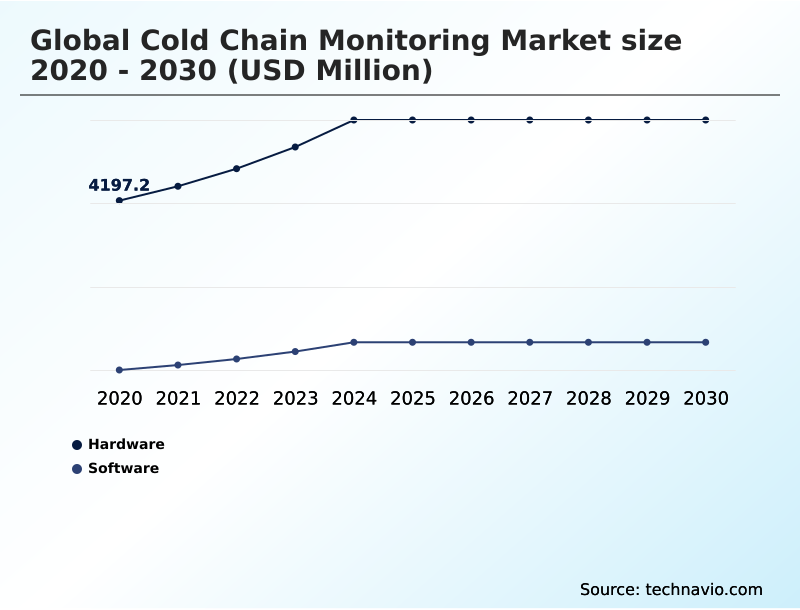
  • By Component - Hardware segment was valued at USD 5.62 billion in 2024
  • By End-user - Food and beverages segment accounted for the largest market revenue share in 2024

Market Size & Forecast

  • Market Opportunities: USD 8.62 billion
  • Market Future Opportunities: USD 5.91 billion
  • CAGR from 2025 to 2030 : 11.6%

Market Summary

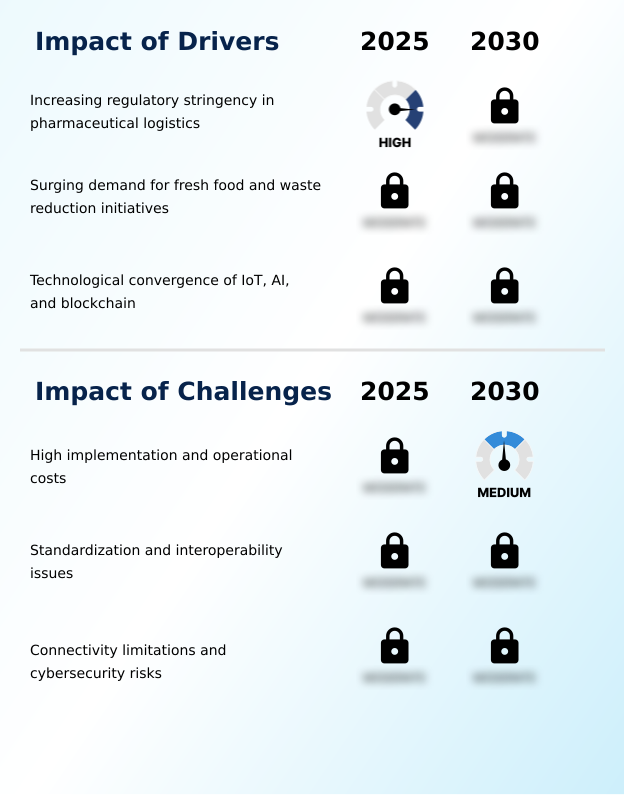
  • The cold chain monitoring market is undergoing a significant transformation, driven by stringent regulatory pressures and the imperative to reduce waste in the global food and pharmaceutical supply chains. The convergence of IoT and AI is shifting the industry from reactive problem-solving to proactive risk management through predictive excursion alerting.
  • This allows for the protection of high-value biologics and perishable foods, where a single temperature excursion can result in significant financial loss and public health risks. For instance, a pharmaceutical distributor can use real-time visibility solutions to monitor a shipment of vaccines across multiple transit modes.
  • By analyzing data from on-board environmental sensors, AI algorithms can predict a potential refrigeration unit failure and automatically reroute the shipment or alert a technician for preemptive maintenance, ensuring unbroken chain of custody and Good Distribution Practice compliance.
  • However, challenges such as high implementation costs and the need for standardized, interoperable platforms that support low-power wireless communication hinder widespread adoption, particularly among smaller logistics providers. The increasing demand for granular traceability is nonetheless pushing the industry toward more integrated and intelligent systems.

What will be the Size of the Cold Chain Monitoring Market during the forecast period?

Get Key Insights on Market Forecast (PDF) Request Free Sample

How is the Cold Chain Monitoring Market Segmented?

The cold chain monitoring industry research report provides comprehensive data (region-wise segment analysis), with forecasts and estimates in "USD million" for the period 2026-2030, as well as historical data from 2020-2024 for the following segments.

  • Component
    • Hardware
    • Software
  • End-user
    • Food and beverages
    • Healthcare and pharmaceuticals
    • Others
  • Application
    • Transportation
    • Storage
  • Geography
    • North America
      • US
      • Canada
      • Mexico
    • APAC
      • China
      • India
      • Japan
    • Europe
      • Germany
      • UK
      • France
    • Middle East and Africa
      • UAE
      • Saudi Arabia
      • South Africa
    • South America
      • Brazil
      • Argentina
      • Colombia
    • Rest of World (ROW)

By Component Insights

The hardware segment is estimated to witness significant growth during the forecast period.

The hardware segment underpins the market, shifting from passive logging to active IoT data loggers that enable continuous environmental monitoring. These systems, integrating telematics control units and long-range sensor networks, are essential for biologics transport safety and final-mile temperature control.

Innovation focuses on miniaturization and robust LPWAN-enabled devices capable of multi-sensor data fusion. This holistic condition monitoring, tracking temperature, humidity, and shock, supports both pharmaceutical logistics integrity and perishable food chain management.

Integrating RFID inlay tracking for item-level product tracking improves inventory accuracy by over 99%. This evolution is crucial for achieving end-to-end supply chain visibility and provides the foundation for cloud-based analytics platforms and tamper-evident data records from integrated sensor ecosystems.

Request Free Sample

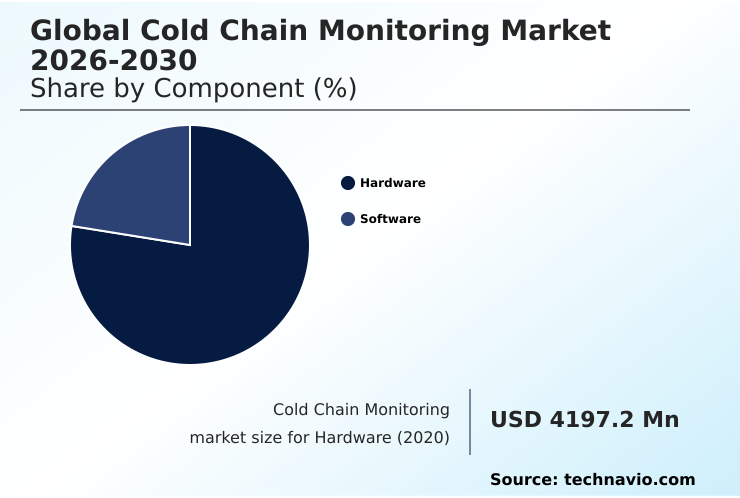
The Hardware segment was valued at USD 5.62 billion in 2024 and showed a gradual increase during the forecast period.

Request Free Sample

Regional Analysis

APAC is estimated to contribute 33.5% to the growth of the global market during the forecast period.Technavio’s analysts have elaborately explained the regional trends and drivers that shape the market during the forecast period.

See How Cold Chain Monitoring Market Demand is Rising in APAC Request Free Sample

The geographic landscape is dynamic, with North America leading in technology adoption for clinical trial material handling and aerospace pre-preg storage.

However, APAC is the fastest-growing region, projected to contribute over 33% of market growth, driven by infrastructure investment and demand for better perishable food chain management.

Europe remains a mature market focused on sustainability, environmental parameter control, and refrigeration energy optimization. In developing economies, establishing basic infrastructure for climate-controlled logistics is key.

Meanwhile, mature markets are advancing toward sophisticated thermal facility mapping and deploying low-power wireless communication and active temperature logging systems to improve efficiency, ensuring compliance with both local food safety transport rules and international pharmaceutical handling guidelines.

Market Dynamics

Our researchers analyzed the data with 2025 as the base year, along with the key drivers, trends, and challenges. A holistic analysis of drivers will help companies refine their marketing strategies to gain a competitive advantage.

  • Achieving supply chain excellence in the modern era hinges on mastering the intricacies of temperature-controlled logistics. The use of real-time temperature monitoring for biologics is now a baseline requirement, not a luxury, ensuring that life-saving medicines retain their efficacy.
  • The integration of blockchain for pharmaceutical supply chain integrity offers an immutable ledger, building trust and simplifying compliance with standards like DSCSA compliance for cold chain.
  • In the food sector, leveraging IoT sensors for perishable food transport is essential for reducing spoilage with predictive analytics, which has shown to improve year-over-year growth by more than the industry average of 11.2% for companies that adopt it fully. This level of control provides the end-to-end visibility in food logistics that modern consumers and retailers demand.
  • Inside the warehouse, the debate over FEFO vs FIFO in cold storage is being settled by data-driven insights from wireless sensors for warehouse thermal mapping, which also contributes to energy optimization in refrigerated warehouses. For transportation, the use of telematics for refrigerated truck fleets and specialized last-mile monitoring for grocery delivery is crucial.
  • The market is also addressing ultra-specialized needs like cryogenic logistics for cell therapies. Key considerations for decision-makers include weighing the benefits of reusable data loggers vs single-use models and managing the cost of high implementation for monitoring. Overcoming connectivity challenges in remote logistics and ensuring the interoperability of monitoring platforms are critical, as are mitigating cybersecurity risks for IoT devices.
  • Ultimately, meeting standards for regulatory compliance for food transport and maintaining GDP in pharmaceutical shipping is non-negotiable. Success also depends on the ability of AI to predict equipment failure, turning reactive measures into proactive strategies.

What are the key market drivers leading to the rise in the adoption of Cold Chain Monitoring Industry?

  • Increasing regulatory stringency in pharmaceutical logistics is a primary driver compelling market adoption of advanced monitoring solutions.

  • The market is driven by strict Good Distribution Practice compliance, which mandates automated audit trail generation. This has reduced compliance errors by over 40% for early adopters.
  • The rising consumer demand for fresh goods and a focus on food waste reduction are also key drivers, compelling the adoption of spoilage mitigation strategies and shelf-life extension technology.
  • Real-time visibility solutions help cut post-harvest losses, which exceed 25% in some supply chains. Further, the convergence of technologies like cryogenic shipping solutions and automated manifest systems enables a shift to prescriptive analytics.
  • This supports cell and gene therapy logistics, improves drug traceability compliance, and promotes climate-controlled logistics and product shelf life optimization through advanced pharmaceutical handling guidelines.

What are the market trends shaping the Cold Chain Monitoring Industry?

  • The integration of predictive analytics is emerging as a pivotal trend in cold chain logistics. This advancement is transforming reactive monitoring into proactive supply chain management.

  • A pivotal trend is the shift to predictive excursion alerting, powered by AI analyzing data from intelligent packaging systems. This has improved forecast accuracy by over 20% and reduced spoilage by up to 15%. Sustainability initiatives are also spurring innovation in reusable time-temperature indicators and floriculture supply chain optimization.
  • The adoption of blockchain supply chain records is gaining traction for high-value perishables monitoring, ensuring immutable data integrity and an unbroken chain of custody. This use of distributed ledger technology supports DSCSA traceability standards and facilitates compliance reporting automation. These trends enable proactive risk management, transforming logistics with enhanced temperature stability validation and automated shipping documentation.

What challenges does the Cold Chain Monitoring Industry face during its growth?

  • The high implementation and operational costs associated with advanced systems present a significant challenge to market growth.

  • High implementation costs are a primary barrier, with total cost of ownership being up to three times higher than passive methods, slowing the adoption of sanitary transport protocols and advanced clinical trial material handling solutions.
  • A lack of standardization creates data silos; manual data reconciliation increases error rates by up to 10%, hindering a unified digital product identification system and granular traceability. Connectivity gaps disrupt temperature excursion management and FEFO inventory management. Moreover, cybersecurity vulnerabilities threaten Bluetooth Low Energy connectivity and data from ultra-low temperature transport, impacting the entire inventory rotation strategy.
  • This affects remote asset tracking and the ability to meet stringent food safety transport rules.

Exclusive Technavio Analysis on Customer Landscape

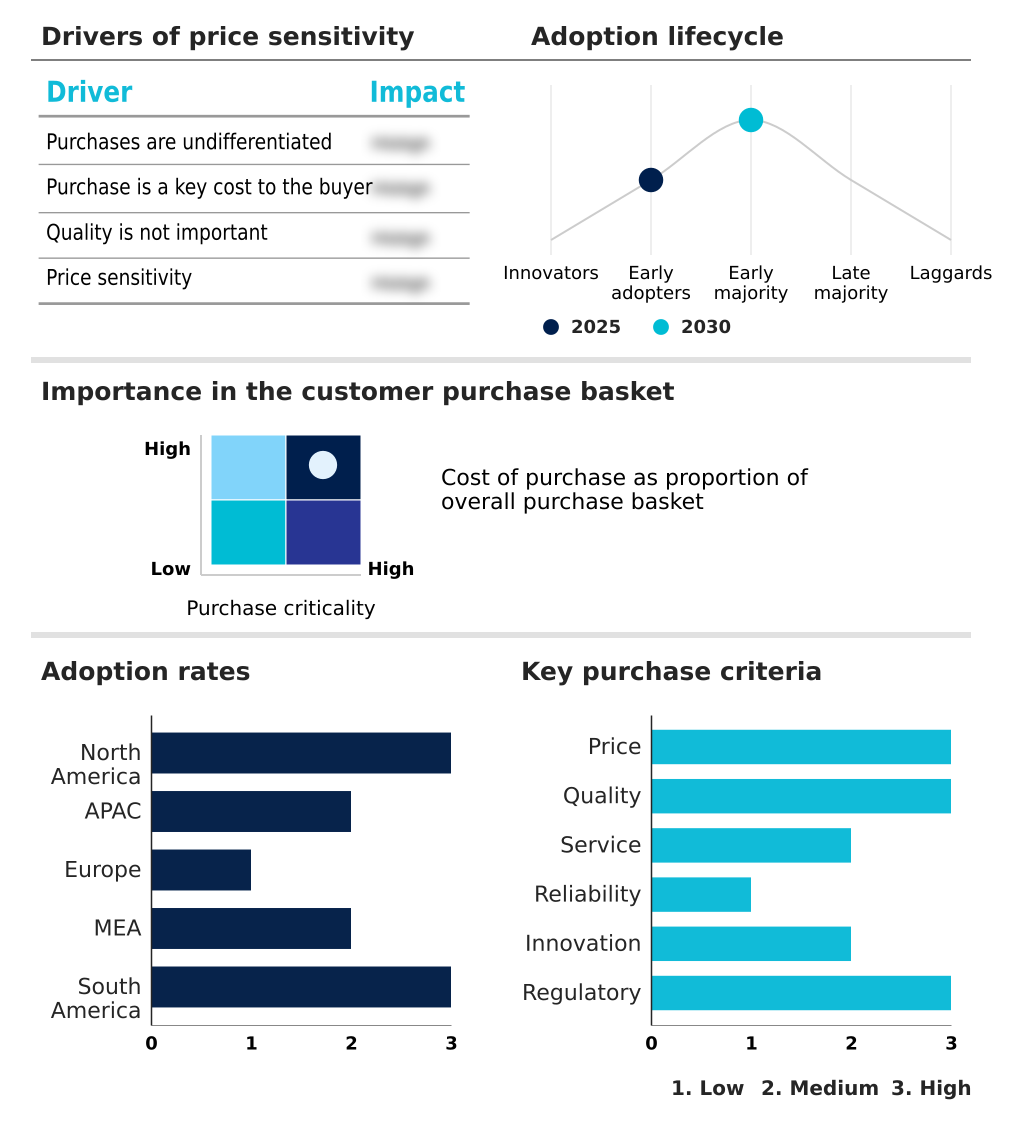
The cold chain monitoring market forecasting report includes the adoption lifecycle of the market, covering from the innovator’s stage to the laggard’s stage. It focuses on adoption rates in different regions based on penetration. Furthermore, the cold chain monitoring market report also includes key purchase criteria and drivers of price sensitivity to help companies evaluate and develop their market growth analysis strategies.

Customer Landscape of Cold Chain Monitoring Industry

Competitive Landscape

Companies are implementing various strategies, such as strategic alliances, cold chain monitoring market forecast, partnerships, mergers and acquisitions, geographical expansion, and product/service launches, to enhance their presence in the industry.

Avery Dennison Corp. - Integrated digital platforms provide end-to-end cold chain visibility and transport refrigeration solutions, ensuring integrity for temperature-sensitive assets through advanced operational intelligence.

The industry research and growth report includes detailed analyses of the competitive landscape of the market and information about key companies, including:

  • Avery Dennison Corp.
  • CalAmp Corp.
  • Carrier Global Corp.
  • Controlant
  • Copeland LP
  • Cryoport Systems, LLC
  • DeltaTrak Inc.
  • Dwyer Instruments LLC
  • E-Control Systems
  • Ellab AS
  • Geotab Inc.
  • Logmore
  • Monnit Corp.
  • Onset Computer Corp.
  • ORBCOMM Inc.
  • Samsara Inc.
  • SpotSee
  • Testo SE and Co. KGaA
  • Vaisala Oyj
  • Zebra Technologies Corp.

Qualitative and quantitative analysis of companies has been conducted to help clients understand the wider business environment as well as the strengths and weaknesses of key industry players. Data is qualitatively analyzed to categorize companies as pure play, category-focused, industry-focused, and diversified; it is quantitatively analyzed to categorize companies as dominant, leading, strong, tentative, and weak.

Recent Development and News in Cold chain monitoring market

  • In August 2025, Zebra Technologies introduced an IoT-enabled cold chain monitoring solution incorporating advanced analytics and machine-learning capabilities, aimed at delivering real-time visibility and predictive alerting across end-to-end logistics networks.
  • In November 2025, UPS completed the acquisition of Andlauer Healthcare Group for $1.6 billion, strengthening its position in complex healthcare logistics and accelerating its expansion as a global leader in temperature-controlled and healthcare supply chain services.
  • In October 2025, Carrier Global Corporation announced that its venture arm made a strategic investment in Net Feasa, a pioneer in wireless IoT connectivity and vessel network technology, to support real-time container visibility at sea.
  • In April 2025, Identiv and Tag-N-Trac formed a strategic collaboration to develop Bluetooth-enabled smart labels and SaaS-based traceability solutions for pharmaceutical cold chain deliveries, enabling real-time monitoring of product condition and location from warehouse through final delivery.

Dive into Technavio’s robust research methodology, blending expert interviews, extensive data synthesis, and validated models for unparalleled Cold Chain Monitoring Market insights. See full methodology.

Market Scope
Page number 284
Base year 2025
Historic period 2020-2024
Forecast period 2026-2030
Growth momentum & CAGR Accelerate at a CAGR of 11.6%
Market growth 2026-2030 USD 5913.5 million
Market structure Fragmented
YoY growth 2025-2026(%) 11.2%
Key countries US, Canada, Mexico, China, India, Japan, South Korea, Australia, Indonesia, Germany, UK, France, Italy, The Netherlands, Spain, UAE, Saudi Arabia, South Africa, Turkey, Israel, Brazil, Argentina and Colombia
Competitive landscape Leading Companies, Market Positioning of Companies, Competitive Strategies, and Industry Risks

Request Free Sample

Research Analyst Overview

  • The market is defined by a rapid technological evolution from passive data collection to intelligent, predictive oversight. The integration of advanced environmental sensors with cloud-based analytics platforms provides unprecedented control over temperature-sensitive supply chains. This shift directly impacts boardroom strategy, as investment in end-to-end supply chain visibility is no longer just an operational upgrade but a critical risk mitigation tool.
  • For instance, deploying real-time monitoring solutions for biologics transport safety has been demonstrated to reduce product loss from temperature excursions by over 40%. The ability to generate an automated audit trail for Good Distribution Practice compliance and meet DSCSA traceability standards is now a competitive differentiator.
  • Boardrooms must now weigh the capital expenditure of implementing these systems against the substantial financial and reputational risks of supply chain failures, making it a central pillar of modern logistics strategy. This is especially true for clinical trial material handling and cell and gene therapy logistics, where product integrity is paramount.

What are the Key Data Covered in this Cold Chain Monitoring Market Research and Growth Report?

  • What is the expected growth of the Cold Chain Monitoring Market between 2026 and 2030?

    • USD 5.91 billion, at a CAGR of 11.6%

  • What segmentation does the market report cover?

    • The report is segmented by Component (Hardware, and Software), End-user (Food and beverages, Healthcare and pharmaceuticals, and Others), Application (Transportation, and Storage) and Geography (North America, APAC, Europe, Middle East and Africa, South America)

  • Which regions are analyzed in the report?

    • North America, APAC, Europe, Middle East and Africa and South America

  • What are the key growth drivers and market challenges?

    • Increasing regulatory stringency in pharmaceutical logistics, High implementation and operational costs

  • Who are the major players in the Cold Chain Monitoring Market?

    • Avery Dennison Corp., CalAmp Corp., Carrier Global Corp., Controlant, Copeland LP, Cryoport Systems, LLC, DeltaTrak Inc., Dwyer Instruments LLC, E-Control Systems, Ellab AS, Geotab Inc., Logmore, Monnit Corp., Onset Computer Corp., ORBCOMM Inc., Samsara Inc., SpotSee, Testo SE and Co. KGaA, Vaisala Oyj and Zebra Technologies Corp.

Market Research Insights

  • The market's dynamics are shaped by a push for greater efficiency and transparency. Adopting automated shipping documentation has reduced paperwork errors by over 90% for logistics providers. The use of advanced active temperature logging provides continuous data streams, enabling companies to meet compliance standards with greater accuracy.
  • For instance, implementing an integrated sensor ecosystem has been shown to reduce energy consumption in cold storage facilities by up to 12%. Furthermore, the demand for visual excursion indicators and smart packaging labels on individual products is increasing, providing last-mile assurance to consumers and reducing disputes over product quality by 20%.
  • These innovations are central to building a resilient and accountable supply chain.

We can help! Our analysts can customize this cold chain monitoring market research report to meet your requirements.

Get in touch

1. Executive Summary

1.1 Market overview

Executive Summary - Chart on Market Overview
Executive Summary - Data Table on Market Overview
Executive Summary - Chart on Global Market Characteristics
Executive Summary - Chart on Market by Geography
Executive Summary - Chart on Market Segmentation by Component
Executive Summary - Chart on Market Segmentation by End-user
Executive Summary - Chart on Market Segmentation by Application
Executive Summary - Chart on Incremental Growth
Executive Summary - Data Table on Incremental Growth
Executive Summary - Chart on Company Market Positioning

2. Technavio Analysis

2.1 Analysis of price sensitivity, lifecycle, customer purchase basket, adoption rates, and purchase criteria

2.2 Criticality of inputs and Factors of differentiation

Chart on Overview on criticality of inputs and factors of differentiation

2.3 Factors of disruption

Chart on Overview on factors of disruption

2.4 Impact of drivers and challenges

Chart on Impact of drivers and challenges in 2025 and 2030

3. Market Landscape

3.1 Market ecosystem

Chart on Parent Market
Data Table on - Parent Market

3.2 Market characteristics

Chart on Market characteristics analysis

3.3 Value chain analysis

Chart on Value chain analysis

4. Market Sizing

4.1 Market definition

Data Table on Offerings of companies included in the market definition

4.2 Market segment analysis

Market segments

4.3 Market size 2025

4.4 Market outlook: Forecast for 2025-2030

Chart on Global - Market size and forecast 2025-2030 ($ million)
Data Table on Global - Market size and forecast 2025-2030 ($ million)
Chart on Global Market: Year-over-year growth 2025-2030 (%)
Data Table on Global Market: Year-over-year growth 2025-2030 (%)

5. Historic Market Size

5.1 Global Cold Chain Monitoring Market 2020 - 2024

Historic Market Size - Data Table on Global Cold Chain Monitoring Market 2020 - 2024 ($ million)

5.2 Component segment analysis 2020 - 2024

Historic Market Size - Component Segment 2020 - 2024 ($ million)

5.3 End-user segment analysis 2020 - 2024

Historic Market Size - End-user Segment 2020 - 2024 ($ million)

5.4 Application segment analysis 2020 - 2024

Historic Market Size - Application Segment 2020 - 2024 ($ million)

5.5 Geography segment analysis 2020 - 2024

Historic Market Size - Geography Segment 2020 - 2024 ($ million)

5.6 Country segment analysis 2020 - 2024

Historic Market Size - Country Segment 2020 - 2024 ($ million)

6. Qualitative Analysis

6.1 Impact of AI on Global Cold Chain Monitoring Market

7. Five Forces Analysis

7.1 Five forces summary

Five forces analysis - Comparison between 2025 and 2030

7.2 Bargaining power of buyers

Bargaining power of buyers - Impact of key factors 2025 and 2030

7.3 Bargaining power of suppliers

Bargaining power of suppliers - Impact of key factors in 2025 and 2030

7.4 Threat of new entrants

Threat of new entrants - Impact of key factors in 2025 and 2030

7.5 Threat of substitutes

Threat of substitutes - Impact of key factors in 2025 and 2030

7.6 Threat of rivalry

Threat of rivalry - Impact of key factors in 2025 and 2030

7.7 Market condition

Chart on Market condition - Five forces 2025 and 2030

8. Market Segmentation by Component

8.1 Market segments

Chart on Component - Market share 2025-2030 (%)
Data Table on Component - Market share 2025-2030 (%)

8.2 Comparison by Component

Chart on Comparison by Component
Data Table on Comparison by Component

8.3 Hardware - Market size and forecast 2025-2030

Chart on Hardware - Market size and forecast 2025-2030 ($ million)
Data Table on Hardware - Market size and forecast 2025-2030 ($ million)
Chart on Hardware - Year-over-year growth 2025-2030 (%)
Data Table on Hardware - Year-over-year growth 2025-2030 (%)

8.4 Software - Market size and forecast 2025-2030

Chart on Software - Market size and forecast 2025-2030 ($ million)
Data Table on Software - Market size and forecast 2025-2030 ($ million)
Chart on Software - Year-over-year growth 2025-2030 (%)
Data Table on Software - Year-over-year growth 2025-2030 (%)

8.5 Market opportunity by Component

Market opportunity by Component ($ million)
Data Table on Market opportunity by Component ($ million)

9. Market Segmentation by End-user

9.1 Market segments

Chart on End-user - Market share 2025-2030 (%)
Data Table on End-user - Market share 2025-2030 (%)

9.2 Comparison by End-user

Chart on Comparison by End-user
Data Table on Comparison by End-user

9.3 Food and beverages - Market size and forecast 2025-2030

Chart on Food and beverages - Market size and forecast 2025-2030 ($ million)
Data Table on Food and beverages - Market size and forecast 2025-2030 ($ million)
Chart on Food and beverages - Year-over-year growth 2025-2030 (%)
Data Table on Food and beverages - Year-over-year growth 2025-2030 (%)

9.4 Healthcare and pharmaceuticals - Market size and forecast 2025-2030

Chart on Healthcare and pharmaceuticals - Market size and forecast 2025-2030 ($ million)
Data Table on Healthcare and pharmaceuticals - Market size and forecast 2025-2030 ($ million)
Chart on Healthcare and pharmaceuticals - Year-over-year growth 2025-2030 (%)
Data Table on Healthcare and pharmaceuticals - Year-over-year growth 2025-2030 (%)

9.5 Others - Market size and forecast 2025-2030

Chart on Others - Market size and forecast 2025-2030 ($ million)
Data Table on Others - Market size and forecast 2025-2030 ($ million)
Chart on Others - Year-over-year growth 2025-2030 (%)
Data Table on Others - Year-over-year growth 2025-2030 (%)

9.6 Market opportunity by End-user

Market opportunity by End-user ($ million)
Data Table on Market opportunity by End-user ($ million)

10. Market Segmentation by Application

10.1 Market segments

Chart on Application - Market share 2025-2030 (%)
Data Table on Application - Market share 2025-2030 (%)

10.2 Comparison by Application

Chart on Comparison by Application
Data Table on Comparison by Application

10.3 Transportation - Market size and forecast 2025-2030

Chart on Transportation - Market size and forecast 2025-2030 ($ million)
Data Table on Transportation - Market size and forecast 2025-2030 ($ million)
Chart on Transportation - Year-over-year growth 2025-2030 (%)
Data Table on Transportation - Year-over-year growth 2025-2030 (%)

10.4 Storage - Market size and forecast 2025-2030

Chart on Storage - Market size and forecast 2025-2030 ($ million)
Data Table on Storage - Market size and forecast 2025-2030 ($ million)
Chart on Storage - Year-over-year growth 2025-2030 (%)
Data Table on Storage - Year-over-year growth 2025-2030 (%)

10.5 Market opportunity by Application

Market opportunity by Application ($ million)
Data Table on Market opportunity by Application ($ million)

11. Customer Landscape

11.1 Customer landscape overview

Analysis of price sensitivity, lifecycle, customer purchase basket, adoption rates, and purchase criteria

12. Geographic Landscape

12.1 Geographic segmentation

Chart on Market share by geography 2025-2030 (%)
Data Table on Market share by geography 2025-2030 (%)

12.2 Geographic comparison

Chart on Geographic comparison
Data Table on Geographic comparison

12.3 North America - Market size and forecast 2025-2030

Chart on North America - Market size and forecast 2025-2030 ($ million)
Data Table on North America - Market size and forecast 2025-2030 ($ million)
Chart on North America - Year-over-year growth 2025-2030 (%)
Data Table on North America - Year-over-year growth 2025-2030 (%)
Chart on Regional Comparison - North America
Data Table on Regional Comparison - North America

12.3.1 US - Market size and forecast 2025-2030

Chart on US - Market size and forecast 2025-2030 ($ million)
Data Table on US - Market size and forecast 2025-2030 ($ million)
Chart on US - Year-over-year growth 2025-2030 (%)
Data Table on US - Year-over-year growth 2025-2030 (%)

12.3.2 Canada - Market size and forecast 2025-2030

Chart on Canada - Market size and forecast 2025-2030 ($ million)
Data Table on Canada - Market size and forecast 2025-2030 ($ million)
Chart on Canada - Year-over-year growth 2025-2030 (%)
Data Table on Canada - Year-over-year growth 2025-2030 (%)

12.3.3 Mexico - Market size and forecast 2025-2030

Chart on Mexico - Market size and forecast 2025-2030 ($ million)
Data Table on Mexico - Market size and forecast 2025-2030 ($ million)
Chart on Mexico - Year-over-year growth 2025-2030 (%)
Data Table on Mexico - Year-over-year growth 2025-2030 (%)

12.4 APAC - Market size and forecast 2025-2030

Chart on APAC - Market size and forecast 2025-2030 ($ million)
Data Table on APAC - Market size and forecast 2025-2030 ($ million)
Chart on APAC - Year-over-year growth 2025-2030 (%)
Data Table on APAC - Year-over-year growth 2025-2030 (%)
Chart on Regional Comparison - APAC
Data Table on Regional Comparison - APAC

12.4.1 China - Market size and forecast 2025-2030

Chart on China - Market size and forecast 2025-2030 ($ million)
Data Table on China - Market size and forecast 2025-2030 ($ million)
Chart on China - Year-over-year growth 2025-2030 (%)
Data Table on China - Year-over-year growth 2025-2030 (%)

12.4.2 India - Market size and forecast 2025-2030

Chart on India - Market size and forecast 2025-2030 ($ million)
Data Table on India - Market size and forecast 2025-2030 ($ million)
Chart on India - Year-over-year growth 2025-2030 (%)
Data Table on India - Year-over-year growth 2025-2030 (%)

12.4.3 Japan - Market size and forecast 2025-2030

Chart on Japan - Market size and forecast 2025-2030 ($ million)
Data Table on Japan - Market size and forecast 2025-2030 ($ million)
Chart on Japan - Year-over-year growth 2025-2030 (%)
Data Table on Japan - Year-over-year growth 2025-2030 (%)

12.4.4 South Korea - Market size and forecast 2025-2030

Chart on South Korea - Market size and forecast 2025-2030 ($ million)
Data Table on South Korea - Market size and forecast 2025-2030 ($ million)
Chart on South Korea - Year-over-year growth 2025-2030 (%)
Data Table on South Korea - Year-over-year growth 2025-2030 (%)

12.4.5 Australia - Market size and forecast 2025-2030

Chart on Australia - Market size and forecast 2025-2030 ($ million)
Data Table on Australia - Market size and forecast 2025-2030 ($ million)
Chart on Australia - Year-over-year growth 2025-2030 (%)
Data Table on Australia - Year-over-year growth 2025-2030 (%)

12.4.6 Indonesia - Market size and forecast 2025-2030

Chart on Indonesia - Market size and forecast 2025-2030 ($ million)
Data Table on Indonesia - Market size and forecast 2025-2030 ($ million)
Chart on Indonesia - Year-over-year growth 2025-2030 (%)
Data Table on Indonesia - Year-over-year growth 2025-2030 (%)

12.5 Europe - Market size and forecast 2025-2030

Chart on Europe - Market size and forecast 2025-2030 ($ million)
Data Table on Europe - Market size and forecast 2025-2030 ($ million)
Chart on Europe - Year-over-year growth 2025-2030 (%)
Data Table on Europe - Year-over-year growth 2025-2030 (%)
Chart on Regional Comparison - Europe
Data Table on Regional Comparison - Europe

12.5.1 Germany - Market size and forecast 2025-2030

Chart on Germany - Market size and forecast 2025-2030 ($ million)
Data Table on Germany - Market size and forecast 2025-2030 ($ million)
Chart on Germany - Year-over-year growth 2025-2030 (%)
Data Table on Germany - Year-over-year growth 2025-2030 (%)

12.5.2 UK - Market size and forecast 2025-2030

Chart on UK - Market size and forecast 2025-2030 ($ million)
Data Table on UK - Market size and forecast 2025-2030 ($ million)
Chart on UK - Year-over-year growth 2025-2030 (%)
Data Table on UK - Year-over-year growth 2025-2030 (%)

12.5.3 France - Market size and forecast 2025-2030

Chart on France - Market size and forecast 2025-2030 ($ million)
Data Table on France - Market size and forecast 2025-2030 ($ million)
Chart on France - Year-over-year growth 2025-2030 (%)
Data Table on France - Year-over-year growth 2025-2030 (%)

12.5.4 Italy - Market size and forecast 2025-2030

Chart on Italy - Market size and forecast 2025-2030 ($ million)
Data Table on Italy - Market size and forecast 2025-2030 ($ million)
Chart on Italy - Year-over-year growth 2025-2030 (%)
Data Table on Italy - Year-over-year growth 2025-2030 (%)

12.5.5 The Netherlands - Market size and forecast 2025-2030

Chart on The Netherlands - Market size and forecast 2025-2030 ($ million)
Data Table on The Netherlands - Market size and forecast 2025-2030 ($ million)
Chart on The Netherlands - Year-over-year growth 2025-2030 (%)
Data Table on The Netherlands - Year-over-year growth 2025-2030 (%)

12.5.6 Spain - Market size and forecast 2025-2030

Chart on Spain - Market size and forecast 2025-2030 ($ million)
Data Table on Spain - Market size and forecast 2025-2030 ($ million)
Chart on Spain - Year-over-year growth 2025-2030 (%)
Data Table on Spain - Year-over-year growth 2025-2030 (%)

12.6 Middle East and Africa - Market size and forecast 2025-2030

Chart on Middle East and Africa - Market size and forecast 2025-2030 ($ million)
Data Table on Middle East and Africa - Market size and forecast 2025-2030 ($ million)
Chart on Middle East and Africa - Year-over-year growth 2025-2030 (%)
Data Table on Middle East and Africa - Year-over-year growth 2025-2030 (%)
Chart on Regional Comparison - Middle East and Africa
Data Table on Regional Comparison - Middle East and Africa

12.6.1 UAE - Market size and forecast 2025-2030

Chart on UAE - Market size and forecast 2025-2030 ($ million)
Data Table on UAE - Market size and forecast 2025-2030 ($ million)
Chart on UAE - Year-over-year growth 2025-2030 (%)
Data Table on UAE - Year-over-year growth 2025-2030 (%)

12.6.2 Saudi Arabia - Market size and forecast 2025-2030

Chart on Saudi Arabia - Market size and forecast 2025-2030 ($ million)
Data Table on Saudi Arabia - Market size and forecast 2025-2030 ($ million)
Chart on Saudi Arabia - Year-over-year growth 2025-2030 (%)
Data Table on Saudi Arabia - Year-over-year growth 2025-2030 (%)

12.6.3 South Africa - Market size and forecast 2025-2030

Chart on South Africa - Market size and forecast 2025-2030 ($ million)
Data Table on South Africa - Market size and forecast 2025-2030 ($ million)
Chart on South Africa - Year-over-year growth 2025-2030 (%)
Data Table on South Africa - Year-over-year growth 2025-2030 (%)

12.6.4 Turkey - Market size and forecast 2025-2030

Chart on Turkey - Market size and forecast 2025-2030 ($ million)
Data Table on Turkey - Market size and forecast 2025-2030 ($ million)
Chart on Turkey - Year-over-year growth 2025-2030 (%)
Data Table on Turkey - Year-over-year growth 2025-2030 (%)

12.6.5 Israel - Market size and forecast 2025-2030

Chart on Israel - Market size and forecast 2025-2030 ($ million)
Data Table on Israel - Market size and forecast 2025-2030 ($ million)
Chart on Israel - Year-over-year growth 2025-2030 (%)
Data Table on Israel - Year-over-year growth 2025-2030 (%)

12.7 South America - Market size and forecast 2025-2030

Chart on South America - Market size and forecast 2025-2030 ($ million)
Data Table on South America - Market size and forecast 2025-2030 ($ million)
Chart on South America - Year-over-year growth 2025-2030 (%)
Data Table on South America - Year-over-year growth 2025-2030 (%)
Chart on Regional Comparison - South America
Data Table on Regional Comparison - South America

12.7.1 Brazil - Market size and forecast 2025-2030

Chart on Brazil - Market size and forecast 2025-2030 ($ million)
Data Table on Brazil - Market size and forecast 2025-2030 ($ million)
Chart on Brazil - Year-over-year growth 2025-2030 (%)
Data Table on Brazil - Year-over-year growth 2025-2030 (%)

12.7.2 Argentina - Market size and forecast 2025-2030

Chart on Argentina - Market size and forecast 2025-2030 ($ million)
Data Table on Argentina - Market size and forecast 2025-2030 ($ million)
Chart on Argentina - Year-over-year growth 2025-2030 (%)
Data Table on Argentina - Year-over-year growth 2025-2030 (%)

12.7.3 Colombia - Market size and forecast 2025-2030

Chart on Colombia - Market size and forecast 2025-2030 ($ million)
Data Table on Colombia - Market size and forecast 2025-2030 ($ million)
Chart on Colombia - Year-over-year growth 2025-2030 (%)
Data Table on Colombia - Year-over-year growth 2025-2030 (%)

12.8 Market opportunity by geography

Market opportunity by geography ($ million)
Data Tables on Market opportunity by geography ($ million)

13. Drivers, Challenges, and Opportunity

13.1 Market drivers

Increasing regulatory stringency in pharmaceutical logistics
Surging demand for fresh food and waste reduction initiatives
Technological convergence of IoT, AI, and blockchain

13.2 Market challenges

High implementation and operational costs
Standardization and interoperability issues
Connectivity limitations and cybersecurity risks

13.3 Impact of drivers and challenges

Impact of drivers and challenges in 2025 and 2030

13.4 Market opportunities

Integration of predictive analytics in cold chain logistics
Sustainability and rise of green cold chain technologies
Enhanced supply chain visibility through cloud platforms

14. Competitive Landscape

14.1 Overview

14.2

Overview on criticality of inputs and factors of differentiation

14.3 Landscape disruption

Overview on factors of disruption

14.4 Industry risks

Impact of key risks on business

15. Competitive Analysis

15.1 Companies profiled

Companies covered

15.2 Company ranking index

15.3 Market positioning of companies

Matrix on companies position and classification

15.4 Avery Dennison Corp.

Avery Dennison Corp. - Overview
Avery Dennison Corp. - Business segments
Avery Dennison Corp. - Key news
Avery Dennison Corp. - Key offerings
Avery Dennison Corp. - Segment focus
SWOT

15.5 Carrier Global Corp.

Carrier Global Corp. - Overview
Carrier Global Corp. - Business segments
Carrier Global Corp. - Key news
Carrier Global Corp. - Key offerings
Carrier Global Corp. - Segment focus
SWOT

15.6 Controlant

Controlant - Overview
Controlant - Product / Service
Controlant - Key offerings
SWOT

15.7 Copeland LP

Copeland LP - Overview
Copeland LP - Product / Service
Copeland LP - Key offerings
SWOT

15.8 Cryoport Systems, LLC

Cryoport Systems, LLC - Overview
Cryoport Systems, LLC - Product / Service
Cryoport Systems, LLC - Key offerings
SWOT

15.9 DeltaTrak Inc.

DeltaTrak Inc. - Overview
DeltaTrak Inc. - Product / Service
DeltaTrak Inc. - Key offerings
SWOT

15.10 Geotab Inc.

Geotab Inc. - Overview
Geotab Inc. - Product / Service
Geotab Inc. - Key news
Geotab Inc. - Key offerings
SWOT

15.11 Monnit Corp.

Monnit Corp. - Overview
Monnit Corp. - Product / Service
Monnit Corp. - Key offerings
SWOT

15.12 Onset Computer Corp.

Onset Computer Corp. - Overview
Onset Computer Corp. - Product / Service
Onset Computer Corp. - Key offerings
SWOT

15.13 ORBCOMM Inc.

ORBCOMM Inc. - Overview
ORBCOMM Inc. - Product / Service
ORBCOMM Inc. - Key offerings
SWOT

15.14 Samsara Inc.

Samsara Inc. - Overview
Samsara Inc. - Product / Service
Samsara Inc. - Key offerings
SWOT

15.15 SpotSee

SpotSee - Overview
SpotSee - Product / Service
SpotSee - Key offerings
SWOT

15.16 Testo SE and Co. KGaA

Testo SE and Co. KGaA - Overview
Testo SE and Co. KGaA - Product / Service
Testo SE and Co. KGaA - Key offerings
SWOT

15.17 Vaisala Oyj

Vaisala Oyj - Overview
Vaisala Oyj - Business segments
Vaisala Oyj - Key news
Vaisala Oyj - Key offerings
Vaisala Oyj - Segment focus
SWOT

15.18 Zebra Technologies Corp.

Zebra Technologies Corp. - Overview
Zebra Technologies Corp. - Business segments
Zebra Technologies Corp. - Key news
Zebra Technologies Corp. - Key offerings
Zebra Technologies Corp. - Segment focus
SWOT

16. Appendix

16.1 Scope of the report

Market definition
Objectives
Notes and caveats

16.2 Inclusions and exclusions checklist

Inclusions checklist
Exclusions checklist

16.3 Currency conversion rates for US$

16.4 Research methodology

16.5 Data procurement

Information sources

16.6 Data validation

16.7 Validation techniques employed for market sizing

16.8 Data synthesis

16.9 360 degree market analysis

16.10 List of abbreviations

Research Methodology

Technavio presents a detailed picture of the market by way of study, synthesis, and summation of data from multiple sources. The analysts have presented the various facets of the market with a particular focus on identifying the key industry influencers. The data thus presented is comprehensive, reliable, and the result of extensive research, both primary and secondary.

INFORMATION SOURCES

Primary sources

  • Manufacturers and suppliers
  • Channel partners
  • Industry experts
  • Strategic decision makers

Secondary sources

  • Industry journals and periodicals
  • Government data
  • Financial reports of key industry players
  • Historical data
  • Press releases

DATA ANALYSIS

Data Synthesis

  • Collation of data
  • Estimation of key figures
  • Analysis of derived insights

Data Validation

  • Triangulation with data models
  • Reference against proprietary databases
  • Corroboration with industry experts

REPORT WRITING

Qualitative

  • Market drivers
  • Market challenges
  • Market trends
  • Five forces analysis

Quantitative

  • Market size and forecast
  • Market segmentation
  • Geographical insights
  • Competitive landscape

Interested in this report?

Get your sample now to see our research methodology and insights!

Download Now

Frequently Asked Questions

Cold Chain Monitoring market growth will increase by USD 5913.5 million during 2026-2030.

The Cold Chain Monitoring market is expected to grow at a CAGR of 11.6% during 2026-2030.

Cold Chain Monitoring market is segmented by Component (Hardware, Software) End-user (Food and beverages, Healthcare and pharmaceuticals, Others) Application (Transportation, Storage)

Avery Dennison Corp., CalAmp Corp., Carrier Global Corp., Controlant, Copeland LP, Cryoport Systems, LLC, DeltaTrak Inc., Dwyer Instruments LLC, E-Control Systems, Ellab AS, Geotab Inc., Logmore, Monnit Corp., Onset Computer Corp., ORBCOMM Inc., Samsara Inc., SpotSee, Testo SE and Co. KGaA, Vaisala Oyj, Zebra Technologies Corp. are a few of the key vendors in the Cold Chain Monitoring market.

APAC will register the highest growth rate of 33.5% among the other regions. Therefore, the Cold Chain Monitoring market in APAC is expected to garner significant business opportunities for the vendors during the forecast period.

US, Canada, Mexico, China, India, Japan, South Korea, Australia, Indonesia, Germany, UK, France, Italy, The Netherlands, Spain, UAE, Saudi Arabia, South Africa, Turkey, Israel, Brazil, Argentina, Colombia

  • Increasing regulatory stringency in pharmaceutical logistics is the driving factor this market.

The Cold Chain Monitoring market vendors should focus on grabbing business opportunities from the Component segment as it accounted for the largest market share in the base year.
RIA - Research AI Assistant
Ask RIA