Commercial Aircraft Parts Manufacturer Approval (PMA) Market Analysis, Size, and Forecast 2026-2030: APAC (China, Japan, and India), North America (US, Canada, and Mexico), Europe (Germany, France, and UK), Middle East and Africa (UAE, Saudi Arabia, and Turkey), South America (Brazil and Argentina), and Rest of World (ROW)

Commercial Aircraft Parts Manufacturer Approval (PMA) Market Analysis, Size, and Forecast 2026-2030:
APAC (China, Japan, and India), North America (US, Canada, and Mexico), Europe (Germany, France, and UK), Middle East and Africa (UAE, Saudi Arabia, and Turkey), South America (Brazil and Argentina), and Rest of World (ROW)

Published: May 2026 301 Pages SKU: IRTNTR43537

Market Overview at a Glance

$216 Mn
Market Opportunity
5.4%
CAGR 2025 - 2030
43.5%
APAC Growth
$331.6 Mn
Engine segment 2024

Commercial Aircraft Parts Manufacturer Approval (PMA) Market Size 2026-2030

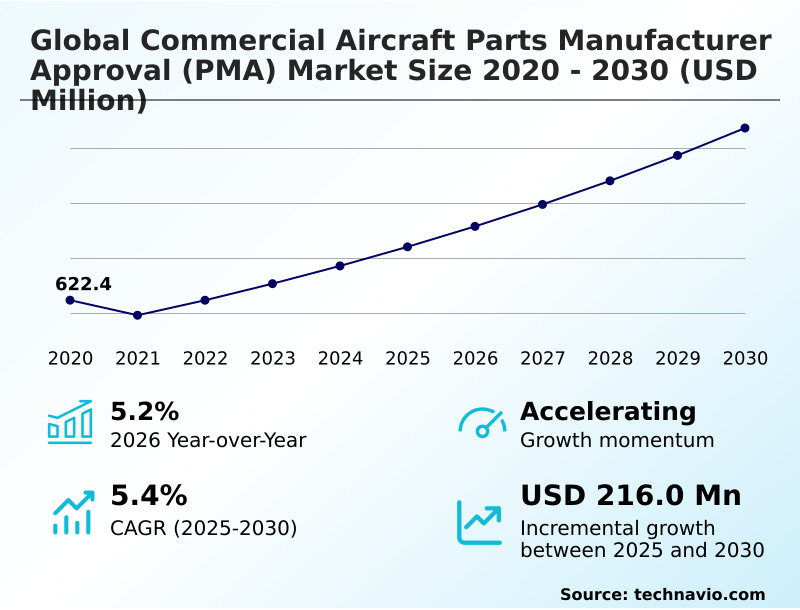
The commercial aircraft parts manufacturer approval (pma) market size is valued to increase by USD 216 million, at a CAGR of 5.4% from 2025 to 2030. Escalating maintenance, repair, and overhaul expenditures and structural cost reduction pressures will drive the commercial aircraft parts manufacturer approval (pma) market.

Major Market Trends & Insights

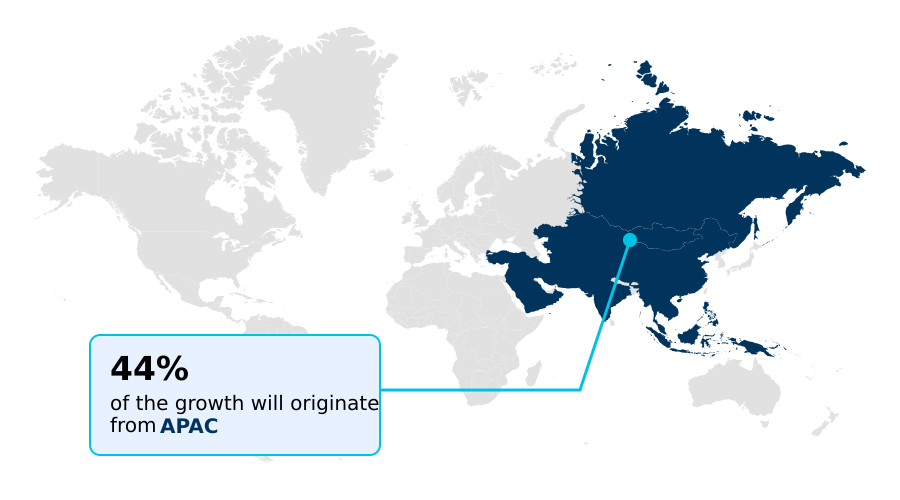
  • APAC dominated the market and accounted for a 43.5% growth during the forecast period.
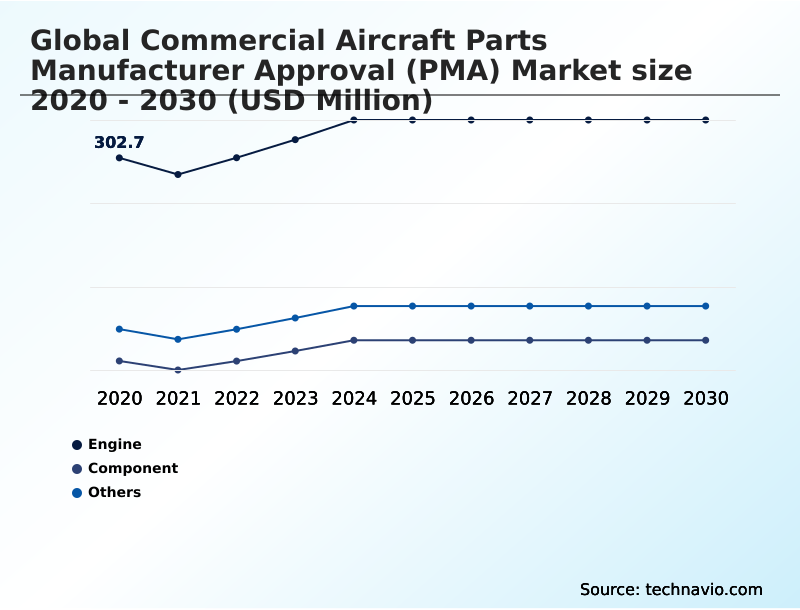
  • By Type - Engine segment was valued at USD 331.6 million in 2024
  • By Application - Small widebody segment accounted for the largest market revenue share in 2024

Market Size & Forecast

  • Market Opportunities: USD 313 million
  • Market Future Opportunities: USD 216 million
  • CAGR from 2025 to 2030 : 5.4%

Market Summary

  • The Commercial Aircraft Parts Manufacturer Approval (PMA) market is characterized by a dynamic interplay between cost optimization and stringent safety regulations. A core driver is the escalating pressure on airlines to reduce maintenance, repair, and overhaul (MRO) expenditures without compromising airworthiness. This has led to the strategic adoption of PMA components, which offer significant cost advantages over OEM parts.
  • For instance, a mid-sized airline managing an aging fleet can implement a PMA-based procurement strategy to reduce its annual spend on expendable parts by a considerable margin, directly improving its cost per available seat kilometer. This is balanced by challenges, including navigating complex international certification processes and countering the narrative from OEMs regarding asset valuation.
  • A prominent trend is the technological advancement within the PMA sector, particularly in reverse-engineering and additive manufacturing. These innovations are enabling third-party manufacturers to produce highly complex parts, such as turbine blades and flight control components, that were previously the exclusive domain of OEMs.
  • This shift is expanding the addressable market for PMA providers and fostering a more competitive and resilient aerospace aftermarket ecosystem, pushing providers to innovate on material science and part longevity.

What will be the Size of the Commercial Aircraft Parts Manufacturer Approval (PMA) Market during the forecast period?

Get Key Insights on Market Forecast (PDF) Request Free Sample

How is the Commercial Aircraft Parts Manufacturer Approval (PMA) Market Segmented?

The commercial aircraft parts manufacturer approval (pma) industry research report provides comprehensive data (region-wise segment analysis), with forecasts and estimates in "USD million" for the period 2026-2030, as well as historical data from 2020-2024 for the following segments.

  • Type
    • Engine
    • Component
    • Others
  • Application
    • Small widebody
    • Medium widebody
    • Large widebody
  • Service type
    • Certification authority
    • Aircraft OEM
  • Geography
    • APAC
      • China
      • Japan
      • India
    • North America
      • US
      • Canada
      • Mexico
    • Europe
      • Germany
      • France
      • UK
    • Middle East and Africa
      • UAE
      • Saudi Arabia
      • Turkey
    • South America
      • Brazil
      • Argentina
    • Rest of World (ROW)

By Type Insights

The engine segment is estimated to witness significant growth during the forecast period.

The engine segment, a critical area of the market, focuses on high-value parts such as engine core components and turbine engine components.

This domain requires rigorous engineering to produce aftermarket replacement parts for hydraulic systems and fuel conveyance components, often leveraging predictive diagnostic tools. Manufacturers develop sophisticated avionics subsystems and parts for environmental control system parts that rival original equipment.

The technical complexity is high, with the failure rate for some new applications involving intricate aircraft electrical components rising by as much as 15% due to stringent stress and fatigue performance requirements.

Success hinges on advanced engineering and the integration of embedded sensor technology to meet airworthiness standards without compromising performance, addressing both used serviceable material and new fuel system innovations in fluid power technology.

Request Free Sample

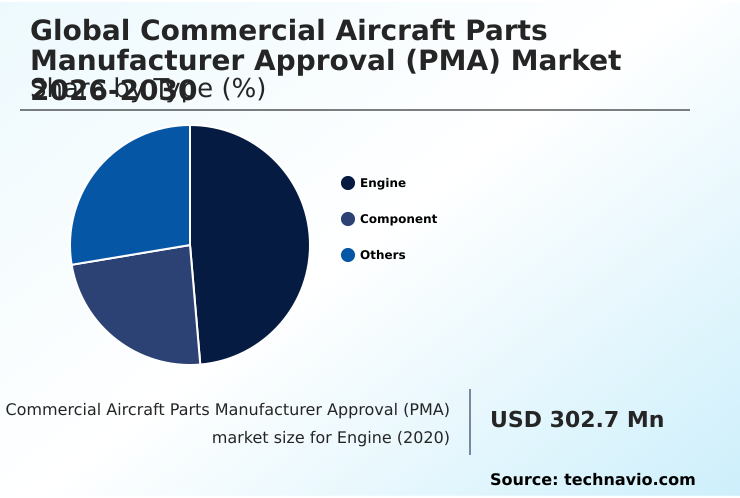
The Engine segment was valued at USD 331.6 million in 2024 and showed a gradual increase during the forecast period.

Request Free Sample

Regional Analysis

APAC is estimated to contribute 43.5% to the growth of the global market during the forecast period.Technavio’s analysts have elaborately explained the regional trends and drivers that shape the market during the forecast period.

See How Commercial Aircraft Parts Manufacturer Approval (PMA) Market Demand is Rising in APAC Request Free Sample

The market's geographic distribution reflects a mature landscape in North America and rapid expansion in APAC, where growth is outpacing the global average by nearly 2%.

In established regions, the focus is on optimizing dual-source inventory management and leveraging bilateral air safety agreements to streamline the use of line replaceable units and flight control components.

This practice can improve parts availability by up to 25%, directly impacting fleet readiness.

In contrast, emerging regions are building their aerostructure fabrication capabilities for parts like fuselage assemblies and structural castings, with a strong emphasis on PMA certification and airworthiness certification.

These regions are also addressing the complexities of aircraft asset valuation when integrating PMA parts for forged components, non-critical system parts, and cabin interior retrofits to support their growing fleets and MRO ecosystems.

Market Dynamics

Our researchers analyzed the data with 2025 as the base year, along with the key drivers, trends, and challenges. A holistic analysis of drivers will help companies refine their marketing strategies to gain a competitive advantage.

  • The strategic adoption of PMA components is reshaping airline maintenance budgets and supply chain architectures. A critical consideration for operators is the FAA approval process for PMA parts, which ensures compliance with airworthiness directives. The cost savings of PMA vs OEM components are a primary driver, with some carriers reporting double-digit reductions in MRO costs with PMA sourcing.
  • However, fleet managers must also assess the impact of PMA parts on aircraft resale value. For operators of older planes, PMA solutions for legacy aircraft engines are essential for extending operational life economically. The industry is also navigating the challenges of reverse-engineering composite PMA parts, where the role of additive manufacturing in PMA production is becoming increasingly vital.
  • Overcoming regulatory hurdles for international PMA certification is key to unlocking global market potential, while blockchain traceability for life-limited PMA parts addresses provenance concerns. Sustainability benefits of using PMA components are now a key part of ESG reporting.
  • Market trends show strong demand for PMA for structural and aerostructure components in narrow-body aircraft, while PMA supply chain diversification benefits are critical for operational resilience. The future of PMA in next-generation aircraft will depend on solving complex issues related to PMA for high-value avionics systems and managing OEM resistance to PMA parts.

What are the key market drivers leading to the rise in the adoption of Commercial Aircraft Parts Manufacturer Approval (PMA) Industry?

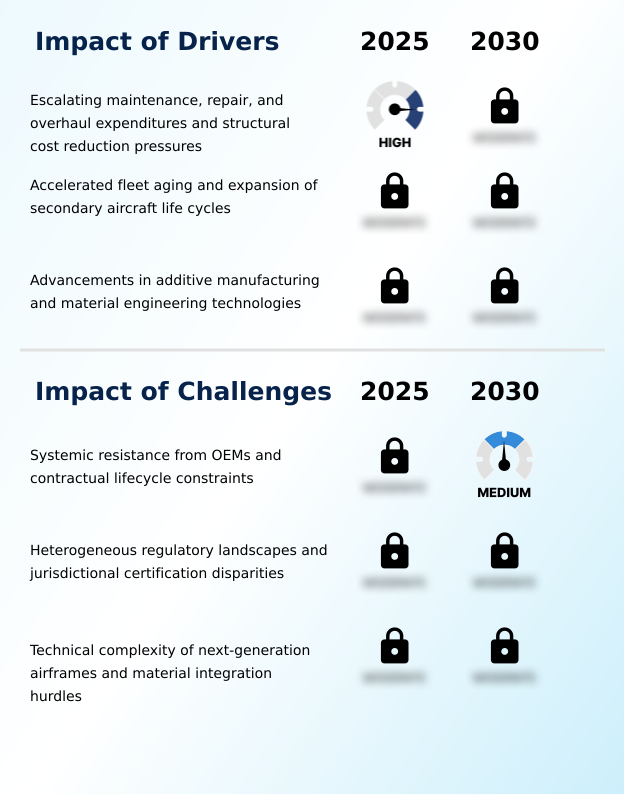
  • Escalating maintenance, repair, and overhaul (MRO) expenditures, coupled with structural cost-reduction pressures on airlines, serve as the primary driver for market growth.

  • Market growth is significantly propelled by economic and technological drivers. Airlines are focused on reducing MRO expenditures, with engine overhaul costs being a primary target.
  • The adoption of parts made with high-performance alloys through additive manufacturing can reduce component weight by up to 15%, contributing to fuel savings. This is particularly relevant for secondary aircraft life cycles and legacy fleet maintenance.
  • Furthermore, the use of predictive maintenance tools enhances the value of aeroderivative gas turbine parts and power transmission components by forecasting failures before they occur.
  • Innovations in material engineering technologies are enabling the production of more durable aerospace bearings and cockpit hardware, directly addressing the demand for high-wear component replacement and extending the operational viability of aging aircraft, thus reducing total cost of ownership.

What are the market trends shaping the Commercial Aircraft Parts Manufacturer Approval (PMA) Industry?

  • The digital transformation of the aviation aftermarket is accelerating. A key trend involves the integration of blockchain technology to enhance the traceability and provenance of life-limited parts.

  • Key trends are reshaping the market, driven by digitalization and sustainability. The move toward green aftermarket solutions is compelling firms to adopt carbon-neutral manufacturing and align with sustainable procurement policies, which are increasingly tied to ESG compliance metrics. This has led to innovations in materials for parts like actuators and thermal barrier layers.
  • Concurrently, blockchain traceability systems are revolutionizing life-limited part management and traceability, with early adopters reporting a 40% improvement in record accuracy. This technology, combined with digital twin modeling, allows for precise tracking of high-pressure turbine blades and other critical components, ensuring they are compatible with sustainable aviation fuel.
  • These trends are not only enhancing safety and transparency but also providing verifiable data that supports a more circular and efficient aerospace economy.

What challenges does the Commercial Aircraft Parts Manufacturer Approval (PMA) Industry face during its growth?

  • Systemic resistance from original equipment manufacturers (OEMs) and the imposition of contractual lifecycle constraints present a key challenge to the industry's growth.

  • The market faces significant challenges from entrenched industry practices and technological hurdles. Persistent OEM pushback and the use of intellectual property constraints and bundled service agreements create substantial barriers to entry and adoption. Furthermore, the lack of harmonized regulatory standards across different jurisdictions complicates the certification of parts for next-generation airframes, which increasingly use proprietary data access models.
  • The technical complexity of modern aircraft, featuring integrated fly-by-wire systems and structural assemblies made of carbon-fiber reinforced polymers, demands advanced reverse-engineering and non-destructive testing capabilities. Developing PMA for complex wing components and motion control subsystems is capital-intensive, with development cycles often exceeding 18 months, posing a risk in a rapidly evolving technological landscape.

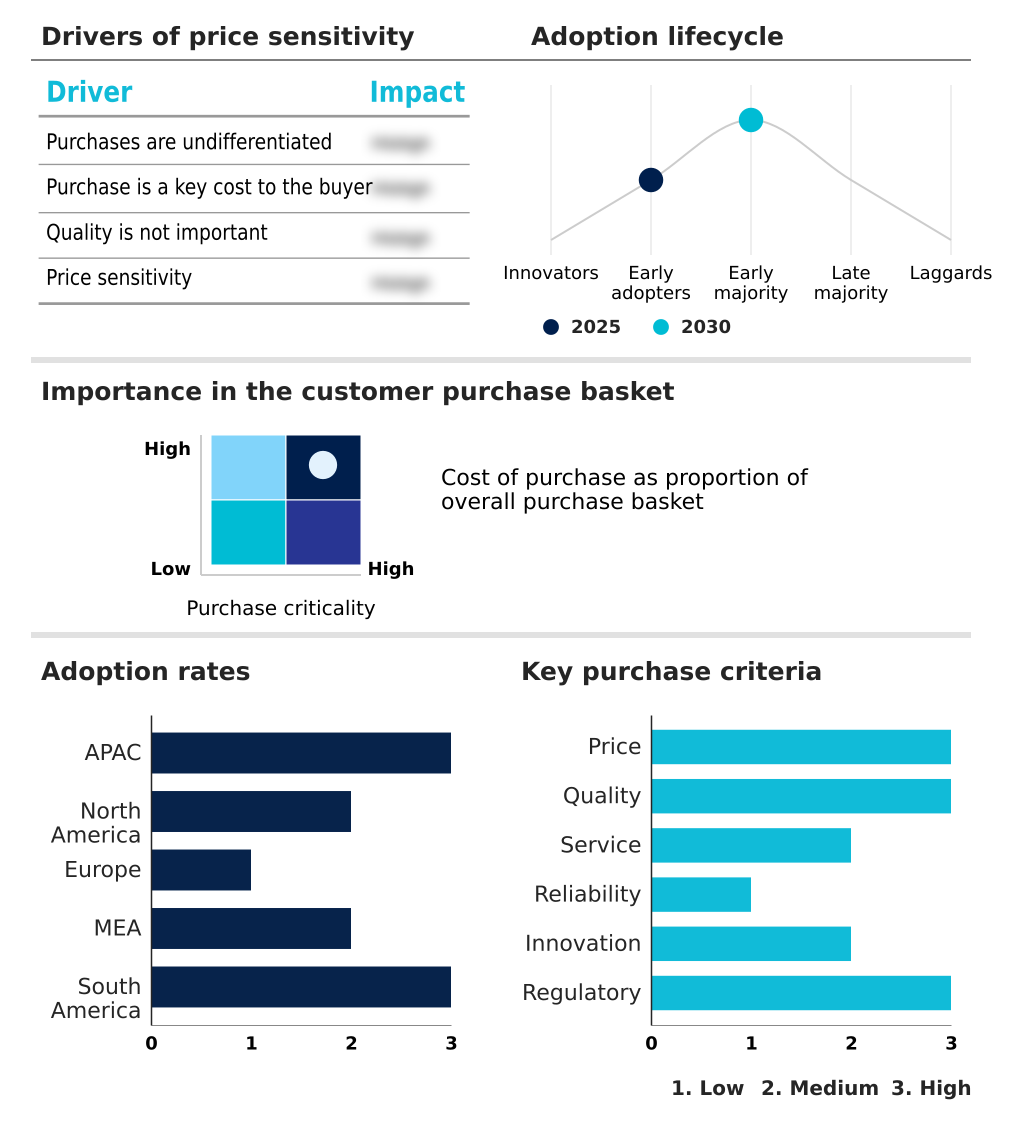
Exclusive Technavio Analysis on Customer Landscape

The commercial aircraft parts manufacturer approval (pma) market forecasting report includes the adoption lifecycle of the market, covering from the innovator’s stage to the laggard’s stage. It focuses on adoption rates in different regions based on penetration. Furthermore, the commercial aircraft parts manufacturer approval (pma) market report also includes key purchase criteria and drivers of price sensitivity to help companies evaluate and develop their market growth analysis strategies.

Customer Landscape of Commercial Aircraft Parts Manufacturer Approval (PMA) Industry

Competitive Landscape

Companies are implementing various strategies, such as strategic alliances, commercial aircraft parts manufacturer approval (pma) market forecast, partnerships, mergers and acquisitions, geographical expansion, and product/service launches, to enhance their presence in the industry.

ADPma LLC - Analysis focuses on the design, certification, and manufacture of proprietary precision aircraft parts for airframe and engine systems within the aerospace aftermarket.

The industry research and growth report includes detailed analyses of the competitive landscape of the market and information about key companies, including:

  • ADPma LLC
  • Aero Brake and Spares Inc.
  • AMETEK Inc.
  • BAE Systems Plc
  • Chromalloy Gas Turbine LLC
  • Eaton Corp. Plc
  • General Electric Co.
  • HEICO Corp.
  • Honeywell International Inc.
  • Kellstrom Aerospace
  • Moog Inc.
  • Parker Hannifin Corp.
  • Precision Castparts Corp.
  • RBC Bearings Inc.
  • RTX Corp.
  • Safran SA
  • Spirit AeroSystems Inc.
  • The Timken Co.
  • TransDigm Group Inc.
  • Wencor Group LLC

Qualitative and quantitative analysis of companies has been conducted to help clients understand the wider business environment as well as the strengths and weaknesses of key industry players. Data is qualitatively analyzed to categorize companies as pure play, category-focused, industry-focused, and diversified; it is quantitatively analyzed to categorize companies as dominant, leading, strong, tentative, and weak.

Recent Development and News in Commercial aircraft parts manufacturer approval (pma) market

  • In October 2024, VSE Corp. announced a definitive agreement to acquire Kellstrom Aerospace Group for approximately $200 million, aiming to strengthen its position in the commercial aviation aftermarket.
  • In January 2025, TransDigm Group Inc. announced the acquisition of a specialized Parts Manufacturer Approval (PMA) provider focused on complex hydraulic systems, enhancing its portfolio of line replaceable units.
  • In April 2025, HEICO Corp. highlighted its continued operational safety (COS) and voluntary safety management systems (SMS) integration into PMA development and production processes across its FAA-PMA parts manufacturing.
  • In May 2025, Parker Hannifin Corp. secured FAA approval for a new line of Parts Manufacturer Approval (PMA) components utilizing advanced composite materials designed for next-generation narrow-body aircraft fuel systems.

Dive into Technavio’s robust research methodology, blending expert interviews, extensive data synthesis, and validated models for unparalleled Commercial Aircraft Parts Manufacturer Approval (PMA) Market insights. See full methodology.

Market Scope
Page number 301
Base year 2025
Historic period 2020-2024
Forecast period 2026-2030
Growth momentum & CAGR Accelerate at a CAGR of 5.4%
Market growth 2026-2030 USD 216.0 million
Market structure Fragmented
YoY growth 2025-2026(%) 5.2%
Key countries China, Japan, India, South Korea, Australia, Indonesia, US, Canada, Mexico, Germany, France, UK, Italy, Spain, The Netherlands, UAE, Saudi Arabia, Turkey, South Africa, Israel, Brazil, Argentina and Chile
Competitive landscape Leading Companies, Market Positioning of Companies, Competitive Strategies, and Industry Risks

Request Free Sample

Research Analyst Overview

  • The Commercial Aircraft Parts Manufacturer Approval (PMA) market is evolving from a cost-saving alternative to a strategic necessity for airline operations. The integration of advanced technologies such as additive manufacturing and predictive maintenance tools is enabling the production of high-value engine core components and parts for hydraulic systems.
  • Boardroom-level decisions are increasingly influenced by the ability of PMA to ensure supply chain resilience, with some operators achieving a 30% reduction in lead times for critical turbine engine components. The development of high-performance alloys and sophisticated reverse-engineering techniques allows for the creation of complex flight control components, avionics subsystems, and environmental control system parts.
  • This technological push is expanding the scope of PMA to include items like actuators, latching systems, and even cockpit hardware. As a result, PMA providers are not just replicating parts but are also innovating in areas like thermal barrier layers and high pressure turbine blades, offering enhanced performance and durability for the global fleet.

What are the Key Data Covered in this Commercial Aircraft Parts Manufacturer Approval (PMA) Market Research and Growth Report?

  • What is the expected growth of the Commercial Aircraft Parts Manufacturer Approval (PMA) Market between 2026 and 2030?

    • USD 216 million, at a CAGR of 5.4%

  • What segmentation does the market report cover?

    • The report is segmented by Type (Engine, Component, and Others), Application (Small widebody, Medium widebody, and Large widebody), Service Type (Certification authority, and Aircraft OEM) and Geography (APAC, North America, Europe, Middle East and Africa, South America)

  • Which regions are analyzed in the report?

    • APAC, North America, Europe, Middle East and Africa and South America

  • What are the key growth drivers and market challenges?

    • Escalating maintenance, repair, and overhaul expenditures and structural cost reduction pressures, Systemic resistance from OEMs and contractual lifecycle constraints

  • Who are the major players in the Commercial Aircraft Parts Manufacturer Approval (PMA) Market?

    • ADPma LLC, Aero Brake and Spares Inc., AMETEK Inc., BAE Systems Plc, Chromalloy Gas Turbine LLC, Eaton Corp. Plc, General Electric Co., HEICO Corp., Honeywell International Inc., Kellstrom Aerospace, Moog Inc., Parker Hannifin Corp., Precision Castparts Corp., RBC Bearings Inc., RTX Corp., Safran SA, Spirit AeroSystems Inc., The Timken Co., TransDigm Group Inc. and Wencor Group LLC

Market Research Insights

  • Market dynamics are increasingly shaped by sophisticated sourcing strategies aimed at balancing cost and performance. The adoption of green aftermarket solutions aligns with ESG compliance metrics, a factor now influencing over 60% of procurement decisions in some carriers. Meanwhile, blockchain traceability systems are enhancing life-limited part management, reducing tracking errors by up to 95%.
  • Airlines are leveraging these technologies to validate carbon-neutral manufacturing claims and support sustainable procurement policies. This data-driven approach to acquiring parts like actuators and thermal barrier layers provides a verifiable record of component history, which is critical for meeting stringent airworthiness standards and maintaining aircraft value.
  • The ability to track a high pressure turbine blade from production to installation using an immutable ledger represents a significant leap in operational integrity.

We can help! Our analysts can customize this commercial aircraft parts manufacturer approval (pma) market research report to meet your requirements.

Get in touch

1. Executive Summary

1.1 Market overview

Executive Summary - Chart on Market Overview
Executive Summary - Data Table on Market Overview
Executive Summary - Chart on Global Market Characteristics
Executive Summary - Chart on Market by Geography
Executive Summary - Chart on Market Segmentation by Type
Executive Summary - Chart on Market Segmentation by Application
Executive Summary - Chart on Market Segmentation by Service Type
Executive Summary - Chart on Incremental Growth
Executive Summary - Data Table on Incremental Growth
Executive Summary - Chart on Company Market Positioning

2. Technavio Analysis

2.1 Analysis of price sensitivity, lifecycle, customer purchase basket, adoption rates, and purchase criteria

2.2 Criticality of inputs and Factors of differentiation

Chart on Overview on criticality of inputs and factors of differentiation

2.3 Factors of disruption

Chart on Overview on factors of disruption

2.4 Impact of drivers and challenges

Chart on Impact of drivers and challenges in 2025 and 2030

3. Market Landscape

3.1 Market ecosystem

Chart on Parent Market
Data Table on - Parent Market

3.2 Market characteristics

Chart on Market characteristics analysis

3.3 Value chain analysis

Chart on Value chain analysis

4. Market Sizing

4.1 Market definition

Data Table on Offerings of companies included in the market definition

4.2 Market segment analysis

Market segments

4.3 Market size 2025

4.4 Market outlook: Forecast for 2025-2030

Chart on Global - Market size and forecast 2025-2030 ($ million)
Data Table on Global - Market size and forecast 2025-2030 ($ million)
Chart on Global Market: Year-over-year growth 2025-2030 (%)
Data Table on Global Market: Year-over-year growth 2025-2030 (%)

5. Historic Market Size

5.1 Global Commercial Aircraft Parts Manufacturer Approval (PMA) Market 2020 - 2024

Historic Market Size - Data Table on Global Commercial Aircraft Parts Manufacturer Approval (PMA) Market 2020 - 2024 ($ million)

5.2 Type segment analysis 2020 - 2024

Historic Market Size - Type Segment 2020 - 2024 ($ million)

5.3 Application segment analysis 2020 - 2024

Historic Market Size - Application Segment 2020 - 2024 ($ million)

5.4 Service Type segment analysis 2020 - 2024

Historic Market Size - Service Type Segment 2020 - 2024 ($ million)

5.5 Geography segment analysis 2020 - 2024

Historic Market Size - Geography Segment 2020 - 2024 ($ million)

5.6 Country segment analysis 2020 - 2024

Historic Market Size - Country Segment 2020 - 2024 ($ million)

6. Qualitative Analysis

6.1 Impact of AI on global commercial aircraft parts manufacturer approval (PMA) market

6.2 Impact of geopolitical conflict on global commercial aircraft parts manufacturer approval (PMA) market

7. Five Forces Analysis

7.1 Five forces summary

Five forces analysis - Comparison between 2025 and 2030

7.2 Bargaining power of buyers

Bargaining power of buyers - Impact of key factors 2025 and 2030

7.3 Bargaining power of suppliers

Bargaining power of suppliers - Impact of key factors in 2025 and 2030

7.4 Threat of new entrants

Threat of new entrants - Impact of key factors in 2025 and 2030

7.5 Threat of substitutes

Threat of substitutes - Impact of key factors in 2025 and 2030

7.6 Threat of rivalry

Threat of rivalry - Impact of key factors in 2025 and 2030

7.7 Market condition

Chart on Market condition - Five forces 2025 and 2030

8. Market Segmentation by Type

8.1 Market segments

Chart on Type - Market share 2025-2030 (%)
Data Table on Type - Market share 2025-2030 (%)

8.2 Comparison by Type

Chart on Comparison by Type
Data Table on Comparison by Type

8.3 Engine - Market size and forecast 2025-2030

Chart on Engine - Market size and forecast 2025-2030 ($ million)
Data Table on Engine - Market size and forecast 2025-2030 ($ million)
Chart on Engine - Year-over-year growth 2025-2030 (%)
Data Table on Engine - Year-over-year growth 2025-2030 (%)

8.4 Component - Market size and forecast 2025-2030

Chart on Component - Market size and forecast 2025-2030 ($ million)
Data Table on Component - Market size and forecast 2025-2030 ($ million)
Chart on Component - Year-over-year growth 2025-2030 (%)
Data Table on Component - Year-over-year growth 2025-2030 (%)

8.5 Others - Market size and forecast 2025-2030

Chart on Others - Market size and forecast 2025-2030 ($ million)
Data Table on Others - Market size and forecast 2025-2030 ($ million)
Chart on Others - Year-over-year growth 2025-2030 (%)
Data Table on Others - Year-over-year growth 2025-2030 (%)

8.6 Market opportunity by Type

Market opportunity by Type ($ million)
Data Table on Market opportunity by Type ($ million)

9. Market Segmentation by Application

9.1 Market segments

Chart on Application - Market share 2025-2030 (%)
Data Table on Application - Market share 2025-2030 (%)

9.2 Comparison by Application

Chart on Comparison by Application
Data Table on Comparison by Application

9.3 Small widebody - Market size and forecast 2025-2030

Chart on Small widebody - Market size and forecast 2025-2030 ($ million)
Data Table on Small widebody - Market size and forecast 2025-2030 ($ million)
Chart on Small widebody - Year-over-year growth 2025-2030 (%)
Data Table on Small widebody - Year-over-year growth 2025-2030 (%)

9.4 Medium widebody - Market size and forecast 2025-2030

Chart on Medium widebody - Market size and forecast 2025-2030 ($ million)
Data Table on Medium widebody - Market size and forecast 2025-2030 ($ million)
Chart on Medium widebody - Year-over-year growth 2025-2030 (%)
Data Table on Medium widebody - Year-over-year growth 2025-2030 (%)

9.5 Large widebody - Market size and forecast 2025-2030

Chart on Large widebody - Market size and forecast 2025-2030 ($ million)
Data Table on Large widebody - Market size and forecast 2025-2030 ($ million)
Chart on Large widebody - Year-over-year growth 2025-2030 (%)
Data Table on Large widebody - Year-over-year growth 2025-2030 (%)

9.6 Market opportunity by Application

Market opportunity by Application ($ million)
Data Table on Market opportunity by Application ($ million)

10. Market Segmentation by Service Type

10.1 Market segments

Chart on Service Type - Market share 2025-2030 (%)
Data Table on Service Type - Market share 2025-2030 (%)

10.2 Comparison by Service Type

Chart on Comparison by Service Type
Data Table on Comparison by Service Type

10.3 Certification authority - Market size and forecast 2025-2030

Chart on Certification authority - Market size and forecast 2025-2030 ($ million)
Data Table on Certification authority - Market size and forecast 2025-2030 ($ million)
Chart on Certification authority - Year-over-year growth 2025-2030 (%)
Data Table on Certification authority - Year-over-year growth 2025-2030 (%)

10.4 Aircraft OEM - Market size and forecast 2025-2030

Chart on Aircraft OEM - Market size and forecast 2025-2030 ($ million)
Data Table on Aircraft OEM - Market size and forecast 2025-2030 ($ million)
Chart on Aircraft OEM - Year-over-year growth 2025-2030 (%)
Data Table on Aircraft OEM - Year-over-year growth 2025-2030 (%)

10.5 Market opportunity by Service Type

Market opportunity by Service Type ($ million)
Data Table on Market opportunity by Service Type ($ million)

11. Customer Landscape

11.1 Customer landscape overview

Analysis of price sensitivity, lifecycle, customer purchase basket, adoption rates, and purchase criteria

12. Geographic Landscape

12.1 Geographic segmentation

Chart on Market share by geography 2025-2030 (%)
Data Table on Market share by geography 2025-2030 (%)

12.2 Geographic comparison

Chart on Geographic comparison
Data Table on Geographic comparison

12.3 APAC - Market size and forecast 2025-2030

Chart on APAC - Market size and forecast 2025-2030 ($ million)
Data Table on APAC - Market size and forecast 2025-2030 ($ million)
Chart on APAC - Year-over-year growth 2025-2030 (%)
Data Table on APAC - Year-over-year growth 2025-2030 (%)
Chart on Regional Comparison - APAC
Data Table on Regional Comparison - APAC

12.3.1 China - Market size and forecast 2025-2030

Chart on China - Market size and forecast 2025-2030 ($ million)
Data Table on China - Market size and forecast 2025-2030 ($ million)
Chart on China - Year-over-year growth 2025-2030 (%)
Data Table on China - Year-over-year growth 2025-2030 (%)

12.3.2 Japan - Market size and forecast 2025-2030

Chart on Japan - Market size and forecast 2025-2030 ($ million)
Data Table on Japan - Market size and forecast 2025-2030 ($ million)
Chart on Japan - Year-over-year growth 2025-2030 (%)
Data Table on Japan - Year-over-year growth 2025-2030 (%)

12.3.3 India - Market size and forecast 2025-2030

Chart on India - Market size and forecast 2025-2030 ($ million)
Data Table on India - Market size and forecast 2025-2030 ($ million)
Chart on India - Year-over-year growth 2025-2030 (%)
Data Table on India - Year-over-year growth 2025-2030 (%)

12.3.4 South Korea - Market size and forecast 2025-2030

Chart on South Korea - Market size and forecast 2025-2030 ($ million)
Data Table on South Korea - Market size and forecast 2025-2030 ($ million)
Chart on South Korea - Year-over-year growth 2025-2030 (%)
Data Table on South Korea - Year-over-year growth 2025-2030 (%)

12.3.5 Australia - Market size and forecast 2025-2030

Chart on Australia - Market size and forecast 2025-2030 ($ million)
Data Table on Australia - Market size and forecast 2025-2030 ($ million)
Chart on Australia - Year-over-year growth 2025-2030 (%)
Data Table on Australia - Year-over-year growth 2025-2030 (%)

12.3.6 Indonesia - Market size and forecast 2025-2030

Chart on Indonesia - Market size and forecast 2025-2030 ($ million)
Data Table on Indonesia - Market size and forecast 2025-2030 ($ million)
Chart on Indonesia - Year-over-year growth 2025-2030 (%)
Data Table on Indonesia - Year-over-year growth 2025-2030 (%)

12.4 North America - Market size and forecast 2025-2030

Chart on North America - Market size and forecast 2025-2030 ($ million)
Data Table on North America - Market size and forecast 2025-2030 ($ million)
Chart on North America - Year-over-year growth 2025-2030 (%)
Data Table on North America - Year-over-year growth 2025-2030 (%)
Chart on Regional Comparison - North America
Data Table on Regional Comparison - North America

12.4.1 US - Market size and forecast 2025-2030

Chart on US - Market size and forecast 2025-2030 ($ million)
Data Table on US - Market size and forecast 2025-2030 ($ million)
Chart on US - Year-over-year growth 2025-2030 (%)
Data Table on US - Year-over-year growth 2025-2030 (%)

12.4.2 Canada - Market size and forecast 2025-2030

Chart on Canada - Market size and forecast 2025-2030 ($ million)
Data Table on Canada - Market size and forecast 2025-2030 ($ million)
Chart on Canada - Year-over-year growth 2025-2030 (%)
Data Table on Canada - Year-over-year growth 2025-2030 (%)

12.4.3 Mexico - Market size and forecast 2025-2030

Chart on Mexico - Market size and forecast 2025-2030 ($ million)
Data Table on Mexico - Market size and forecast 2025-2030 ($ million)
Chart on Mexico - Year-over-year growth 2025-2030 (%)
Data Table on Mexico - Year-over-year growth 2025-2030 (%)

12.5 Europe - Market size and forecast 2025-2030

Chart on Europe - Market size and forecast 2025-2030 ($ million)
Data Table on Europe - Market size and forecast 2025-2030 ($ million)
Chart on Europe - Year-over-year growth 2025-2030 (%)
Data Table on Europe - Year-over-year growth 2025-2030 (%)
Chart on Regional Comparison - Europe
Data Table on Regional Comparison - Europe

12.5.1 Germany - Market size and forecast 2025-2030

Chart on Germany - Market size and forecast 2025-2030 ($ million)
Data Table on Germany - Market size and forecast 2025-2030 ($ million)
Chart on Germany - Year-over-year growth 2025-2030 (%)
Data Table on Germany - Year-over-year growth 2025-2030 (%)

12.5.2 France - Market size and forecast 2025-2030

Chart on France - Market size and forecast 2025-2030 ($ million)
Data Table on France - Market size and forecast 2025-2030 ($ million)
Chart on France - Year-over-year growth 2025-2030 (%)
Data Table on France - Year-over-year growth 2025-2030 (%)

12.5.3 UK - Market size and forecast 2025-2030

Chart on UK - Market size and forecast 2025-2030 ($ million)
Data Table on UK - Market size and forecast 2025-2030 ($ million)
Chart on UK - Year-over-year growth 2025-2030 (%)
Data Table on UK - Year-over-year growth 2025-2030 (%)

12.5.4 Italy - Market size and forecast 2025-2030

Chart on Italy - Market size and forecast 2025-2030 ($ million)
Data Table on Italy - Market size and forecast 2025-2030 ($ million)
Chart on Italy - Year-over-year growth 2025-2030 (%)
Data Table on Italy - Year-over-year growth 2025-2030 (%)

12.5.5 Spain - Market size and forecast 2025-2030

Chart on Spain - Market size and forecast 2025-2030 ($ million)
Data Table on Spain - Market size and forecast 2025-2030 ($ million)
Chart on Spain - Year-over-year growth 2025-2030 (%)
Data Table on Spain - Year-over-year growth 2025-2030 (%)

12.5.6 The Netherlands - Market size and forecast 2025-2030

Chart on The Netherlands - Market size and forecast 2025-2030 ($ million)
Data Table on The Netherlands - Market size and forecast 2025-2030 ($ million)
Chart on The Netherlands - Year-over-year growth 2025-2030 (%)
Data Table on The Netherlands - Year-over-year growth 2025-2030 (%)

12.6 Middle East and Africa - Market size and forecast 2025-2030

Chart on Middle East and Africa - Market size and forecast 2025-2030 ($ million)
Data Table on Middle East and Africa - Market size and forecast 2025-2030 ($ million)
Chart on Middle East and Africa - Year-over-year growth 2025-2030 (%)
Data Table on Middle East and Africa - Year-over-year growth 2025-2030 (%)
Chart on Regional Comparison - Middle East and Africa
Data Table on Regional Comparison - Middle East and Africa

12.6.1 UAE - Market size and forecast 2025-2030

Chart on UAE - Market size and forecast 2025-2030 ($ million)
Data Table on UAE - Market size and forecast 2025-2030 ($ million)
Chart on UAE - Year-over-year growth 2025-2030 (%)
Data Table on UAE - Year-over-year growth 2025-2030 (%)

12.6.2 Saudi Arabia - Market size and forecast 2025-2030

Chart on Saudi Arabia - Market size and forecast 2025-2030 ($ million)
Data Table on Saudi Arabia - Market size and forecast 2025-2030 ($ million)
Chart on Saudi Arabia - Year-over-year growth 2025-2030 (%)
Data Table on Saudi Arabia - Year-over-year growth 2025-2030 (%)

12.6.3 Turkey - Market size and forecast 2025-2030

Chart on Turkey - Market size and forecast 2025-2030 ($ million)
Data Table on Turkey - Market size and forecast 2025-2030 ($ million)
Chart on Turkey - Year-over-year growth 2025-2030 (%)
Data Table on Turkey - Year-over-year growth 2025-2030 (%)

12.6.4 South Africa - Market size and forecast 2025-2030

Chart on South Africa - Market size and forecast 2025-2030 ($ million)
Data Table on South Africa - Market size and forecast 2025-2030 ($ million)
Chart on South Africa - Year-over-year growth 2025-2030 (%)
Data Table on South Africa - Year-over-year growth 2025-2030 (%)

12.6.5 Israel - Market size and forecast 2025-2030

Chart on Israel - Market size and forecast 2025-2030 ($ million)
Data Table on Israel - Market size and forecast 2025-2030 ($ million)
Chart on Israel - Year-over-year growth 2025-2030 (%)
Data Table on Israel - Year-over-year growth 2025-2030 (%)

12.7 South America - Market size and forecast 2025-2030

Chart on South America - Market size and forecast 2025-2030 ($ million)
Data Table on South America - Market size and forecast 2025-2030 ($ million)
Chart on South America - Year-over-year growth 2025-2030 (%)
Data Table on South America - Year-over-year growth 2025-2030 (%)
Chart on Regional Comparison - South America
Data Table on Regional Comparison - South America

12.7.1 Brazil - Market size and forecast 2025-2030

Chart on Brazil - Market size and forecast 2025-2030 ($ million)
Data Table on Brazil - Market size and forecast 2025-2030 ($ million)
Chart on Brazil - Year-over-year growth 2025-2030 (%)
Data Table on Brazil - Year-over-year growth 2025-2030 (%)

12.7.2 Argentina - Market size and forecast 2025-2030

Chart on Argentina - Market size and forecast 2025-2030 ($ million)
Data Table on Argentina - Market size and forecast 2025-2030 ($ million)
Chart on Argentina - Year-over-year growth 2025-2030 (%)
Data Table on Argentina - Year-over-year growth 2025-2030 (%)

12.7.3 Chile - Market size and forecast 2025-2030

Chart on Chile - Market size and forecast 2025-2030 ($ million)
Data Table on Chile - Market size and forecast 2025-2030 ($ million)
Chart on Chile - Year-over-year growth 2025-2030 (%)
Data Table on Chile - Year-over-year growth 2025-2030 (%)

12.8 Market opportunity by geography

Market opportunity by geography ($ million)
Data Tables on Market opportunity by geography ($ million)

13. Drivers, Challenges, and Opportunity

13.1 Market drivers

Escalating maintenance, repair, and overhaul expenditures and structural cost reduction pressures
Accelerated fleet aging and expansion of secondary aircraft life cycles
Advancements in additive manufacturing and material engineering technologies

13.2 Market challenges

Systemic resistance from OEMs and contractual lifecycle constraints
Heterogeneous regulatory landscapes and jurisdictional certification disparities
Technical complexity of next-generation airframes and material integration hurdles

13.3 Impact of drivers and challenges

Impact of drivers and challenges in 2025 and 2030

13.4 Market opportunities

Digital transformation and integration of blockchain for life-limited part traceability
Strategic pivot toward engine core components and complex line replaceable units
Sustainability initiatives and rise of green aftermarket solutions

14. Competitive Landscape

14.1 Overview

14.2

Overview on criticality of inputs and factors of differentiation

14.3 Landscape disruption

Overview on factors of disruption

14.4 Industry risks

Impact of key risks on business

15. Competitive Analysis

15.1 Companies profiled

Companies covered

15.2 Company ranking index

15.3 Market positioning of companies

Matrix on companies position and classification

15.4 AMETEK Inc.

AMETEK Inc. - Overview
AMETEK Inc. - Business segments
AMETEK Inc. - Key offerings
AMETEK Inc. - Segment focus
SWOT

15.5 BAE Systems Plc

BAE Systems Plc - Overview
BAE Systems Plc - Business segments
BAE Systems Plc - Key offerings
BAE Systems Plc - Segment focus
SWOT

15.6 Chromalloy Gas Turbine LLC

Chromalloy Gas Turbine LLC - Overview
Chromalloy Gas Turbine LLC - Product / Service
Chromalloy Gas Turbine LLC - Key offerings
SWOT

15.7 Eaton Corp. Plc

Eaton Corp. Plc - Overview
Eaton Corp. Plc - Business segments
Eaton Corp. Plc - Key news
Eaton Corp. Plc - Key offerings
Eaton Corp. Plc - Segment focus
SWOT

15.8 General Electric Co.

General Electric Co. - Overview
General Electric Co. - Product / Service
General Electric Co. - Key offerings
SWOT

15.9 HEICO Corp.

HEICO Corp. - Overview
HEICO Corp. - Business segments
HEICO Corp. - Key offerings
HEICO Corp. - Segment focus
SWOT

15.10 Honeywell International Inc.

Honeywell International Inc. - Overview
Honeywell International Inc. - Business segments
Honeywell International Inc. - Key news
Honeywell International Inc. - Key offerings
Honeywell International Inc. - Segment focus
SWOT

15.11 Moog Inc.

Moog Inc. - Overview
Moog Inc. - Business segments
Moog Inc. - Key offerings
Moog Inc. - Segment focus
SWOT

15.12 Parker Hannifin Corp.

Parker Hannifin Corp. - Overview
Parker Hannifin Corp. - Business segments
Parker Hannifin Corp. - Key offerings
Parker Hannifin Corp. - Segment focus
SWOT

15.13 Precision Castparts Corp.

Precision Castparts Corp. - Overview
Precision Castparts Corp. - Product / Service
Precision Castparts Corp. - Key offerings
SWOT

15.14 RTX Corp.

RTX Corp. - Overview
RTX Corp. - Business segments
RTX Corp. - Key news
RTX Corp. - Key offerings
RTX Corp. - Segment focus
SWOT

15.15 Safran SA

Safran SA - Overview
Safran SA - Business segments
Safran SA - Key offerings
Safran SA - Segment focus
SWOT

15.16 Spirit AeroSystems Inc.

Spirit AeroSystems Inc. - Overview
Spirit AeroSystems Inc. - Business segments
Spirit AeroSystems Inc. - Key offerings
Spirit AeroSystems Inc. - Segment focus
SWOT

15.17 The Timken Co.

The Timken Co. - Overview
The Timken Co. - Business segments
The Timken Co. - Key offerings
The Timken Co. - Segment focus
SWOT

15.18 TransDigm Group Inc.

TransDigm Group Inc. - Overview
TransDigm Group Inc. - Business segments
TransDigm Group Inc. - Key offerings
TransDigm Group Inc. - Segment focus
SWOT

16. Appendix

16.1 Scope of the report

Market definition
Objectives
Notes and caveats

16.2 Inclusions and exclusions checklist

Inclusions checklist
Exclusions checklist

16.3 Currency conversion rates for US$

16.4 Research methodology

16.5 Data procurement

Information sources

16.6 Data validation

16.7 Validation techniques employed for market sizing

16.8 Data synthesis

16.9 360 degree market analysis

16.10 List of abbreviations

Research Methodology

Technavio presents a detailed picture of the market by way of study, synthesis, and summation of data from multiple sources. The analysts have presented the various facets of the market with a particular focus on identifying the key industry influencers. The data thus presented is comprehensive, reliable, and the result of extensive research, both primary and secondary.

INFORMATION SOURCES

Primary sources

  • Manufacturers and suppliers
  • Channel partners
  • Industry experts
  • Strategic decision makers

Secondary sources

  • Industry journals and periodicals
  • Government data
  • Financial reports of key industry players
  • Historical data
  • Press releases

DATA ANALYSIS

Data Synthesis

  • Collation of data
  • Estimation of key figures
  • Analysis of derived insights

Data Validation

  • Triangulation with data models
  • Reference against proprietary databases
  • Corroboration with industry experts

REPORT WRITING

Qualitative

  • Market drivers
  • Market challenges
  • Market trends
  • Five forces analysis

Quantitative

  • Market size and forecast
  • Market segmentation
  • Geographical insights
  • Competitive landscape

Interested in this report?

Get your sample now to see our research methodology and insights!

Download Now

Frequently Asked Questions

Commercial Aircraft Parts Manufacturer Approval (PMA) market growth will increase by USD 216.0 million during 2026-2030.

The Commercial Aircraft Parts Manufacturer Approval (PMA) market is expected to grow at a CAGR of 5.4% during 2026-2030.

Commercial Aircraft Parts Manufacturer Approval (PMA) market is segmented by Type (Engine, Component, Others) Application (Small widebody, Medium widebody, Large widebody) Service type (Certification authority, Aircraft OEM)

ADPma LLC, Aero Brake and Spares Inc., AMETEK Inc., BAE Systems Plc, Chromalloy Gas Turbine LLC, Eaton Corp. Plc, General Electric Co., HEICO Corp., Honeywell International Inc., Kellstrom Aerospace, Moog Inc., Parker Hannifin Corp., Precision Castparts Corp., RBC Bearings Inc., RTX Corp., Safran SA, Spirit AeroSystems Inc., The Timken Co., TransDigm Group Inc., Wencor Group LLC are a few of the key vendors in the Commercial Aircraft Parts Manufacturer Approval (PMA) market.

APAC will register the highest growth rate of 43.5% among the other regions. Therefore, the Commercial Aircraft Parts Manufacturer Approval (PMA) market in APAC is expected to garner significant business opportunities for the vendors during the forecast period.

China, Japan, India, South Korea, Australia, Indonesia, US, Canada, Mexico, Germany, France, UK, Italy, Spain, The Netherlands, UAE, Saudi Arabia, Turkey, South Africa, Israel, Brazil, Argentina, Chile

  • Escalating maintenance, repair, and overhaul expenditures and structural cost reduction pressures is the driving factor this market.

The Commercial Aircraft Parts Manufacturer Approval (PMA) market vendors should focus on grabbing business opportunities from the Type segment as it accounted for the largest market share in the base year.
RIA - Research AI Assistant
Ask RIA