Commercial Jar Blender Market Size 2025-2029
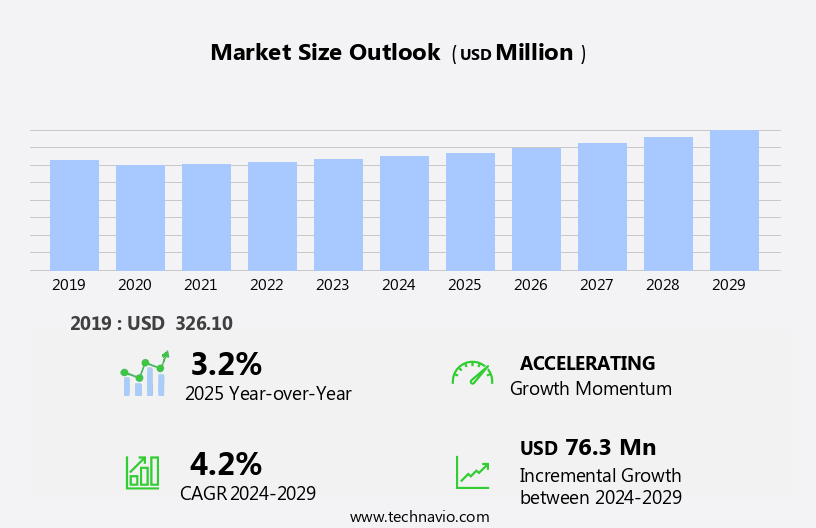
The commercial jar blender market size is forecast to increase by USD 76.3 million, at a CAGR of 4.2% between 2024 and 2029.
- The market is driven by the increasing demand for proper mixing of food ingredients in various industries, including food and beverage production and research laboratories. This need is fueled by the growing preference for homogeneous mixtures and consistent product quality. Another key trend in the market is the rise in BPA-free blender jar offerings, as concerns over health risks associated with BPA continue to mount. However, the market faces challenges from substitute products, such as immersion blenders and food processors, which offer similar functionalities and can be more cost-effective for certain applications.
- Companies seeking to capitalize on market opportunities should focus on innovating their product offerings to address the unique needs of various industries and offer BPA-free solutions. Navigating the challenges posed by substitute products will require a strong value proposition and effective marketing strategies to differentiate their offerings from competitors.
What will be the Size of the Commercial Jar Blender Market during the forecast period?
Explore in-depth regional segment analysis with market size data - historical 2019-2023 and forecasts 2025-2029 - in the full report.
Request Free Sample
The market continues to evolve, driven by the diverse needs of various sectors, including food service and restaurant applications. Stainless steel blades enable ice crushing and high-performance blending, while product development focuses on enhancing user experience through features such as digital displays, pre-programmed settings, and variable speed control. Manufacturing processes prioritize durable construction, dishwasher-safe parts, and safety interlocks to ensure long-term reliability. Motor power, ranging from watts to horsepower, caters to different blending requirements, with pulse functions and thermal protection ensuring efficient and consistent results. Food processors and immersion blenders cater to distinct market segments, with the latter gaining popularity due to their versatility and ease of use.
Online sales channels expand distribution networks, while consumer demand for energy efficiency, noise reduction, and brand loyalty drives innovation. Product differentiation is achieved through material composition, overload protection, and customer reviews. Competitor analysis shapes marketing strategies, with price point and control panel design playing crucial roles in attracting customers. The supply chain remains dynamic, with parts availability and bearing life influencing overall product performance and longevity. From nut butters to frozen drinks, commercial jar blenders continue to adapt to evolving consumer preferences and industry trends, ensuring their indispensable role in the food service landscape.
How is this Commercial Jar Blender Industry segmented?
The commercial jar blender industry research report provides comprehensive data (region-wise segment analysis), with forecasts and estimates in "USD million" for the period 2025-2029, as well as historical data from 2019-2023 for the following segments.
- Distribution Channel
- Offline
- Online
- Product
- Commercial jar blenders for food
- Commercial jar blenders for drinks
- Commercial jar blenders for food and drinks
- Type
- Heavy duty blenders
- Medium duty blenders
- Light duty blenders
- Material
- Plastic jar
- Metal jar
- Glass jar
- Others
- Geography
- North America
- US
- Canada
- Europe
- France
- Germany
- UK
- APAC
- Australia
- China
- India
- Japan
- South Korea
- Rest of World (ROW)
- North America
By Distribution Channel Insights
The offline segment is estimated to witness significant growth during the forecast period.
In the commercial kitchen market, offline distribution channels hold significant weight in catering to customers seeking a tangible interaction before making a purchase. These channels encompass department stores, specialty kitchen appliance stores, and home improvement centers. The benefits of offline distribution include the opportunity for customers to personally evaluate the product, understand its features, and receive expert advice from sales representatives. This hands-on experience aids consumers in making informed decisions, particularly when investing in a commercial jar blender that aligns with their specific requirements. The immediate availability of offline distribution enables customers to take their blenders home or integrate them into their commercial kitchens promptly.
Commercial jar blenders distinguish themselves through stainless steel blades, ice crushing capabilities, and food service applications, among other features. Product differentiation, user interface, and safety interlocks are essential considerations for customers. The market also offers personal blenders, stand blenders, and immersion blenders, each with varying jar capacities, digital displays, and motor powers. The manufacturing process ensures durability, dishwasher-safe parts, and long-lasting bearings. Consumer demand drives the supply chain, with nut butters and frozen drinks being popular applications. The market is characterized by competitor analysis, pre-programmed settings, overload protection, and thermal protection. Marketing strategies and product development are ongoing efforts to meet evolving consumer needs and preferences.
The product lifecycle includes variable speed control, pulse function, and energy consumption, among other factors. Safety features, such as lid seals and noise level (dB) considerations, are crucial for commercial use. Retail sales and online sales channels cater to diverse customer segments and preferences.
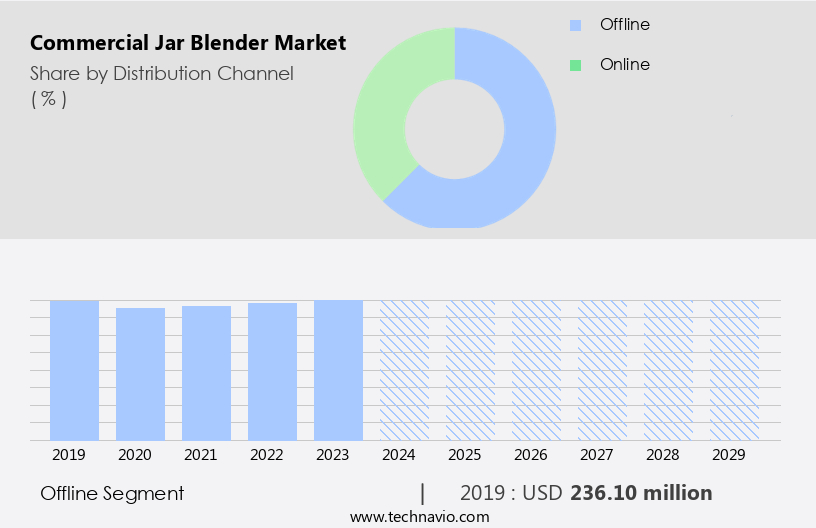
The Offline segment was valued at USD 236.10 million in 2019 and showed a gradual increase during the forecast period.
Regional Analysis
North America is estimated to contribute 34% to the growth of the global market during the forecast period. Technavio's analysts have elaborately explained the regional trends and drivers that shape the market during the forecast period.
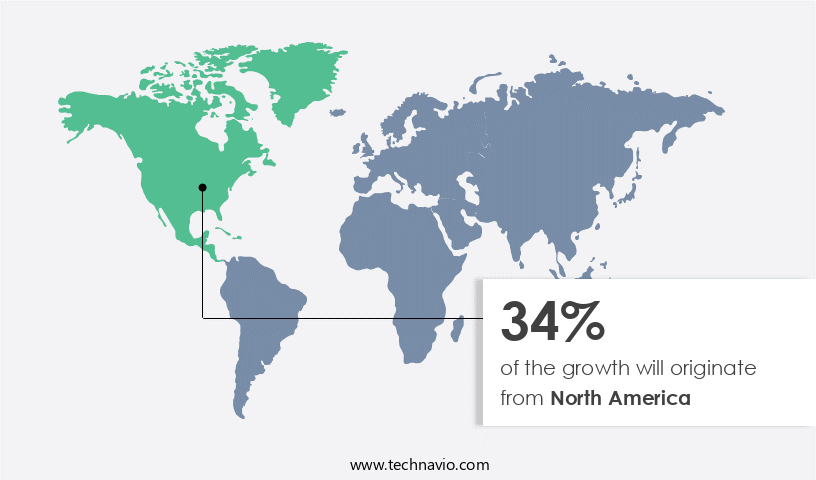
In North America, the market is witnessing significant growth due to the increasing demand for healthy drinks, particularly in the US and Canada. The food service industry's expansion is also driving the market's growth, as commercial jar blenders are essential for providing operational efficiency in juice shops, smoothie shops, and other food service establishments. Stainless steel blades and ice crushing capabilities are crucial features for these blenders in food service applications. Product differentiation through pre-programmed settings, control panels, and digital displays is becoming increasingly important for brands to stand out in the market. Personal blenders and handheld blenders are also gaining popularity for their convenience and portability.
The market is competitive, with brands focusing on product development, parts availability, and consumer demand to maintain brand loyalty. Consumer reviews and safety features are key considerations for customers, and manufacturers prioritize durable construction, dishwasher-safe parts, and overload protection. The manufacturing process involves high-speed blending, thermal protection, and variable speed control to ensure consistent product quality. The market's supply chain includes distribution channels, retail sales, and online sales, with energy consumption and motor power being essential factors for manufacturers to consider. Frozen drinks, nut butters, and food processors are also catered to by commercial jar blenders, making them versatile tools for food service establishments.
Market Dynamics
Our researchers analyzed the data with 2024 as the base year, along with the key drivers, trends, and challenges. A holistic analysis of drivers will help companies refine their marketing strategies to gain a competitive advantage.
In the dynamic and competitive market, businesses seek efficient and versatile solutions for food preparation and beverage production. Commercial jar blenders offer numerous advantages, including large capacity, durability, and ease of use. These blenders are essential for various industries, including food processing, catering, and beverage manufacturing. Key features of commercial jar blenders include powerful motors, shatterproof jars, and multiple speed settings. Additionally, they come in various sizes and designs, catering to diverse business needs. Sanitation is a top priority, with many models featuring easy-to-clean components and NSF certification. Innovative technologies, such as touchscreens and programmable settings, enhance functionality and productivity. Sustainability is also a consideration, with some commercial jar blenders featuring energy-efficient designs and recyclable parts. Overall, the market provides indispensable tools for businesses aiming to deliver high-quality products and streamlined operations.
What are the key market drivers leading to the rise in the adoption of Commercial Jar Blender Industry?
- The proper mixing of food ingredients is a crucial factor driving market growth and demand in the food industry.
- In the food service industry, consistency and operational efficiency are crucial for delivering high-quality dishes. Manual methods for mixing ingredients lack uniformity and are time-consuming. Commercial jar blenders offer a solution by enabling proper mixing of food ingredients, ensuring consistent texture, appearance, and taste. These blenders provide control through features such as variable speed control, timer function, and cleaning cycle. Safety is a priority, with safety features like thermal protection and blade material durability. Customer reviews and brand loyalty play a significant role in the purchasing decision.
- Stand blenders, with their power cords and large capacities, are ideal for restaurant use. Marketing strategies and product lifecycle management are essential for businesses to stay competitive. Commercial jar blenders provide a harmonious blend of functionality, efficiency, and safety, making them an indispensable tool in the food service industry.
What are the market trends shaping the Commercial Jar Blender Industry?
- The blender market is witnessing an upward trend with the growing availability of BPA-free blender jars. This eco-friendly development is a response to consumer demand for safer and healthier alternatives in kitchen appliances.
- Commercial jar blenders in the food industry have seen significant product development to meet consumer demands for BPA-free solutions. BPA, an organic synthetic compound, is commonly used in plastic production for various products, including water bottles and food containers. However, studies suggest that BPA can have detrimental effects on human health, particularly during fetal development and in children. In response, commercial jar blender manufacturers are focusing on providing BPA-free jars to cater to consumer preferences. For instance, Conair's Waring brand offers models like MX1000XTX, MX1050XTX, and MX1050XTXP, which come with BPA-free jars. Blendtec is another notable brand that provides BPA-free jars in their WildSide+ Jar and FourSide Jar models.
- Other essential features of commercial jar blenders include motor power (watts), pulse function, digital display, and jar capacity (liters). The manufacturing process ensures energy efficiency and motor type varies between immersion and canister blenders. Online sales have become a significant sales channel for commercial jar blenders, with frozen drinks being a popular application. Companies continue to innovate and improve their product offerings to meet the evolving needs of the food industry.
What challenges does the Commercial Jar Blender Industry face during its growth?
- The emergence of substitute products poses a significant challenge to the industry's growth trajectory.
- Commercial immersion blenders are essential appliances in professional kitchens due to their ability to blend large quantities of food efficiently. Unlike commercial jar blenders, these appliances feature detachable shafts that operate directly in a container, eliminating the need for a separate jar. The primary focus of end-users is operational efficiency and superior blending quality, which commercial immersion blenders deliver through advances such as ergonomic handles, improved variable speed settings, cordless models, and high torque motors. These advancements have significantly enhanced the blender's performance, making it a valuable asset in food service applications. The market for commercial immersion blenders is driven by consumer demand for high-quality food and beverages, as well as the need for efficient food preparation in commercial kitchens.
- Product differentiation is crucial in this market, with manufacturers focusing on price point, noise level, and lid seal design to cater to various customer segments. Competitor analysis plays a significant role in the market dynamics, with companies continually striving to outperform each other in terms of features, performance, and distribution channels.
Exclusive Customer Landscape
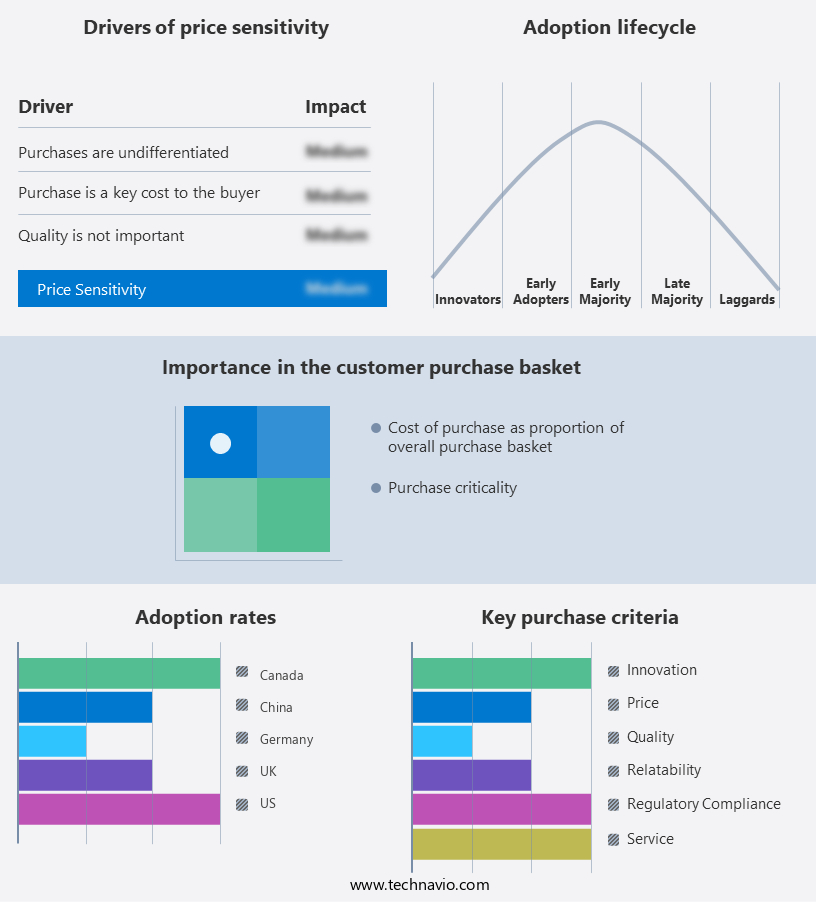
The commercial jar blender market forecasting report includes the adoption lifecycle of the market, covering from the innovator's stage to the laggard's stage. It focuses on adoption rates in different regions based on penetration. Furthermore, the commercial jar blender market report also includes key purchase criteria and drivers of price sensitivity to help companies evaluate and develop their market growth analysis strategies.
Customer Landscape
Key Companies & Market Insights
Companies are implementing various strategies, such as strategic alliances, commercial jar blender market forecast, partnerships, mergers and acquisitions, geographical expansion, and product/service launches, to enhance their presence in the industry.
bianco di puro GmbH and Co. KG - The company specializes in providing a range of commercial-grade jar blenders, including the Gusto A, Gusto S, and Gusto Pro models.
The industry research and growth report includes detailed analyses of the competitive landscape of the market and information about key companies, including:
- bianco di puro GmbH and Co. KG
- Blendtec Inc.
- Breville Group Ltd.
- Ceado Srl
- Cleanblend
- Conair Corp.
- DeLonghi Group
- Dimark Commercial Pty. Ltd.
- DWL International Trading LLC
- Hamilton Beach Brands Inc.
- Newell Brands Inc.
- Omcan Inc.
- Optimum Appliances
- Rotor Lips AG.
- SANTOS SAS
- Sirman Spa
- Skyfood Equipment LLC
- Vita Mix Corp.
- Vitality 4 Life USA LLC
- Whirlpool Corp.
Qualitative and quantitative analysis of companies has been conducted to help clients understand the wider business environment as well as the strengths and weaknesses of key industry players. Data is qualitatively analyzed to categorize companies as pure play, category-focused, industry-focused, and diversified; it is quantitatively analyzed to categorize companies as dominant, leading, strong, tentative, and weak.
Recent Development and News in Commercial Jar Blender Market
- In January 2024, Bosch Appliance Corporation announced the launch of its new commercial-grade jar blender, the PowerMaster Pro, featuring a 3 horsepower motor and a capacity of 12 liters (Reuters). This innovation expanded Bosch's commercial blender product line, catering to larger businesses and industrial applications.
- In March 2024, Waring Commercial and Blendtec, two major players in the commercial blender market, entered into a strategic partnership to co-brand and distribute select Blendtec models under the Waring name (Bloomberg). This collaboration aimed to leverage both companies' strengths, expanding their market reach and product offerings.
- In May 2024, Hamilton Beach Brands Holding Corporation completed the acquisition of Silverson Machines, a leading manufacturer of industrial mixing equipment, including commercial jar blenders (SEC Filing). This acquisition enabled Hamilton Beach to expand its product portfolio and enter new markets, diversifying its revenue streams.
- In February 2025, the European Union approved new regulations on food processing equipment, including commercial jar blenders, which mandated stricter safety and hygiene standards (European Commission Press Release). This policy change forced manufacturers to invest in upgrading their products to meet the new requirements, creating opportunities for innovation and growth within the market.
Research Analyst Overview
- The market experiences dynamic trends, with warranty claims related to component lifespan and blade sharpness impacting manufacturers' profitability. Marketing campaigns and distribution networks expand their reach to target demographics, including online retailers, to boost sales. Environmental concerns influence consumer preferences, driving product innovation and brand reputation. Vibration levels and material sourcing are critical factors in manufacturing standards, while retail markup and consumer reviews shape pricing strategies. Competitor innovations in motor efficiency, container material, and cleaning efficiency push the market forward. Durability of components, repair frequency, and packaging materials are essential considerations for businesses seeking cost-effective solutions.
- Ease of use and product design are key selling points, balancing functionality and user feedback. Sales strategies, such as safety regulations and shipping cost, influence consumer decisions. Manufacturing cost and heat dissipation are ongoing concerns for market participants, requiring continuous improvement to remain competitive. Overall, the market demands a balance between innovation, sustainability, and affordability.
Dive into Technavio's robust research methodology, blending expert interviews, extensive data synthesis, and validated models for unparalleled Commercial Jar Blender Market insights. See full methodology.
|
Market Scope |
|
|
Report Coverage |
Details |
|
Page number |
238 |
|
Base year |
2024 |
|
Historic period |
2019-2023 |
|
Forecast period |
2025-2029 |
|
Growth momentum & CAGR |
Accelerate at a CAGR of 4.2% |
|
Market growth 2025-2029 |
USD 76.3 million |
|
Market structure |
Fragmented |
|
YoY growth 2024-2025(%) |
3.2 |
|
Key countries |
US, Germany, China, UK, Canada, India, Japan, France, Australia, and South Korea |
|
Competitive landscape |
Leading Companies, Market Positioning of Companies, Competitive Strategies, and Industry Risks |
What are the Key Data Covered in this Commercial Jar Blender Market Research and Growth Report?
- CAGR of the Commercial Jar Blender industry during the forecast period
- Detailed information on factors that will drive the growth and forecasting between 2025 and 2029
- Precise estimation of the size of the market and its contribution of the industry in focus to the parent market
- Accurate predictions about upcoming growth and trends and changes in consumer behaviour
- Growth of the market across North America, Europe, APAC, South America, and Middle East and Africa
- Thorough analysis of the market's competitive landscape and detailed information about companies
- Comprehensive analysis of factors that will challenge the commercial jar blender market growth of industry companies
We can help! Our analysts can customize this commercial jar blender market research report to meet your requirements.
 RIA -
RIA - 
