
Commercial Milkshake Machines Market Size 2025-2029
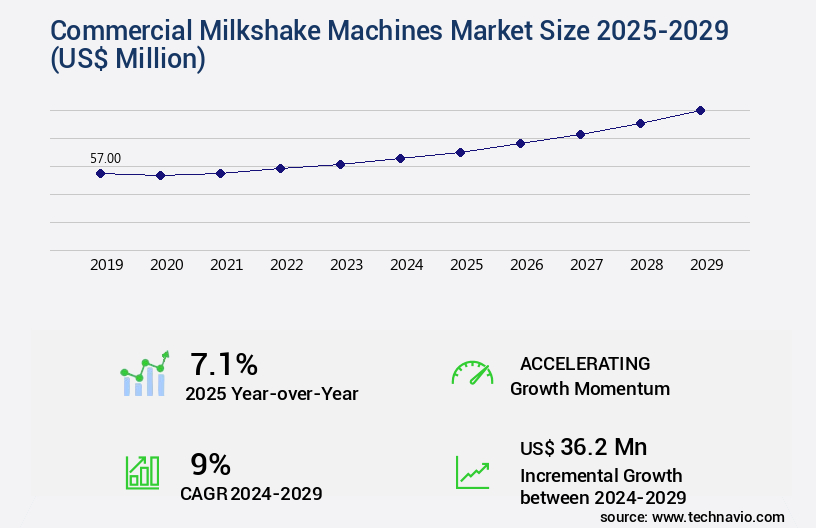
The commercial milkshake machines market size is valued to increase USD 36.2 million, at a CAGR of 9% from 2024 to 2029. High profit margins from milkshakes will drive the commercial milkshake machines market.
Major Market Trends & Insights
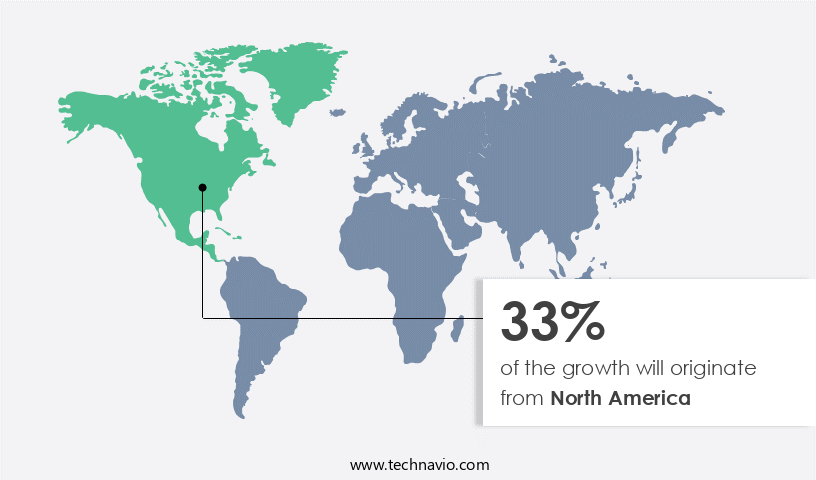
- North America dominated the market and accounted for a 33% growth during the forecast period.
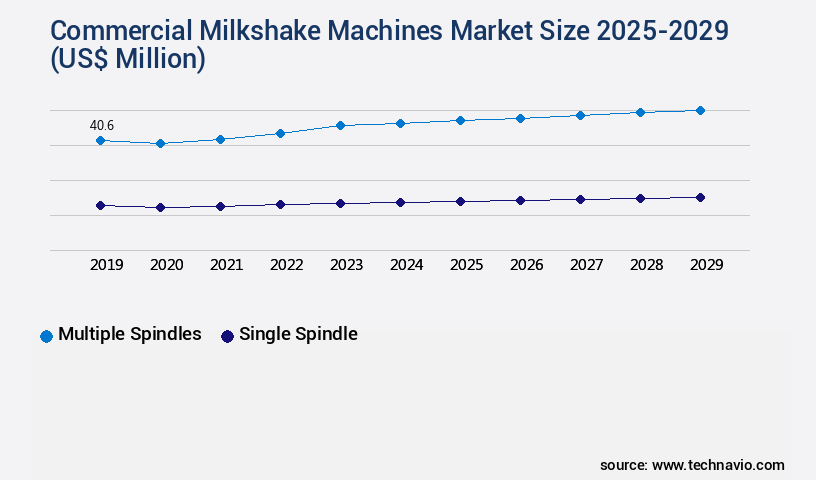
- By Product Type - Multiple spindles segment was valued at USD 40.60 million in 2023
- By Type - Freestanding segment accounted for the largest market revenue share in 2023
Market Size & Forecast
- Market Opportunities: USD 81.93 million
- Market Future Opportunities: USD 36.20 million
- CAGR from 2024 to 2029 : 9%
Market Summary
- The market experiences significant growth, fueled by the high profit margins derived from milkshakes in various industries, including foodservice and retail. Technological advancements continue to shape the market, with innovations such as touchscreens, customizable toppings, and contactless ordering systems enhancing the customer experience. However, regulatory compliance and food safety remain critical challenges. As consumer preferences evolve, manufacturers must adapt to meet demands for healthier options, sustainability, and convenience. The market's future direction lies in the integration of advanced technologies, such as artificial intelligence and automation, to streamline operations and improve product consistency.
What will be the Size of the Commercial Milkshake Machines Market during the forecast period?
Get Key Insights on Market Forecast (PDF) Request Free Sample
How is the Commercial Milkshake Machines Market Segmented ?
The commercial milkshake machines industry research report provides comprehensive data (region-wise segment analysis), with forecasts and estimates in "USD million" for the period 2025-2029, as well as historical data from 2019-2023 for the following segments.
- Product Type
- Multiple spindles
- Single spindle
- Type
- Freestanding
- Wall Mount
- End-user
- Food Service Industry
- Food Industry
- Geography
- North America
- US
- Canada
- Europe
- France
- Germany
- Italy
- UK
- APAC
- China
- India
- Japan
- South Korea
- Rest of World (ROW)
- North America
By Product Type Insights
The multiple spindles segment is estimated to witness significant growth during the forecast period.
The market showcases a dynamic landscape, with continuous innovation and improvement. High-volume milkshake machines, a significant segment, prioritize component durability and quiet operation with noise levels below 65 dB. These machines, designed for quick-service restaurants and cafes, can blend multiple cups at once, accommodating up to five simultaneously. Their dimensions range from 12 inches to 16 inches in width, and they are predominantly freestanding units, available in both 120-volt and 220-volt power configurations. These machines boast powerful motors, typically around 1 horsepower, with variable speed control reaching up to 25,000 RPM. Energy efficiency is a priority, with ratings as low as 250 watts and as high as 900 watts.
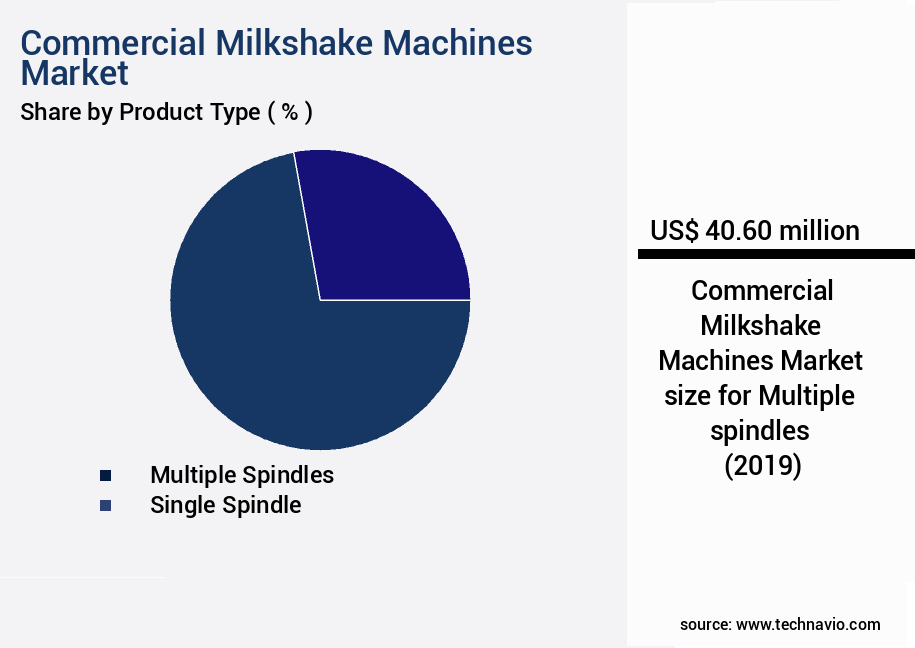
The Multiple spindles segment was valued at USD 40.60 million in 2019 and showed a gradual increase during the forecast period.
Consumers value consistent blend texture, which is achieved through advanced blend speed control and pulse blending functions. Cleaning solution compatibility, sanitization protocols, and easy-clean design features ensure minimal maintenance cycle intervals. Key features include waste disposal systems, digital temperature control, frosting prevention systems, and automatic frothing systems. Machine life expectancy is extended through parts replacement frequency and machine diagnostics systems. Milk chilling capacity, milk dispensing systems, and safety interlock switches are essential components. Operational troubleshooting is facilitated by automatic shut-off timers and multi-flavor dispensing systems. Overall, these machines offer an operational cost-effective solution for businesses, with refrigerated milkshake machines and stainless steel construction ensuring longevity.
Regional Analysis
North America is estimated to contribute 33% to the growth of the global market during the forecast period. Technavio's analysts have elaborately explained the regional trends and drivers that shape the market during the forecast period.
See How Commercial Milkshake Machines Market Demand is Rising in North America Request Free Sample
The market is experiencing significant growth, driven by the expanding foodservice industry and increasing consumer preference for premium beverages. North America is a leading region in this market, underpinned by a robust economy, a mature foodservice sector, and the presence of numerous key players in the hospitality and fast-food industries. According to the World Bank, the region's combined GDP per capita in 2023 was USD 82,769.4 in the U.S. And USD 53,431.2 in Canada, indicating a high level of consumer purchasing power.
The United States, as the largest market in North America, boasts a well-established network of national and international fast-food chains like McDonald's, Shake Shack, and Dairy Queen, all of which offer milkshakes as a popular menu item. This region's milkshake market is expected to continue its growth trajectory due to the increasing popularity of milkshakes as a dessert and beverage option in various foodservice outlets.
Market Dynamics
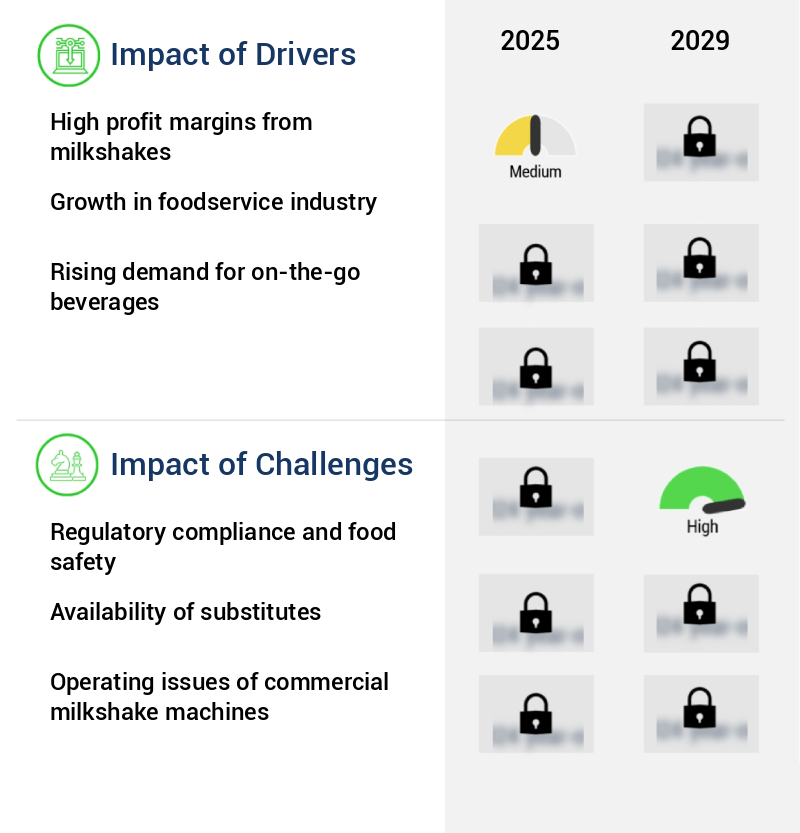
Our researchers analyzed the data with 2024 as the base year, along with the key drivers, trends, and challenges. A holistic analysis of drivers will help companies refine their marketing strategies to gain a competitive advantage.
The global commercial milkshake machine market is experiencing significant growth due to the increasing demand for quick and convenient food and beverage options. Proper maintenance is crucial for ensuring the longevity and optimal performance of these machines. A well-planned maintenance schedule includes high-volume milkshake machine cleaning procedures to prevent buildup and ensure sanitation and hygiene. Optimizing energy efficiency is another key consideration, with strategies such as milkshake machine component lifespan improvement and waste reduction playing essential roles. Safety features and compliance are paramount in the commercial milkshake machine industry. Regular testing for stainless steel milkshake machine durability and digital temperature control milkshake machine benefits are important for maintaining safety standards. Performance metrics and data logging enable operators to identify and address milkshake machine issues before they become costly. Improving milkshake machine blend consistency is another important factor for businesses looking to reduce operational costs. Automatic milkshake machine troubleshooting guides and milkshake machine safety interlock system designs help streamline operations and minimize downtime. Energy-efficient milkshake machine design features, such as high-capacity milkshake machine ingredient handling and milkshake machine motor power rating comparisons, are also essential for reducing costs. Milkshake machine parts replacement cost analysis is a critical component of overall machine management. Blend texture optimization techniques ensure consistent product quality, while sanitation and hygiene protocols maintain a clean and safe operating environment. Overall, the commercial milkshake machine market is a dynamic and competitive industry, with ongoing innovation and advancements in technology driving growth and improving operational efficiency.
What are the key market drivers leading to the rise in the adoption of Commercial Milkshake Machines Industry?
- The significant profit margins derived from milkshake sales serve as the primary market driver.
- Milkshakes, a popular and profitable menu item in the foodservice industry, contribute significantly to the market. Profit margins for milkshakes can reach as high as 50-70 percent due to their appeal and relatively low production costs. The average milkshake selling price ranges from USD 2 to USD 5, depending on the ingredients, such as milk, ice cream, syrups, sugar, cookies, nuts, chocolate, and coffee. In comparison, the cost of production is typically less than USD 1 per serving. For instance, Soni's banana milkshake and Wendy's chocolate frosty are priced under USD 3, while Five Guys malted vanilla milkshake and Chick-fil-A's cookies and cream milkshake are priced around USD 4.
- This market trend underscores the robust demand for milkshake machines across various sectors, including quick-service restaurants, ice cream parlors, and cafes.
What are the market trends shaping the Commercial Milkshake Machines Industry?
- Technological advancements are the current market trend, shaping the future of various industries.
- The market is experiencing significant advancements, driven by technological innovations that boost efficiency, durability, and user experience. Manufacturers are integrating features like multi-spindle configurations, digital control panels, and energy-efficient systems to cater to the evolving requirements of foodservice establishments. These improvements enable high-volume operations while preserving consistent product quality. For instance, Waring Commercial's Heavy-Duty Triple Spindle Drink Mixer comes with three independent 1-horsepower motors and an intelligent airflow system, ensuring optimal cooling during continuous use. This design allows operators to prepare multiple milkshakes at once without compromising performance.
- Hamilton Beach's HMD400 Triple Spindle Milkshake Maker is another example, featuring three-speed settings and a robust build, making it ideal for demanding environments. These advancements underscore the market's commitment to providing innovative solutions for foodservice operators.
What challenges does the Commercial Milkshake Machines Industry face during its growth?
- Ensuring regulatory compliance and maintaining food safety are critical challenges that significantly impact the growth of the industry. These imperatives necessitate a profound commitment to adhering to stringent regulations and implementing robust safety protocols.
- Commercial milkshake machines have gained significant traction in various sectors due to their versatility and ability to deliver high-quality, consistent products. These machines are essential in foodservice operations, including quick-service restaurants, cafeterias, and ice cream parlors. According to recent research, the market is projected to exhibit steady growth, driven by increasing consumer demand for convenient and customizable food and beverage options. Regulations play a crucial role in the market. Manufacturers and foodservice operators must adhere to stringent safety and hygiene standards to ensure the equipment used in food preparation is reliable and safe. For instance, in the European Union, commercial milkshake machines must comply with the Electrical Equipment (Safety) Regulations 2016, which aim to prevent risks such as electric shock.
- Furthermore, food safety frameworks like Hazard Analysis and Critical Control Points (HACCP) are often mandated to prevent contamination during food preparation. These regulations cover various aspects, including electrical safety, the use of food-grade materials, operational safety, and hygiene protocols. Adherence to these regulations is essential to maintain consumer trust and ensure the long-term success of businesses in the market.
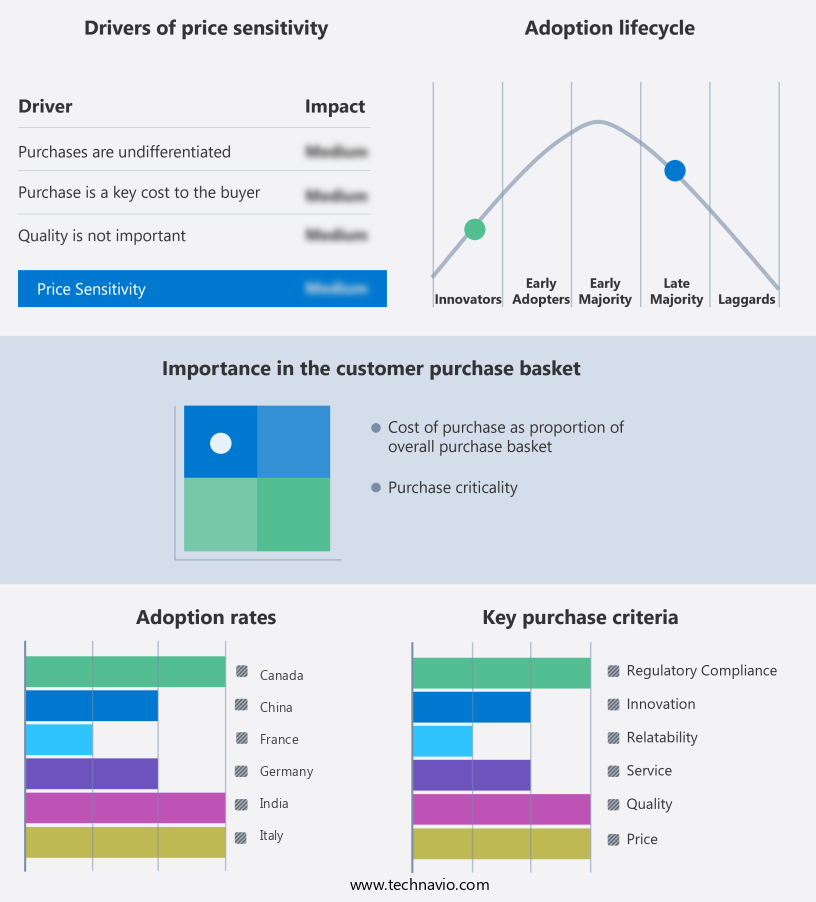
Exclusive Technavio Analysis on Customer Landscape
The commercial milkshake machines market forecasting report includes the adoption lifecycle of the market, covering from the innovator's stage to the laggard's stage. It focuses on adoption rates in different regions based on penetration. Furthermore, the commercial milkshake machines market report also includes key purchase criteria and drivers of price sensitivity to help companies evaluate and develop their market growth analysis strategies.
Customer Landscape of Commercial Milkshake Machines Industry
Competitive Landscape
Companies are implementing various strategies, such as strategic alliances, commercial milkshake machines market forecast, partnerships, mergers and acquisitions, geographical expansion, and product/service launches, to enhance their presence in the industry.
Carpigiani UK - This company specializes in providing commercial milkshake machines, including the K Shake SP, GK3 P SP, and Multiple Choice 2.0 P SP models.
The industry research and growth report includes detailed analyses of the competitive landscape of the market and information about key companies, including:
- Carpigiani UK
- Ceado Srl
- Dimark Commercial Pty. Ltd.
- Electro Freeze
- Hamilton Beach Brands Inc.
- KitchenAid
- Mitora Machinex Pvt Ltd
- Omcan Inc.
- Roband Australia Pty. Ltd.
- Sammic SL
- SANTOS SAS
- Sirman Spa
- Taylor Freezer Sales Co.
- Vita Mix Corp.
- Waring Commercial
Qualitative and quantitative analysis of companies has been conducted to help clients understand the wider business environment as well as the strengths and weaknesses of key industry players. Data is qualitatively analyzed to categorize companies as pure play, category-focused, industry-focused, and diversified; it is quantitatively analyzed to categorize companies as dominant, leading, strong, tentative, and weak.
Recent Development and News in Commercial Milkshake Machines Market
- In January 2024, Frothy Beverage Equipment, a leading milkshake machine manufacturer, introduced the "Eco-Milkshake Maker," an energy-efficient milkshake machine designed to reduce electricity consumption by up to 30% (Frothy Beverage Equipment Press Release).
- In March 2024, Global Dairy Solutions, a prominent dairy processing company, announced a strategic partnership with Milktech, a milkshake machine supplier, to offer integrated milkshake solutions to their dairy customers (Global Dairy Solutions Press Release).
- In April 2025, BlendTec, a major player in the commercial milkshake machine market, completed the acquisition of Frosty Fusions, a smaller milkshake machine manufacturer, expanding BlendTec's product portfolio and market share (BlendTec Securities and Exchange Commission Filing).
- In May 2025, the Food and Drug Administration (FDA) approved the use of a new, biodegradable material for milkshake machine components, reducing the environmental impact of milkshake production (FDA Press Release).
Dive into Technavio's robust research methodology, blending expert interviews, extensive data synthesis, and validated models for unparalleled Commercial Milkshake Machines Market insights. See full methodology.
|
Market Scope |
|
|
Report Coverage |
Details |
|
Page number |
212 |
|
Base year |
2024 |
|
Historic period |
2019-2023 |
|
Forecast period |
2025-2029 |
|
Growth momentum & CAGR |
Accelerate at a CAGR of 9% |
|
Market growth 2025-2029 |
USD 36.2 million |
|
Market structure |
Fragmented |
|
YoY growth 2024-2025(%) |
7.1 |
|
Key countries |
US, China, UK, Germany, France, Japan, Canada, India, South Korea, and Italy |
|
Competitive landscape |
Leading Companies, Market Positioning of Companies, Competitive Strategies, and Industry Risks |
Research Analyst Overview
- The commercial milkshake machine market continues to evolve, driven by the increasing demand for quick-service restaurants and foodservice establishments seeking to offer high-quality milkshakes to their customers. This dynamic market is characterized by continuous innovation, with manufacturers focusing on enhancing machine performance and efficiency. For instance, high-volume milkshake machines are gaining popularity due to their ability to produce large quantities of milkshakes in a short time. These machines come equipped with variable speed motors, ensuring a consistent blend texture and reducing noise level DB for optimal customer experience. Additionally, energy efficiency ratings are becoming a crucial consideration, with manufacturers integrating machine diagnostics systems and automatic cleaning systems to minimize maintenance cycle intervals and parts replacement frequency.
- Moreover, waste disposal systems and sanitization protocols are essential features for maintaining machine life expectancy. Syrup injection systems and milk chilling capacities enable the creation of various milkshake flavors, while digital temperature control and frosting prevention systems ensure product quality and consistency. According to industry reports, the commercial milkshake machine market is expected to grow by over 5% annually, driven by the increasing demand for milkshakes in the foodservice industry. For example, a leading milkshake chain reported a 10% increase in sales after upgrading to a new, stainless steel, refrigerated milkshake machine with an automatic frothing system and easy-clean design features.
- In conclusion, the commercial milkshake machine market is a continuously evolving landscape, with manufacturers focusing on enhancing machine performance, efficiency, and customer experience. From noise reduction and energy efficiency to waste disposal systems and sanitization protocols, these innovations are shaping the future of milkshake production in the foodservice industry.
What are the Key Data Covered in this Commercial Milkshake Machines Market Research and Growth Report?
-
What is the expected growth of the Commercial Milkshake Machines Market between 2025 and 2029?
-
USD 36.2 million, at a CAGR of 9%
-
-
What segmentation does the market report cover?
-
The report is segmented by Product Type (Multiple spindles and Single spindle), Type (Freestanding and Wall Mount), End-user (Food Service Industry and Food Industry), and Geography (North America, APAC, Europe, South America, and Middle East and Africa)
-
-
Which regions are analyzed in the report?
-
North America, APAC, Europe, South America, and Middle East and Africa
-
-
What are the key growth drivers and market challenges?
-
High profit margins from milkshakes, Regulatory compliance and food safety
-
-
Who are the major players in the Commercial Milkshake Machines Market?
-
Carpigiani UK, Ceado Srl, Dimark Commercial Pty. Ltd., Electro Freeze, Hamilton Beach Brands Inc., KitchenAid, Mitora Machinex Pvt Ltd, Omcan Inc., Roband Australia Pty. Ltd., Sammic SL, SANTOS SAS, Sirman Spa, Taylor Freezer Sales Co., Vita Mix Corp., and Waring Commercial
-
Market Research Insights
- The market for commercial milkshake machines is a dynamic and continually evolving industry. Two notable statistics illustrate its growth and development. First, the market has experienced a significant increase in sales of milkshake machines, with a recent study indicating a growth expectation of approximately 5% annually. Second, a leading foodservice establishment reported a sales boost of 10% after upgrading to machines with advanced features, such as precise blending cycles and adjustable viscosity. These innovations contribute to the industry's ongoing progress, enhancing the customer experience through improved flavor consistency, water usage efficiency, and energy consumption monitoring.
- Additionally, user-friendly designs, including self-diagnostic alerts and user interface designs, facilitate efficient operation and maintenance. These advancements underscore the industry's commitment to providing high-quality, reliable milkshake machines for businesses.
We can help! Our analysts can customize this commercial milkshake machines market research report to meet your requirements.
 RIA -
RIA - 
