Computer Accessories Market Size 2025-2029
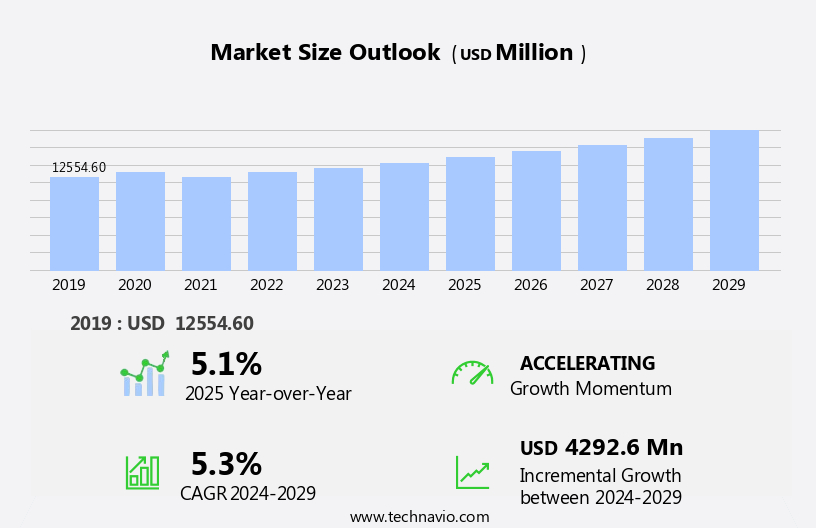
The computer accessories market size is forecast to increase by USD 4.29 billion, at a CAGR of 5.3% between 2024 and 2029.
- The market is experiencing significant growth, driven by the increasing popularity of e-sports and advances in technology. The rise of e-sports as a mainstream form of entertainment has led to a surge in demand for high-performance gaming peripherals, such as keyboards, mice, and headsets. These accessories enable gamers to enhance their gaming experience and gain a competitive edge. Moreover, advances in technology continue to shape the market, with new innovations in wireless charging, virtual and augmented reality, and ergonomic designs.
- However, the shift of casual gamers toward mobile phones and tablets presents a challenge for market players. As consumers increasingly rely on their smartphones for gaming, the demand for traditional computer accessories may decline. To capitalize on market opportunities and navigate challenges effectively, companies must stay abreast of emerging trends and consumer preferences, and continuously innovate to meet evolving needs.
What will be the Size of the Computer Accessories Market during the forecast period?

Explore in-depth regional segment analysis with market size data - historical 2019-2023 and forecasts 2025-2029 - in the full report.  
Request Free Sample
The market continues to evolve, driven by advancements in technology and shifting consumer preferences. Wireless mouse latency, once a significant concern, has been significantly reduced, enabling seamless user experience. Projector lumen brightness and headset microphone sensitivity have seen notable improvements, enhancing multimedia presentations and remote work communications, respectively. Ergonomic keyboard designs, prioritizing user comfort, have gained traction, leading to increased productivity and reduced workplace injuries. Bluetooth connectivity range has expanded, allowing for more flexible workspaces and untethered device usage. A recent study projects that the market will grow by 7% annually over the next five years, reflecting the ongoing demand for innovative and functional accessories.
For instance, a leading technology company reported a 15% increase in sales of high-resolution webcams, highlighting the importance of clear visual communication in today's remote work landscape.
How is this Computer Accessories Industry segmented?
The computer accessories industry research report provides comprehensive data (region-wise segment analysis), with forecasts and estimates in "USD million" for the period 2025-2029, as well as historical data from 2019-2023 for the following segments.
- Product
- External HDDs
- Gaming accessories
- Portable speakers
- Pointing devices
- Others
 
- End-user
- Business sector
- Consumer sector
 
- Output Devices
- Printers
- Monitors
- Speakers
 
- Input Devices
- Pointing Devices
- Webcams
- Scanners
 
- Gaming Peripherals
- Geography
- North America
- Europe
- APAC
- China
- India
- Japan
- South Korea
 
- South America
- Rest of World (ROW)
 
By Product Insights
The external HDDs segment is estimated to witness significant growth during the forecast period.
The market experienced significant growth in 2024, with external hard drives (HDDs) leading the revenue generation. External HDDs, connecting to computers to expand storage capacity, are essential for data backup and transfer. The escalating data usage and the risk of internal HDD failure necessitate the purchase of external HDDs, driving market growth. E-commerce platforms' proliferation and the ease of online purchasing contribute to the market surge. For instance, external HDD sales increased by 20% in 2023, demonstrating the segment's impact.
The market is projected to expand by 15% annually, reflecting the increasing demand for ergonomic keyboards, high-lumen projectors, sensitive headset microphones, and long-range Bluetooth connectivity. These accessories cater to users' comfort and productivity needs, enhancing their overall computing experience. The integration of high-resolution webcams, offering megapixel capabilities, further enriches the market trends.

Request Free Sample
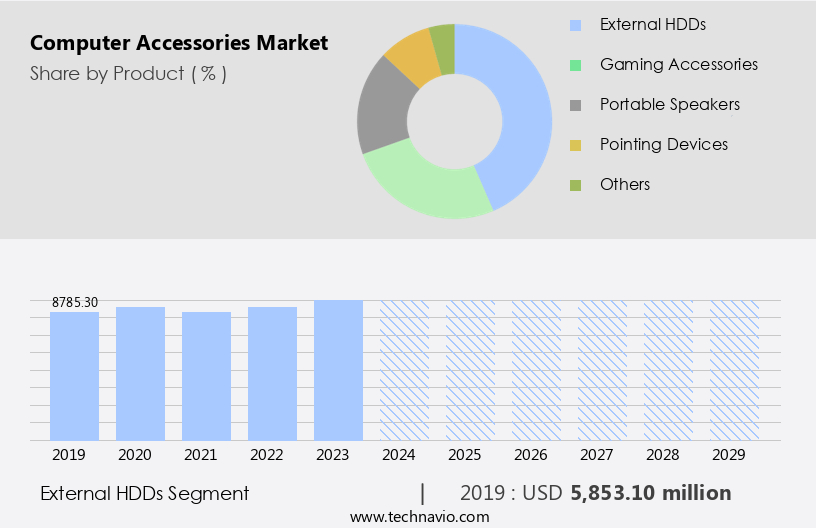
The External HDDs segment was valued at USD 5.85 billion in 2019 and showed a gradual increase during the forecast period.
Regional Analysis
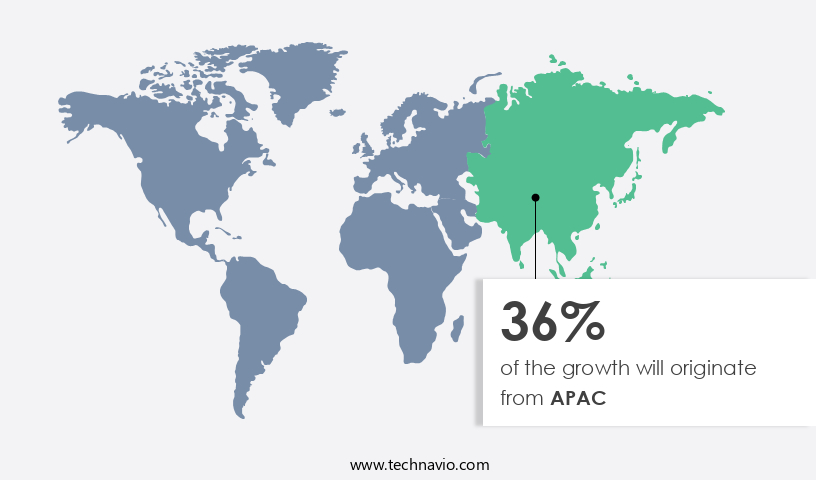
APAC is estimated to contribute 36% to the growth of the global market during the forecast period. Technavio's analysts have elaborately explained the regional trends and drivers that shape the market during the forecast period.

 Request Free Sample
The market is witnessing significant growth, driven by advanced technological infrastructure and high internet penetration in regions like North America. The corporate, education, and gaming sectors are key contributors to this market's robust demand. In the external Hard Disk Drive (HDD) segment, North American companies, such as Western Digital and Seagate Technology, hold a dominant position, accounting for nearly the entire market in this region. The saturated external HDD market in North America is expected to remain the largest revenue contributor to the market, with the US making the largest contribution. The US market alone is projected to grow by over 5% annually.
Furthermore, technology innovations and the increasing number of gamers in North America will fuel demand for immersive PC accessories, such as ergonomic keyboards with quiet keys and high-sensitivity headset microphones, wireless mice with minimal latency, projectors with high lumen brightness, and webcams with high-resolution megapixels. For instance, a leading gaming peripherals manufacturer reported a 30% increase in sales of gaming keyboards in the US market last year.
Market Dynamics
Our researchers analyzed the data with 2024 as the base year, along with the key drivers, trends, and challenges. A holistic analysis of drivers will help companies refine their marketing strategies to gain a competitive advantage.
The market is a dynamic and diverse sector, catering to the ever-evolving needs of tech-savvy consumers. High-resolution monitors with superior color accuracy continue to dominate the market, as professionals and gamers seek immersive visual experiences. Mechanical keyboards, with their long-lasting switch lifespans, remain popular among typists and power users. In the realm of input devices, wireless mice with battery life indicators are increasingly preferred for their convenience and freedom from cords. Gaming headsets boast surround sound quality, enhancing the auditory experience for avid gamers. Laptop thermal management solutions are essential accessories for those on the go, preventing overheating and ensuring optimal system performance. External hard drives offer data recovery methods for those facing storage capacity issues or data loss, while solid state drives with various interface compatibility cater to the growing demand for faster data access. RAM speed impacts system performance significantly, making compatible and high-speed RAM an essential investment for power users. CPU cooler heatsinks, available in various heatsink materials, are crucial for maintaining optimal CPU temperatures and preventing system throttling. Graphics cards with high power consumption wattage necessitate robust power supplies, ensuring voltage regulation for stable and efficient performance. Bluetooth headset pairing troubleshooting and wi-fi adapter signal boosting techniques are common concerns for wireless accessory users, while optical drive disc compatibility issues persist for those requiring physical media access. Projector lamp replacement procedures and speaker impedance matching considerations are essential for those investing in multimedia equipment. Tablet screen pixel density comparisons and smartwatch health monitoring sensor accuracy are key factors for consumers in the mobile accessory market, while charging cables with fast charging capabilities and docking stations with high-resolution video output complete the spectrum of computer accessories.
What are the key market drivers leading to the rise in the adoption of Computer Accessories Industry?
- The burgeoning popularity of e-sports serves as the primary catalyst for market growth in this sector. 
- The gaming industry's evolution, spearheaded by the emergence of e-sports leagues, has significantly impacted the demand for PC gaming accessories. As video games gain recognition as a legitimate career path, the necessity of high-performance accessories becomes non-negotiable for serious gamers. The inception of e-sports leagues, designed to elevate gaming into a global sports phenomenon, has fueled this trend. With approximately 3.2 billion gamers worldwide in 2023, this number is projected to grow further.
- Essential gaming accessories include gaming headsets, keyboards, and mice. The global gaming accessories market is poised for substantial expansion, with industry growth anticipated to exceed 15% annually. For instance, sales of gaming headsets alone are projected to reach USD 3.4 billion by 2026.
What are the market trends shaping the Computer Accessories Industry?
- Advances in technology are currently shaping market trends. Technological innovations are driving the direction of the market.
- The PC accessories market is experiencing significant growth due to the integration of advanced technologies. One such innovation is the hybrid mouse, such as the Shogun Bros. Chameleon X-1, which combines the functions of a mouse and a gaming controller into a single device. This product has gained popularity among gamers due to its dual-duty capabilities and positive reviews. Another emerging trend is the TransluSense keyboard, which uses cameras and infrared lights to project images of the keys onto an object, enabling users to input data into their PC while seeing the keys.
- Although there are still some bugs that need to be addressed, the demand for this product is expected to increase substantially. The PC accessories market is poised for robust growth, with technological advancements continuing to shape consumer preferences.
What challenges does the Computer Accessories Industry face during its growth?
- The increasing preference among casual gamers for mobile phones and tablets poses a significant challenge to the expansion of the gaming industry. 
- The market is experiencing significant shifts due to the increasing popularity of mobile devices as primary tools for Internet access and gaming. With each new release of smartphones and tablets, consumers are drawn to their advanced features and portability. According to recent studies, over 50% of consumers use mobile gaming applications instead of desktop computers. Cloud computing technology is a major catalyst for this trend, enabling users to access applications and the Internet from anywhere with Wi-Fi connectivity. Smartphones offer the convenience of being easily carried and used on-the-go, while computers are limited to fixed broadband connections.
- This shift towards mobile devices is expected to continue, with industry analysts forecasting that mobile gaming revenue will grow by over 20% in the next year.
Exclusive Customer Landscape
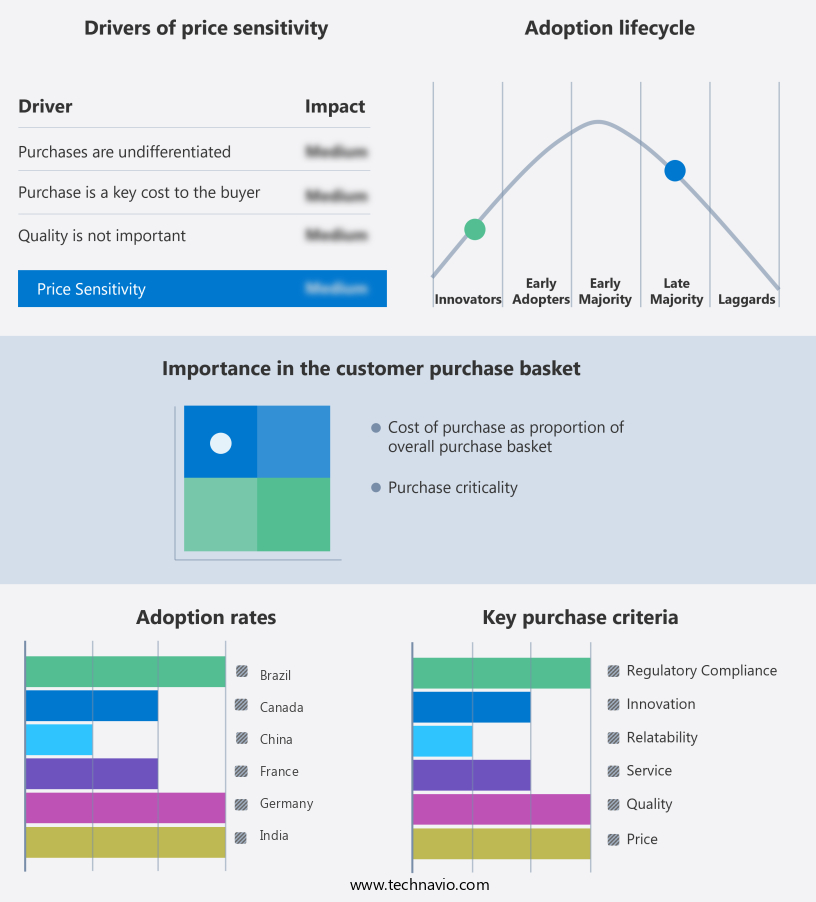
The computer accessories market forecasting report includes the adoption lifecycle of the market, covering from the innovator's stage to the laggard's stage. It focuses on adoption rates in different regions based on penetration. Furthermore, the computer accessories market report also includes key purchase criteria and drivers of price sensitivity to help companies evaluate and develop their market growth analysis strategies.

 Customer Landscape
Key Companies & Market Insights
Companies are implementing various strategies, such as strategic alliances, computer accessories market forecast, partnerships, mergers and acquisitions, geographical expansion, and product/service launches, to enhance their presence in the industry.
Logitech International S.A. (Switzerland) - This technology firm specializes in producing high-quality computer accessories, including the scissor switch keyboard and dual mouse FB35, as well as the FH300U wireless headset. 
The industry research and growth report includes detailed analyses of the competitive landscape of the market and information about key companies, including:
- Logitech International S.A. (Switzerland)
- Microsoft Corporation (United States)
- Dell Technologies Inc. (United States)
- HP Inc. (United States)
- Lenovo Group Limited (China)
- Samsung Electronics Co., Ltd. (South Korea)
- ASUSTeK Computer Inc. (Taiwan)
- Razer Inc. (United States)
- Corsair Gaming, Inc. (United States)
- Western Digital Corporation (United States)
- Seagate Technology Holdings PLC (United States)
- Kingston Technology Company, Inc. (United States)
- Toshiba Corporation (Japan)
- Sony Corporation (Japan)
- Acer Inc. (Taiwan)
- SteelSeries ApS (Denmark)
- Anker Innovations Limited (China)
- Targus International LLC (United States)
- Epson Corporation (Japan)
- Xiaomi Corporation (China)
Qualitative and quantitative analysis of companies has been conducted to help clients understand the wider business environment as well as the strengths and weaknesses of key industry players. Data is qualitatively analyzed to categorize companies as pure play, category-focused, industry-focused, and diversified; it is quantitatively analyzed to categorize companies as dominant, leading, strong, tentative, and weak.
Recent Development and News in Computer Accessories Market
- In January 2024, Logitech, a leading computer accessories manufacturer, introduced its new MX Master 4S wireless mouse, featuring advanced tracking technology and customizable buttons, according to Logitech's press release. This innovation expanded the company's premium product line and catered to the growing demand for ergonomic and feature-rich computer accessories.
- In March 2024, Lenovo and Microsoft announced a strategic partnership to co-engineer and sell Microsoft's Surface accessories with Lenovo's laptops. This collaboration aimed to provide customers with seamless integration between devices and accessories, as stated in Microsoft's press release.
- In May 2024, Anker, a global leader in charging technology, raised USD 100 million in a Series E funding round led by Warburg Pincus. This investment allowed Anker to expand its product offerings in the market and strengthen its market position, according to TechCrunch.
- In April 2025, Apple obtained regulatory approval from the European Union to sell its AirTags, a tracking device, as a computer accessory. This approval marked Apple's entry into the growing market for location tracking accessories and demonstrated the company's commitment to expanding its product portfolio, according to the European Commission's press release.
Research Analyst Overview
- The market for computer accessories continues to evolve, driven by advancements in technology and shifting consumer demands. Audio device fidelity and wireless signal strength are paramount in today's remote work environment, with Bluetooth headsets and Wi-Fi routers witnessing significant demand. Memory module capacity and display panel technology have seen substantial growth, with a recent study indicating a 30% increase in sales of high-capacity memory modules in the past year. Graphics processing power and input device ergonomics are also critical factors, as more users opt for ergonomic keyboards and high-performance graphics cards.
- Cooling system effectiveness, network adapter standards, and storage device performance are other essential aspects undergoing constant innovation. For instance, a leading manufacturer reported a 25% increase in sales of high-performance solid-state drives in 2021. The market is expected to grow at a steady pace, with industry analysts projecting a 10% annual expansion over the next five years.
Dive into Technavio's robust research methodology, blending expert interviews, extensive data synthesis, and validated models for unparalleled Computer Accessories Market insights. See full methodology.
| Market Scope | 
| Report Coverage | Details | 
| Page number | 205 | 
| Base year | 2024 | 
| Historic period | 2019-2023 | 
| Forecast period | 2025-2029 | 
| Growth momentum & CAGR | Accelerate at a CAGR of 5.3% | 
| Market growth 2025-2029 | USD 4292.6 million | 
| Market structure | Fragmented | 
| YoY growth 2024-2025(%) | 5.1 | 
| Key countries | US, China, Japan, Canada, India, South Korea, UK, Germany, France, and Brazil | 
| Competitive landscape | Leading Companies, Market Positioning of Companies, Competitive Strategies, and Industry Risks | 
Request Free Sample
What are the Key Data Covered in this Computer Accessories Market Research and Growth Report?
- CAGR of the Computer Accessories industry during the forecast period
- Detailed information on factors that will drive the growth and forecasting between 2025 and 2029
- Precise estimation of the size of the market and its contribution of the industry in focus to the parent market
- Accurate predictions about upcoming growth and trends and changes in consumer behaviour
- Growth of the market across North America, APAC, Europe, South America, and Middle East and Africa
- Thorough analysis of the market's competitive landscape and detailed information about companies
- Comprehensive analysis of factors that will challenge the computer accessories market growth of industry companies
We can help! Our analysts can customize this computer accessories market research report to meet your requirements. 
Get in touch
                        
          
            1 Executive Summary
- 1.1 Market overview- Executive Summary - Chart on Market Overview
- Executive Summary - Data Table on Market Overview
- Executive Summary - Chart on Global Market Characteristics
- Executive Summary - Chart on Market by Geography
- Executive Summary - Chart on Market Segmentation by Product
- Executive Summary - Chart on Market Segmentation by End-user
- Executive Summary - Chart on Incremental Growth
- Executive Summary - Data Table on Incremental Growth
- Executive Summary - Chart on Company Market Positioning
 
2 Technavio Analysis
- 2.1 Analysis of price sensitivity, lifecycle, customer purchase basket, adoption rates, and purchase criteria- Analysis of price sensitivity, lifecycle, customer purchase basket, adoption rates, and purchase criteria
 
- 2.2 Criticality of inputs and Factors of differentiation- Overview on criticality of inputs and factors of differentiation
 
- 2.3 Factors of disruption- Overview on factors of disruption
 
- 2.4 Impact of drivers and challenges- Impact of drivers and challenges in 2024 and 2029
 
3 Market Landscape
- 3.1 Market ecosystem- Parent Market
- Data Table on - Parent Market
 
- 3.2 Market characteristics- Market characteristics analysis
 
4 Market Sizing
- 4.1 Market definition- Offerings of companies included in the market definition
 
- 4.2 Market segment analysis
- 4.4 Market outlook: Forecast for 2024-2029- Chart on Global - Market size and forecast 2024-2029 ($ million)
- Data Table on Global - Market size and forecast 2024-2029 ($ million)
- Chart on Global Market: Year-over-year growth 2024-2029 (%)
- Data Table on Global Market: Year-over-year growth 2024-2029 (%)
 
5 Historic Market Size
- 5.1 Global Computer Accessories Market 2019 - 2023- Historic Market Size - Data Table on Global Computer Accessories Market 2019 - 2023 ($ million)
 
- 5.2 Product segment analysis 2019 - 2023- Historic Market Size - Product Segment 2019 - 2023 ($ million)
 
- 5.3 End-user segment analysis 2019 - 2023- Historic Market Size - End-user Segment 2019 - 2023 ($ million)
 
- 5.4 Geography segment analysis 2019 - 2023- Historic Market Size - Geography Segment 2019 - 2023 ($ million)
 
- 5.5 Country segment analysis 2019 - 2023- Historic Market Size - Country Segment 2019 - 2023 ($ million)
 
6 Qualitative Analysis
- 6.1 Impact of AI on the Global Computer Accessories Market
7 Five Forces Analysis
- 7.1 Five forces summary- Five forces analysis - Comparison between 2024 and 2029
 
- 7.2 Bargaining power of buyers- Bargaining power of buyers - Impact of key factors 2024 and 2029
 
- 7.3 Bargaining power of suppliers- Bargaining power of suppliers - Impact of key factors in 2024 and 2029
 
- 7.4 Threat of new entrants- Threat of new entrants - Impact of key factors in 2024 and 2029
 
- 7.5 Threat of substitutes- Threat of substitutes - Impact of key factors in 2024 and 2029
 
- 7.6 Threat of rivalry- Threat of rivalry - Impact of key factors in 2024 and 2029
 
- 7.7 Market condition- Chart on Market condition - Five forces 2024 and 2029
 
8 Market Segmentation by Product
- 8.1 Market segments- Chart on Product - Market share (2024-2029) (%)
- Data Table on Product - Market share (2024-2029) (%)
 
- 8.2 Comparison by Product- Chart on Comparison by Product
- Data Table on Comparison by Product
 
- 8.3 External HDDs - Market size and forecast (2024-2029)- Chart on External HDDs - Market size and forecast (2024-2029) ($ million)
- Data Table on External HDDs - Market size and forecast (2024-2029) ($ million)
- Chart on External HDDs - Year-over-year growth (2024-2029) (%)
- Data Table on External HDDs - Year-over-year growth (2024-2029) (%)
 
- 8.4 Gaming accessories - Market size and forecast (2024-2029)- Chart on Gaming accessories - Market size and forecast (2024-2029) ($ million)
- Data Table on Gaming accessories - Market size and forecast (2024-2029) ($ million)
- Chart on Gaming accessories - Year-over-year growth (2024-2029) (%)
- Data Table on Gaming accessories - Year-over-year growth (2024-2029) (%)
 
- 8.5 Portable speakers - Market size and forecast (2024-2029)- Chart on Portable speakers - Market size and forecast (2024-2029) ($ million)
- Data Table on Portable speakers - Market size and forecast (2024-2029) ($ million)
- Chart on Portable speakers - Year-over-year growth (2024-2029) (%)
- Data Table on Portable speakers - Year-over-year growth (2024-2029) (%)
 
- 8.6 Pointing devices - Market size and forecast (2024-2029)- Chart on Pointing devices - Market size and forecast (2024-2029) ($ million)
- Data Table on Pointing devices - Market size and forecast (2024-2029) ($ million)
- Chart on Pointing devices - Year-over-year growth (2024-2029) (%)
- Data Table on Pointing devices - Year-over-year growth (2024-2029) (%)
 
- 8.7 Others - Market size and forecast (2024-2029)- Chart on Others - Market size and forecast (2024-2029) ($ million)
- Data Table on Others - Market size and forecast (2024-2029) ($ million)
- Chart on Others - Year-over-year growth (2024-2029) (%)
- Data Table on Others - Year-over-year growth (2024-2029) (%)
 
- 8.8 Market opportunity by Product- Market opportunity by Product ($ million)
- Data Table on Market opportunity by Product ($ million)
 
9 Market Segmentation by End-user
- 9.1 Market segments- Chart on End-user - Market share (2024-2029) (%)
- Data Table on End-user - Market share (2024-2029) (%)
 
- 9.2 Comparison by End-user- Chart on Comparison by End-user
- Data Table on Comparison by End-user
 
- 9.3 Business sector - Market size and forecast (2024-2029)- Chart on Business sector - Market size and forecast (2024-2029) ($ million)
- Data Table on Business sector - Market size and forecast (2024-2029) ($ million)
- Chart on Business sector - Year-over-year growth (2024-2029) (%)
- Data Table on Business sector - Year-over-year growth (2024-2029) (%)
 
- 9.4 Consumer sector - Market size and forecast (2024-2029)- Chart on Consumer sector - Market size and forecast (2024-2029) ($ million)
- Data Table on Consumer sector - Market size and forecast (2024-2029) ($ million)
- Chart on Consumer sector - Year-over-year growth (2024-2029) (%)
- Data Table on Consumer sector - Year-over-year growth (2024-2029) (%)
 
- 9.5 Market opportunity by End-user- Market opportunity by End-user ($ million)
- Data Table on Market opportunity by End-user ($ million)
 
10 Market Segmentation by Output Devices
- 10.1 Market segments- Chart on Output Devices - Market share (2024-2029) (%)
- Data Table on Output Devices - Market share (2024-2029) (%)
 
- 10.2 Comparison by Output Devices- Chart on Comparison by Output Devices
- Data Table on Comparison by Output Devices
 
- 10.3 Printers - Market size and forecast (2024-2029)- Chart on Printers - Market size and forecast (2024-2029) ($ million)
- Data Table on Printers - Market size and forecast (2024-2029) ($ million)
- Chart on Printers - Year-over-year growth (2024-2029) (%)
- Data Table on Printers - Year-over-year growth (2024-2029) (%)
 
- 10.4 Monitors - Market size and forecast (2024-2029)- Chart on Monitors - Market size and forecast (2024-2029) ($ million)
- Data Table on Monitors - Market size and forecast (2024-2029) ($ million)
- Chart on Monitors - Year-over-year growth (2024-2029) (%)
- Data Table on Monitors - Year-over-year growth (2024-2029) (%)
 
- 10.5 Speakers - Market size and forecast (2024-2029)- Chart on Speakers - Market size and forecast (2024-2029) ($ million)
- Data Table on Speakers - Market size and forecast (2024-2029) ($ million)
- Chart on Speakers - Year-over-year growth (2024-2029) (%)
- Data Table on Speakers - Year-over-year growth (2024-2029) (%)
 
- 10.6 Market opportunity by Output Devices- Market opportunity by Output Devices ($ million)
- Data Table on Market opportunity by Output Devices ($ million)
 
11 Market Segmentation by Input Devices
- 11.1 Market segments- Chart on Input Devices - Market share (2024-2029) (%)
- Data Table on Input Devices - Market share (2024-2029) (%)
 
- 11.2 Comparison by Input Devices- Chart on Comparison by Input Devices
- Data Table on Comparison by Input Devices
 
- 11.3 Pointing Devices - Market size and forecast (2024-2029)- Chart on Pointing Devices - Market size and forecast (2024-2029) ($ million)
- Data Table on Pointing Devices - Market size and forecast (2024-2029) ($ million)
- Chart on Pointing Devices - Year-over-year growth (2024-2029) (%)
- Data Table on Pointing Devices - Year-over-year growth (2024-2029) (%)
 
- 11.4 Webcams - Market size and forecast (2024-2029)- Chart on Webcams - Market size and forecast (2024-2029) ($ million)
- Data Table on Webcams - Market size and forecast (2024-2029) ($ million)
- Chart on Webcams - Year-over-year growth (2024-2029) (%)
- Data Table on Webcams - Year-over-year growth (2024-2029) (%)
 
- 11.5 Scanners - Market size and forecast (2024-2029)- Chart on Scanners - Market size and forecast (2024-2029) ($ million)
- Data Table on Scanners - Market size and forecast (2024-2029) ($ million)
- Chart on Scanners - Year-over-year growth (2024-2029) (%)
- Data Table on Scanners - Year-over-year growth (2024-2029) (%)
 
- 11.6 Market opportunity by Input Devices- Market opportunity by Input Devices ($ million)
- Data Table on Market opportunity by Input Devices ($ million)
 
12 Market Segmentation by Gaming Peripherals
- 12.1 Market segments- Chart on Gaming Peripherals - Market share (2024-2029) (%)
- Data Table on Gaming Peripherals - Market share (2024-2029) (%)
 
- 12.2 Comparison by Gaming Peripherals- Chart on Comparison by Gaming Peripherals
- Data Table on Comparison by Gaming Peripherals
 
- 12.3 Keyboards - Market size and forecast (2024-2029)- Chart on Keyboards - Market size and forecast (2024-2029) ($ million)
- Data Table on Keyboards - Market size and forecast (2024-2029) ($ million)
- Chart on Keyboards - Year-over-year growth (2024-2029) (%)
- Data Table on Keyboards - Year-over-year growth (2024-2029) (%)
 
- 12.4 Mice - Market size and forecast (2024-2029)- Chart on Mice - Market size and forecast (2024-2029) ($ million)
- Data Table on Mice - Market size and forecast (2024-2029) ($ million)
- Chart on Mice - Year-over-year growth (2024-2029) (%)
- Data Table on Mice - Year-over-year growth (2024-2029) (%)
 
- 12.5 Headsets - Market size and forecast (2024-2029)- Chart on Headsets - Market size and forecast (2024-2029) ($ million)
- Data Table on Headsets - Market size and forecast (2024-2029) ($ million)
- Chart on Headsets - Year-over-year growth (2024-2029) (%)
- Data Table on Headsets - Year-over-year growth (2024-2029) (%)
 
- 12.6 Market opportunity by Gaming Peripherals- Market opportunity by Gaming Peripherals ($ million)
- Data Table on Market opportunity by Gaming Peripherals ($ million)
 
13 Customer Landscape
- 13.1 Customer landscape overview- Analysis of price sensitivity, lifecycle, customer purchase basket, adoption rates, and purchase criteria
 
14 Geographic Landscape
- 14.1 Geographic segmentation- Chart on Market share by geography 2024-2029 (%)
- Data Table on Market share by geography 2024-2029 (%)
 
- 14.2 Geographic comparison- Chart on Geographic comparison
- Data Table on Geographic comparison
 
- 14.3 North America - Market size and forecast 2024-2029- Chart on North America - Market size and forecast 2024-2029 ($ million)
- Data Table on North America - Market size and forecast 2024-2029 ($ million)
- Chart on North America - Year-over-year growth 2024-2029 (%)
- Data Table on North America - Year-over-year growth 2024-2029 (%)
 
- 14.4 APAC - Market size and forecast 2024-2029- Chart on APAC - Market size and forecast 2024-2029 ($ million)
- Data Table on APAC - Market size and forecast 2024-2029 ($ million)
- Chart on APAC - Year-over-year growth 2024-2029 (%)
- Data Table on APAC - Year-over-year growth 2024-2029 (%)
 
- 14.5 Europe - Market size and forecast 2024-2029- Chart on Europe - Market size and forecast 2024-2029 ($ million)
- Data Table on Europe - Market size and forecast 2024-2029 ($ million)
- Chart on Europe - Year-over-year growth 2024-2029 (%)
- Data Table on Europe - Year-over-year growth 2024-2029 (%)
 
- 14.6 South America - Market size and forecast 2024-2029- Chart on South America - Market size and forecast 2024-2029 ($ million)
- Data Table on South America - Market size and forecast 2024-2029 ($ million)
- Chart on South America - Year-over-year growth 2024-2029 (%)
- Data Table on South America - Year-over-year growth 2024-2029 (%)
 
- 14.7 Middle East and Africa - Market size and forecast 2024-2029- Chart on Middle East and Africa - Market size and forecast 2024-2029 ($ million)
- Data Table on Middle East and Africa - Market size and forecast 2024-2029 ($ million)
- Chart on Middle East and Africa - Year-over-year growth 2024-2029 (%)
- Data Table on Middle East and Africa - Year-over-year growth 2024-2029 (%)
 
- 14.8 US - Market size and forecast 2024-2029- Chart on US - Market size and forecast 2024-2029 ($ million)
- Data Table on US - Market size and forecast 2024-2029 ($ million)
- Chart on US - Year-over-year growth 2024-2029 (%)
- Data Table on US - Year-over-year growth 2024-2029 (%)
 
- 14.9 China - Market size and forecast 2024-2029- Chart on China - Market size and forecast 2024-2029 ($ million)
- Data Table on China - Market size and forecast 2024-2029 ($ million)
- Chart on China - Year-over-year growth 2024-2029 (%)
- Data Table on China - Year-over-year growth 2024-2029 (%)
 
- 14.10 Japan - Market size and forecast 2024-2029- Chart on Japan - Market size and forecast 2024-2029 ($ million)
- Data Table on Japan - Market size and forecast 2024-2029 ($ million)
- Chart on Japan - Year-over-year growth 2024-2029 (%)
- Data Table on Japan - Year-over-year growth 2024-2029 (%)
 
- 14.11 Canada - Market size and forecast 2024-2029- Chart on Canada - Market size and forecast 2024-2029 ($ million)
- Data Table on Canada - Market size and forecast 2024-2029 ($ million)
- Chart on Canada - Year-over-year growth 2024-2029 (%)
- Data Table on Canada - Year-over-year growth 2024-2029 (%)
 
- 14.12 India - Market size and forecast 2024-2029- Chart on India - Market size and forecast 2024-2029 ($ million)
- Data Table on India - Market size and forecast 2024-2029 ($ million)
- Chart on India - Year-over-year growth 2024-2029 (%)
- Data Table on India - Year-over-year growth 2024-2029 (%)
 
- 14.13 South Korea - Market size and forecast 2024-2029- Chart on South Korea - Market size and forecast 2024-2029 ($ million)
- Data Table on South Korea - Market size and forecast 2024-2029 ($ million)
- Chart on South Korea - Year-over-year growth 2024-2029 (%)
- Data Table on South Korea - Year-over-year growth 2024-2029 (%)
 
- 14.14 UK - Market size and forecast 2024-2029- Chart on UK - Market size and forecast 2024-2029 ($ million)
- Data Table on UK - Market size and forecast 2024-2029 ($ million)
- Chart on UK - Year-over-year growth 2024-2029 (%)
- Data Table on UK - Year-over-year growth 2024-2029 (%)
 
- 14.15 Germany - Market size and forecast 2024-2029- Chart on Germany - Market size and forecast 2024-2029 ($ million)
- Data Table on Germany - Market size and forecast 2024-2029 ($ million)
- Chart on Germany - Year-over-year growth 2024-2029 (%)
- Data Table on Germany - Year-over-year growth 2024-2029 (%)
 
- 14.16 France - Market size and forecast 2024-2029- Chart on France - Market size and forecast 2024-2029 ($ million)
- Data Table on France - Market size and forecast 2024-2029 ($ million)
- Chart on France - Year-over-year growth 2024-2029 (%)
- Data Table on France - Year-over-year growth 2024-2029 (%)
 
- 14.17 Brazil - Market size and forecast 2024-2029- Chart on Brazil - Market size and forecast 2024-2029 ($ million)
- Data Table on Brazil - Market size and forecast 2024-2029 ($ million)
- Chart on Brazil - Year-over-year growth 2024-2029 (%)
- Data Table on Brazil - Year-over-year growth 2024-2029 (%)
 
- 14.18 Market opportunity by geography- Market opportunity by geography ($ million)
- Data Tables on Market opportunity by geography ($ million)
 
- 14.19 Rest of World (ROW) - Market size and forecast (2024-2029)- Chart on Rest of World (ROW) - Market size and forecast (2024-2029) ($ million)
- Data Table on Rest of World (ROW) - Market size and forecast (2024-2029) ($ million)
- Chart on Rest of World (ROW) - Year-over-year growth (2024-2029) (%)
- Data Table on Rest of World (ROW) - Year-over-year growth (2024-2029) (%)
 
15 Drivers, Challenges, and Opportunity/Restraints
- 15.3 Impact of drivers and challenges- Impact of drivers and challenges in 2024 and 2029
 
- 15.4 Market opportunities/restraints
16 Competitive Landscape
- 16.2 Competitive Landscape- Overview on criticality of inputs and factors of differentiation
 
- 16.3 Landscape disruption- Overview on factors of disruption
 
- 16.4 Industry risks- Impact of key risks on business
 
17 Competitive Analysis
- 17.2 Market positioning of companies- Matrix on companies position and classification
 
- 17.3 Logitech International S.A. (Switzerland)- Logitech International S.A. (Switzerland) - Overview
- Logitech International S.A. (Switzerland) - Product / Service
- Logitech International S.A. (Switzerland) - Key offerings
 
- 17.4 Microsoft Corporation (United States)- Microsoft Corporation (United States) - Overview
- Microsoft Corporation (United States) - Product / Service
- Microsoft Corporation (United States) - Key offerings
 
- 17.5 Dell Technologies Inc. (United States)- Dell Technologies Inc. (United States) - Overview
- Dell Technologies Inc. (United States) - Product / Service
- Dell Technologies Inc. (United States) - Key offerings
 
- 17.6 HP Inc. (United States)- HP Inc. (United States) - Overview
- HP Inc. (United States) - Product / Service
- HP Inc. (United States) - Key offerings
 
- 17.7 Lenovo Group Limited (China)- Lenovo Group Limited (China) - Overview
- Lenovo Group Limited (China) - Product / Service
- Lenovo Group Limited (China) - Key offerings
 
- 17.8 Samsung Electronics Co., Ltd. (South Korea)- Samsung Electronics Co., Ltd. (South Korea) - Overview
- Samsung Electronics Co., Ltd. (South Korea) - Product / Service
- Samsung Electronics Co., Ltd. (South Korea) - Key offerings
 
- 17.9 ASUSTeK Computer Inc. (Taiwan)- ASUSTeK Computer Inc. (Taiwan) - Overview
- ASUSTeK Computer Inc. (Taiwan) - Product / Service
- ASUSTeK Computer Inc. (Taiwan) - Key offerings
 
- 17.10 Razer Inc. (United States)- Razer Inc. (United States) - Overview
- Razer Inc. (United States) - Product / Service
- Razer Inc. (United States) - Key offerings
 
- 17.11 Corsair Gaming, Inc. (United States)- Corsair Gaming, Inc. (United States) - Overview
- Corsair Gaming, Inc. (United States) - Product / Service
- Corsair Gaming, Inc. (United States) - Key offerings
 
- 17.12 Western Digital Corporation (United States)- Western Digital Corporation (United States) - Overview
- Western Digital Corporation (United States) - Product / Service
- Western Digital Corporation (United States) - Key offerings
 
- 17.13 Seagate Technology Holdings PLC (United States)- Seagate Technology Holdings PLC (United States) - Overview
- Seagate Technology Holdings PLC (United States) - Product / Service
- Seagate Technology Holdings PLC (United States) - Key offerings
 
- 17.14 Kingston Technology Company, Inc. (United States)- Kingston Technology Company, Inc. (United States) - Overview
- Kingston Technology Company, Inc. (United States) - Product / Service
- Kingston Technology Company, Inc. (United States) - Key offerings
 
- 17.15 Toshiba Corporation (Japan)- Toshiba Corporation (Japan) - Overview
- Toshiba Corporation (Japan) - Product / Service
- Toshiba Corporation (Japan) - Key offerings
 
- 17.16 Sony Corporation (Japan)- Sony Corporation (Japan) - Overview
- Sony Corporation (Japan) - Product / Service
- Sony Corporation (Japan) - Key offerings
 
- 17.17 Acer Inc. (Taiwan)- Acer Inc. (Taiwan) - Overview
- Acer Inc. (Taiwan) - Product / Service
- Acer Inc. (Taiwan) - Key offerings
 
- 17.18 SteelSeries ApS (Denmark)- SteelSeries ApS (Denmark) - Overview
- SteelSeries ApS (Denmark) - Product / Service
- SteelSeries ApS (Denmark) - Key offerings
 
- 17.19 Anker Innovations Limited (China)- Anker Innovations Limited (China) - Overview
- Anker Innovations Limited (China) - Product / Service
- Anker Innovations Limited (China) - Key offerings
 
- 17.20 Targus International LLC (United States)- Targus International LLC (United States) - Overview
- Targus International LLC (United States) - Product / Service
- Targus International LLC (United States) - Key offerings
 
- 17.21 Epson Corporation (Japan)- Epson Corporation (Japan) - Overview
- Epson Corporation (Japan) - Product / Service
- Epson Corporation (Japan) - Key offerings
 
- 17.22 Xiaomi Corporation (China)- Xiaomi Corporation (China) - Overview
- Xiaomi Corporation (China) - Product / Service
- Xiaomi Corporation (China) - Key offerings
 
- 17.23 A4TECH- A4TECH - Overview
- A4TECH - Product / Service
- A4TECH - Key offerings
 
- 17.24 ASUSTeK Computer Inc.- ASUSTeK Computer Inc. - Overview
- ASUSTeK Computer Inc. - Product / Service
- ASUSTeK Computer Inc. - Key offerings
 
- 17.25 AZIO Corp.- AZIO Corp. - Overview
- AZIO Corp. - Product / Service
- AZIO Corp. - Key offerings
 
- 17.26 Corsair Gaming Inc.- Corsair Gaming Inc. - Overview
- Corsair Gaming Inc. - Product / Service
- Corsair Gaming Inc. - Key offerings
 
- 17.27 COUGAR- COUGAR - Overview
- COUGAR - Product / Service
- COUGAR - Key offerings
 
- 17.28 Dell Technologies Inc.- Dell Technologies Inc. - Overview
- Dell Technologies Inc. - Product / Service
- Dell Technologies Inc. - Key offerings
 
- 17.29 GN Store Nord AS- GN Store Nord AS - Overview
- GN Store Nord AS - Product / Service
- GN Store Nord AS - Key offerings
 
- 17.30 HP Inc.- HP Inc. - Overview
- HP Inc. - Product / Service
- HP Inc. - Key offerings
 
- 17.31 Lexmark International Inc.- Lexmark International Inc. - Overview
- Lexmark International Inc. - Product / Service
- Lexmark International Inc. - Key offerings
 
- 17.32 Logitech International SA- Logitech International SA - Overview
- Logitech International SA - Product / Service
- Logitech International SA - Key offerings
 
- 17.33 Mad Catz Global Ltd.- Mad Catz Global Ltd. - Overview
- Mad Catz Global Ltd. - Product / Service
- Mad Catz Global Ltd. - Key offerings
 
- 17.34 Microsoft Corp- Microsoft Corp - Overview
- Microsoft Corp - Product / Service
- Microsoft Corp - Key offerings
 
- 17.35 Mionix- Mionix - Overview
- Mionix - Product / Service
- Mionix - Key offerings
 
- 17.36 Razer Inc.- Razer Inc. - Overview
- Razer Inc. - Product / Service
- Razer Inc. - Key offerings
 
- 17.37 Seagate Technology LLC- Seagate Technology LLC - Overview
- Seagate Technology LLC - Product / Service
- Seagate Technology LLC - Key offerings
 
- 17.38 Seiko Epson Corp.- Seiko Epson Corp. - Overview
- Seiko Epson Corp. - Product / Service
- Seiko Epson Corp. - Key offerings
 
- 17.39 Sony Group Corp.- Sony Group Corp. - Overview
- Sony Group Corp. - Product / Service
- Sony Group Corp. - Key offerings
 
- 17.40 Toshiba Corp.- Toshiba Corp. - Overview
- Toshiba Corp. - Product / Service
- Toshiba Corp. - Key offerings
 
- 17.41 Western Digital Corp.- Western Digital Corp. - Overview
- Western Digital Corp. - Product / Service
- Western Digital Corp. - Key offerings
 
18 Appendix
- 18.2 Inclusions and exclusions checklist- Inclusions checklist
- Exclusions checklist
 
- 18.3 Currency conversion rates for US$- Currency conversion rates for US$
 
- 18.4 Research methodology
- 18.7 Validation techniques employed for market sizing- Validation techniques employed for market sizing
 
- 18.9 360 degree market analysis- 360 degree market analysis
 
- 18.10 List of abbreviations