Gaming Peripheral Market Size 2025-2029
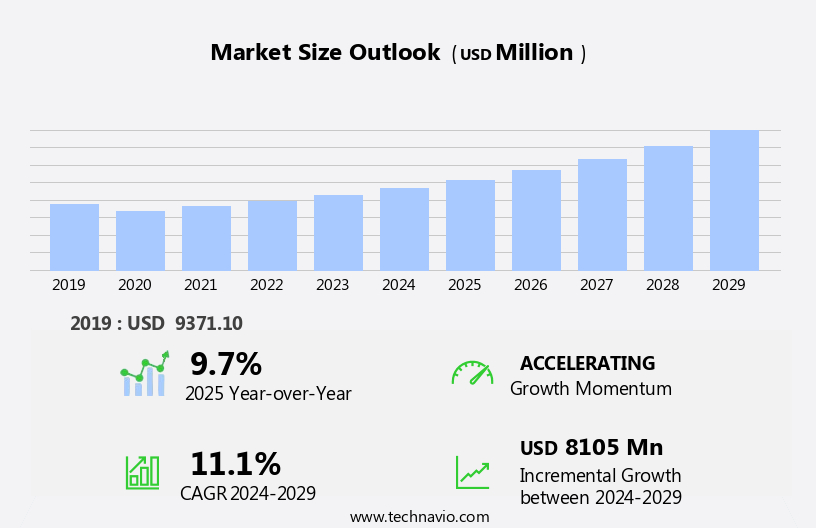
The gaming peripheral market size is forecast to increase by USD 8.11 billion at a CAGR of 11.1% between 2024 and 2029.
- The market is experiencing significant growth, driven by the increasing popularity of e-sports and multiplayer video games. With the rise of professional gaming tournaments and leagues, there is a heightened demand for advanced gaming peripherals that offer superior performance and functionality. However, market expansion is not without challenges. Regulatory hurdles impact adoption in certain regions, as stringent regulations on gaming peripherals can limit sales and market entry. Furthermore, the easy availability of counterfeit products poses a significant threat to market players, as they can undercut prices and compromise product quality.
- To capitalize on market opportunities and navigate challenges effectively, companies must focus on innovation, regulatory compliance, and supply chain transparency. By addressing these issues, they can differentiate themselves in the competitive landscape and maintain a strong market position.
What will be the Size of the Gaming Peripheral Market during the forecast period?
- The gaming industry continues to evolve, with companies introducing innovative peripherals to enhance the player experience. Gaming mice, equipped with 2.4GHz wireless technology and Bluetooth connectivity, offer surround sound and performance optimization. Mechanical keyboards, featuring clicky switches and customizable lighting profiles, cater to both professional gamers and content creators. Gaming tournaments and game publishers seek advanced peripherals, such as programmable buttons and macro recording capabilities, to stay competitive. Augmented reality and virtual reality headsets, incorporating machine learning algorithms, provide immersive audio and noise cancellation.
- Gaming chairs, with adjustable armrests, lumbar support, and noise-reducing microphones, offer comfort and sound isolation for extended gaming sessions. The industry's focus on player experience and game design drives the adoption of advanced technologies like optical and laser sensors, tactile switches, and adjustable microphones, ensuring a more engaging and interactive gaming setup.
How is this Gaming Peripheral Industry segmented?
The gaming peripheral industry research report provides comprehensive data (region-wise segment analysis), with forecasts and estimates in "USD million" for the period 2025-2029, as well as historical data from 2019-2023 for the following segments.
- Type
- Controllers
- Headsets
- Keyboards
- Gaming mice
- Others
- Technology
- Wired
- Wireless
- Device
- PC gaming peripherals
- Gaming console peripherals
- Distribution Channel
- Online retail
- Offline retail
- Geography
- North America
- US
- Canada
- Europe
- France
- Germany
- Italy
- UK
- APAC
- China
- India
- Japan
- South Korea
- Rest of World (ROW)
- North America
By Type Insights
The controllers segment is estimated to witness significant growth during the forecast period. The market has witnessed significant advancements since the rudimentary video game controllers of the 1970s, such as Magnavox Odyssey 100, which featured only sliders for control. Modern gaming peripherals cater to diverse gaming experiences, including cloud gaming, casual and competitive gaming, PC and console gaming, virtual reality, and mobile gaming. Peripherals encompass haptic feedback, polling rates, DPI settings, programmable buttons, and RGB lighting. Peripheral accessories, like gaming desks, chairs, and headsets, enhance the overall gaming experience. Gaming communities and influencers play a crucial role in driving trends, with professional gamers and content creators leveraging high-quality gaming mice, keyboards, and headsets for optimal performance.
Game publishers invest in developing immersive gaming software, integrating machine learning, augmented reality, and artificial intelligence. Multiplayer gaming, gaming tournaments, and in-game purchases fuel the market's growth. Subscription services and driver updates ensure seamless user experiences. Gaming media and events further popularize gaming culture. Cloud computing and online gaming have transformed the industry, enabling access to games from anywhere, anytime. Virtual reality and augmented reality headsets offer immersive gaming experiences. Gaming laptops and desktops cater to hardcore gamers seeking high-performance systems. Steering wheels and gaming software cater to niche markets, like racing games. The market's evolution reflects the harmonious integration of technology and gaming, providing users with increasingly engaging and interactive experiences.
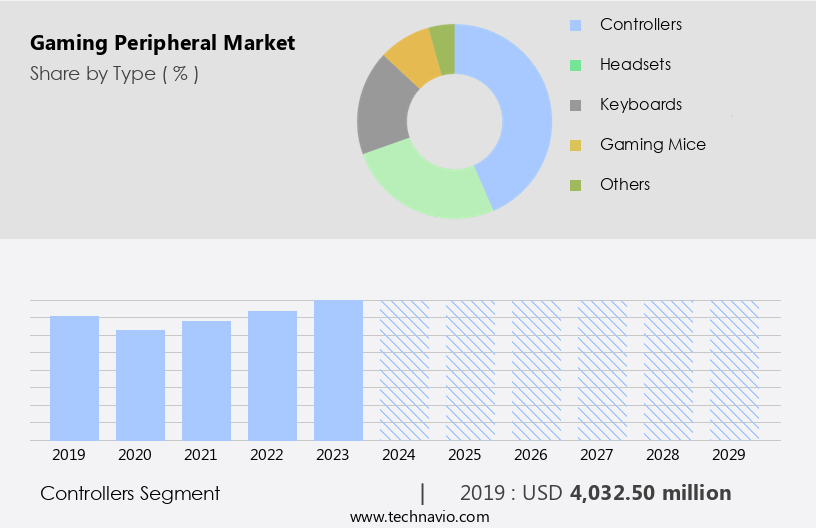
The Controllers segment was valued at USD 4.03 billion in 2019 and showed a gradual increase during the forecast period.
Regional Analysis
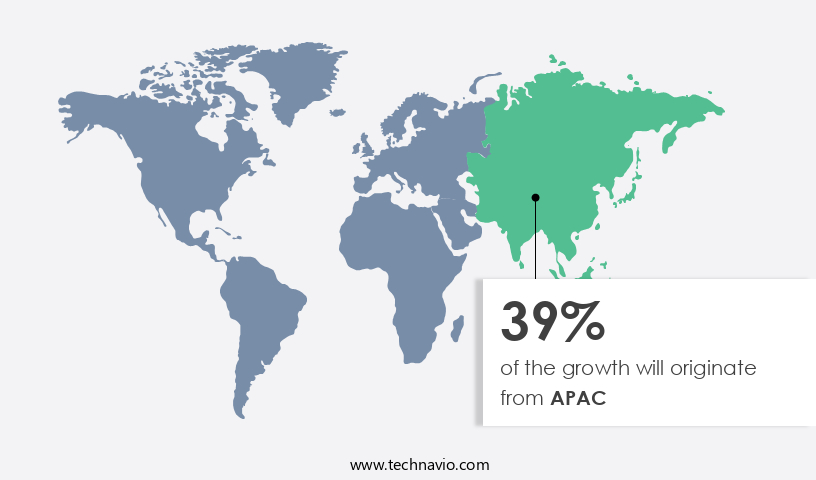
APAC is estimated to contribute 39% to the growth of the global market during the forecast period. Technavio's analysts have elaborately explained the regional trends and drivers that shape the market during the forecast period.
The market in the US is experiencing significant growth due to the increasing popularity of gaming and the rise of professional gaming as a career. With over 60% of US households having at least one frequent gamer, the demand for advanced gaming equipment is on the rise. Gamers in the US spend over USD 10 billion annually on gaming content, and online gamers average more than six hours of weekly playtime. The adoption of cloud gaming, virtual reality, and augmented reality technologies is also driving market expansion. Peripheral accessories, such as gaming mice, mechanical keyboards, and gaming headsets, are in high demand for both casual and hardcore gamers.
Gaming desks, chairs, and laptops are essential for creating an immersive gaming experience. Professional gamers and gaming influencers rely on high-quality gaming monitors, programmable buttons, and DPI settings for optimal performance. Game publishers and content creators are investing in machine learning and artificial intelligence to enhance the gaming experience. Multiplayer gaming, gaming tournaments, and subscription services are also contributing to the market's growth. The integration of haptic feedback, audio quality, and RGB lighting adds to the overall gaming experience. The adoption of cloud computing and driver updates ensures that gaming software remains up-to-date. The gaming industry's rapid expansion in North America is further fueling the growth of the market, with gaming media and events providing a platform for showcasing new technologies and innovations.
Market Dynamics
Our researchers analyzed the data with 2024 as the base year, along with the key drivers, trends, and challenges. A holistic analysis of drivers will help companies refine their marketing strategies to gain a competitive advantage.
What are the Gaming Peripheral market drivers leading to the rise in the adoption of Industry?
- The surge in the popularity of e-sports serves as the primary catalyst for market growth in this sector. The market is experiencing significant growth due to the increasing popularity of e-sports, which has become a major form of entertainment worldwide. E-sports events attract millions of viewers, creating a demand for high-quality gaming accessories to enhance the gaming experience. Hardcore gamers seek superior audio quality from gaming headsets, customizable DPI settings for gaming mice, and RGB lighting for gaming keyboards and desks.
- Loot boxes, a popular feature in single-player gaming, also contribute to the market's expansion. Gaming influencers play a crucial role in promoting these accessories and driving sales. As the gaming community continues to expand, the demand for advanced gaming peripherals is expected to rise, making this an exciting and profitable market for businesses.
What are the Gaming Peripheral market trends shaping the Industry?
- The increasing prevalence of multiplayer video games represents a significant market trend. This growing preference for collaborative gaming experiences underscores the evolving dynamics of the digital entertainment industry. The market caters to the needs of professional gamers, content creators, and game publishers, providing specialized equipment to enhance their gaming experience. Gaming mice, mechanical keyboards, and programmable buttons are popular peripherals, offering customization and improved functionality. Multiplayer gaming tournaments have fueled the demand for advanced peripherals, as players seek a competitive edge. Machine learning and augmented reality technologies are emerging trends, integrating intelligence and immersion into gaming experiences. VR headsets and macro programming further expand the possibilities, allowing for more complex and interactive gaming environments.
- Gaming chairs, designed for extended gaming sessions, ensure comfort and support for dedicated gamers. The market dynamics are driven by the growing popularity of multiplayer games, which facilitate interaction and collaboration among players, and the continuous advancements in gaming technology.
How does Gaming Peripheral market faces challenges face during its growth?
- The proliferation of counterfeit products poses a significant challenge to industry growth, as their easy accessibility undermines consumer trust and market integrity. The gaming industry faces challenges from piracy, particularly in relation to in-game purchases, subscription services, and gaming software. Pirated software and hardware peripherals, such as steering wheels and microphones, can provide unauthorized users with an unfair advantage in multiplayer gaming. These counterfeit products not only hinder the revenue growth of gaming companies but also impede innovation in game development. To mitigate this issue, companies employ various measures, including driver updates and licensing agreements, to prevent unauthorized use of their products.
- Furthermore, advancements in artificial intelligence and gaming media are expected to enhance the gaming experience and deter piracy. Mobile gaming and multiplayer gaming continue to gain popularity, presenting new opportunities for market expansion. Despite these challenges, the gaming industry remains dynamic and innovative, driven by the constant evolution of gaming technology and consumer demand.
Exclusive Customer Landscape
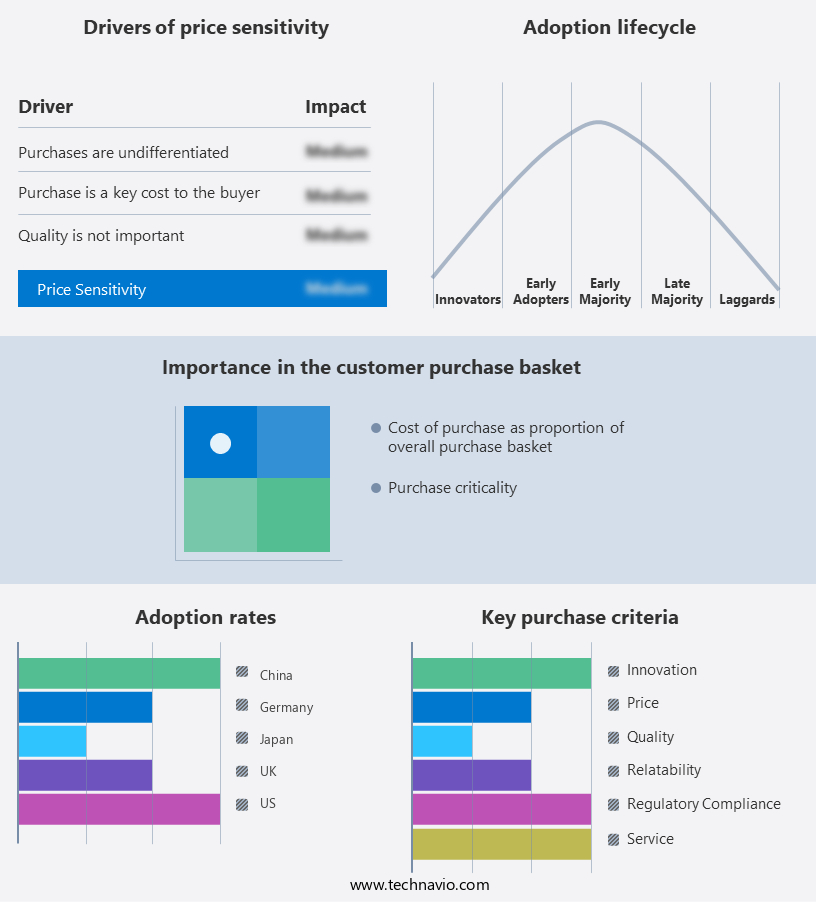
The gaming peripheral market forecasting report includes the adoption lifecycle of the market, covering from the innovator's stage to the laggard's stage. It focuses on adoption rates in different regions based on penetration. Furthermore, the gaming peripheral market report also includes key purchase criteria and drivers of price sensitivity to help companies evaluate and develop their market growth analysis strategies.
Customer Landscape
Key Companies & Market Insights
Companies are implementing various strategies, such as strategic alliances, gaming peripheral market forecast, partnerships, mergers and acquisitions, geographical expansion, and product/service launches, to enhance their presence in the industry.
Corsair Gaming Inc. - The company offers gaming peripherals such as monitors, gaming laptops, CPU coolers, and storage.
The industry research and growth report includes detailed analyses of the competitive landscape of the market and information about key companies, including:
- Corsair Gaming Inc.
- COUGAR
- Creative Technology Ltd.
- DuckyChannel International Co. Ltd.
- GoodBetterBest Ltd.
- Kingston Technology Co. Inc.
- Logitech International SA
- Mad Catz Global Ltd.
- Microsoft Corp.
- Plantronics Inc.
- Razer Inc.
- Sennheiser Electronic GmbH and Co. KG
- Sentey Inc.
- Sharkoon Technologies GmbH
- Shure Inc.
- Skullcandy Inc.
- Sony Group Corp.
- SteelSeries ApS
- Thermaltake Technology Co. Ltd.
- TURTLE BEACH CORP.
Qualitative and quantitative analysis of companies has been conducted to help clients understand the wider business environment as well as the strengths and weaknesses of key industry players. Data is qualitatively analyzed to categorize companies as pure play, category-focused, industry-focused, and diversified; it is quantitatively analyzed to categorize companies as dominant, leading, strong, tentative, and weak.
Recent Development and News in Gaming Peripheral Market
- In February 2024, Logitech G, a leading player in the market, introduced its new wireless gaming headset, the Logitech G Pro X Wireless, featuring Lightspeed wireless technology and Blue VO!CE microphone technology (Logitech Press Release, 2024). This launch marked a significant advancement in wireless gaming headset technology, offering gamers high-quality audio and microphone performance without the limitations of wires.
- In June 2025, Razer, another major gaming peripheral manufacturer, announced a strategic partnership with Microsoft to develop gaming peripherals optimized for the Xbox Cloud Gaming platform (Razer Press Release, 2025). This collaboration aimed to provide Xbox Cloud Gaming subscribers with a seamless and enhanced gaming experience by integrating Razer's peripherals with the platform.
- In October 2024, Corsair secured a strategic investment of USD150 million from Koch Industries' subsidiary, Invicton Capital (Corsair Press Release, 2024). This investment enabled Corsair to expand its product offerings, strengthen its market position, and accelerate its growth in the market.
- In January 2025, SteelSeries, a Danish gaming peripherals manufacturer, announced its entry into the Indian market by opening a new office in New Delhi and launching its products through local retailers and e-commerce platforms (SteelSeries Press Release, 2025). This expansion marked SteelSeries' first foray into the Indian market, providing gamers in the region with access to its high-quality gaming peripherals.
Research Analyst Overview
The market continues to evolve, driven by advancements in technology and the diverse needs of gamers. Gaming monitors, a crucial component for an immersive gaming experience, are witnessing significant developments in terms of resolution, refresh rates, and response times. Cloud gaming, a relatively new trend, is gaining traction among casual gamers, enabling them to access high-performance games without the need for expensive hardware. PC gaming and console gaming each cater to distinct segments of the market. Hardcore gamers, who demand the highest performance and customization, prefer PC gaming, while console gaming caters to a broader audience, offering a more user-friendly experience.
Virtual reality and augmented reality technologies are revolutionizing gaming, providing a more immersive and interactive experience. Haptic feedback, a technology that simulates tactile sensations, is gaining popularity in gaming peripherals, enhancing the overall gaming experience. Cloud computing and online gaming are driving the demand for peripherals with low latency and high polling rates. Peripheral accessories, such as gaming mice, gaming keyboards, and gaming headsets, are essential for enhancing the overall gaming experience. Single-player gaming and multiplayer gaming cater to different gaming styles. In-game purchases, subscription services, and driver updates are becoming increasingly common in the gaming industry, providing gamers with additional content and features.
Gaming software, gaming media, and gaming events are essential components of the gaming ecosystem, offering gamers the latest news, reviews, and insights. Competitive gaming and professional gaming are driving the demand for high-performance peripherals. Gaming influencers and content creators are shaping consumer preferences and trends, while game publishers and developers are continually pushing the boundaries of what's possible in gaming. Programmable buttons, macro programming, and machine learning are some of the advanced features that are becoming increasingly common in gaming peripherals. Gaming chairs, gaming desks, and gaming laptops are essential for creating an optimal gaming setup.
Audio quality and microphone quality are crucial for communication and immersion in online gaming. Steering wheels and gaming tournaments cater to racing game enthusiasts, while RGB lighting adds a touch of style and personalization to gaming setups. The market is a dynamic and ever-evolving landscape, driven by technological advancements and the diverse needs of gamers. From gaming monitors and peripherals to cloud gaming and virtual reality, the market offers a wide range of products and services, catering to every type of gamer.
Dive into Technavio's robust research methodology, blending expert interviews, extensive data synthesis, and validated models for unparalleled Gaming Peripheral Market insights. See full methodology.
|
Market Scope |
|
|
Report Coverage |
Details |
|
Page number |
230 |
|
Base year |
2024 |
|
Historic period |
2019-2023 |
|
Forecast period |
2025-2029 |
|
Growth momentum & CAGR |
Accelerate at a CAGR of 11.1% |
|
Market growth 2025-2029 |
USD 8.10 billion |
|
Market structure |
Fragmented |
|
YoY growth 2024-2025(%) |
9.7 |
|
Key countries |
US, China, Canada, Japan, Germany, UK, France, India, Italy, and South Korea |
|
Competitive landscape |
Leading Companies, Market Positioning of Companies, Competitive Strategies, and Industry Risks |
What are the Key Data Covered in this Gaming Peripheral Market Research and Growth Report?
- CAGR of the Gaming Peripheral industry during the forecast period
- Detailed information on factors that will drive the growth and forecasting between 2025 and 2029
- Precise estimation of the size of the market and its contribution of the industry in focus to the parent market
- Accurate predictions about upcoming growth and trends and changes in consumer behaviour
- Growth of the market across North America, APAC, Europe, South America, and Middle East and Africa
- Thorough analysis of the market's competitive landscape and detailed information about companies
- Comprehensive analysis of factors that will challenge the gaming peripheral market growth and forecasting
We can help! Our analysts can customize this gaming peripheral market research report to meet your requirements.
 RIA -
RIA - 
