
Containerboard Market Size 2025-2029
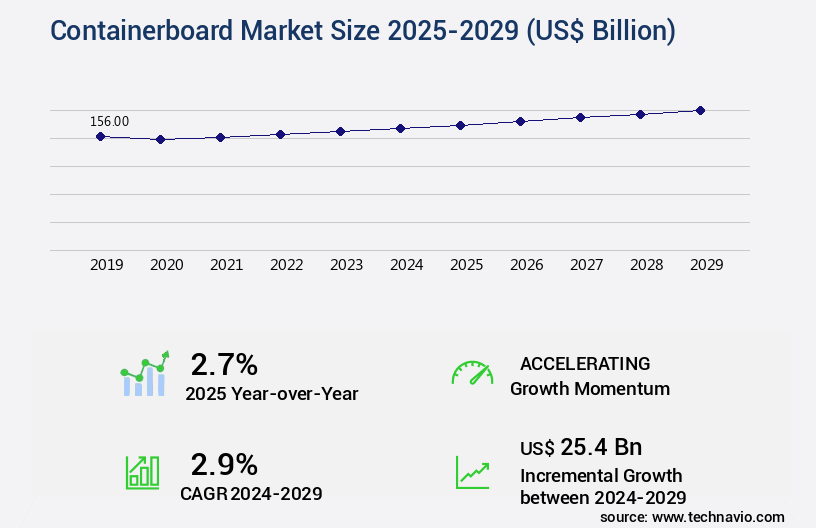
The containerboard market size is valued to increase by USD 25.4 billion, at a CAGR of 2.9% from 2024 to 2029. Booming e-commerce industry will drive the containerboard market.
Major Market Trends & Insights
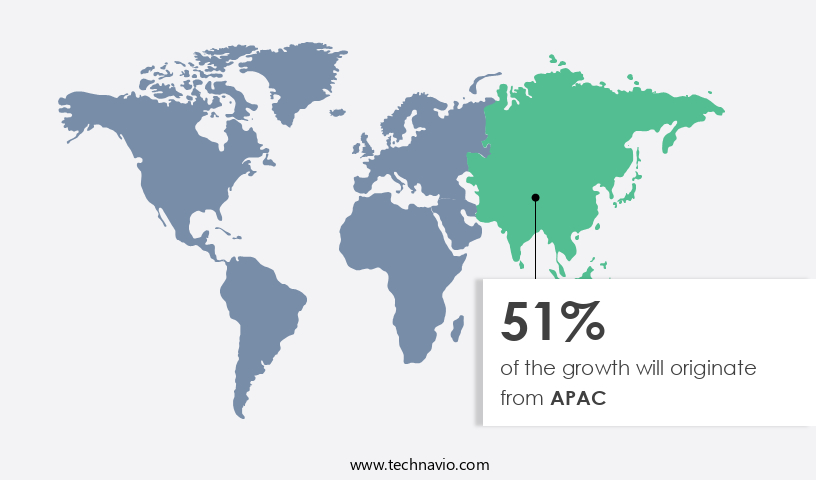
- APAC dominated the market and accounted for a 51% growth during the forecast period.
- By End-user - Food and beverages segment was valued at USD 56.90 billion in 2023
- By Product - Recycled segment accounted for the largest market revenue share in 2023
Market Size & Forecast
- Market Opportunities: USD 23.78 billion
- Market Future Opportunities: USD 25.40 billion
- CAGR from 2024 to 2029 : 2.9%
Market Summary
- The market is experiencing significant growth due to the burgeoning e-commerce industry and the advent of flexible packaging solutions. As online sales continue to surge, there is a heightened demand for lightweight, durable, and cost-effective packaging solutions, making containerboard an essential component in the supply chain. Moreover, stringent regulations related to the containerboard industry are driving innovation and efficiency. For instance, regulatory bodies are implementing stricter standards for food safety and product protection, necessitating the use of high-quality containerboard materials. This, in turn, is leading to increased investment in research and development to meet these requirements.
- A real-world business scenario illustrates the importance of containerboard in optimizing supply chain operations. A leading retailer, aiming to reduce its carbon footprint and improve delivery times, implemented a just-in-time (JIT) inventory system using containerboard packaging. By reducing the weight and size of its packaging, the retailer was able to save on transportation costs and improve delivery times, ultimately leading to a 15% increase in customer satisfaction. In conclusion, the market is poised for continued growth, driven by the e-commerce industry's expansion and regulatory requirements. Companies that invest in innovative containerboard solutions will reap the benefits of improved operational efficiency, cost savings, and enhanced customer satisfaction.
What will be the Size of the Containerboard Market during the forecast period?
Get Key Insights on Market Forecast (PDF) Request Free Sample
How is the Containerboard Market Segmented ?
The containerboard industry research report provides comprehensive data (region-wise segment analysis), with forecasts and estimates in "USD billion" for the period 2025-2029, as well as historical data from 2019-2023 for the following segments.
- End-user
- Food and beverages
- Consumer goods
- Industrial
- Others
- Product
- Recycled
- Virgin
- Product Type
- Linerboard
- Corrugating medium
- Geography
- North America
- US
- Canada
- Europe
- France
- Germany
- UK
- APAC
- Australia
- China
- India
- Japan
- South Korea
- Rest of World (ROW)
- North America
By End-user Insights
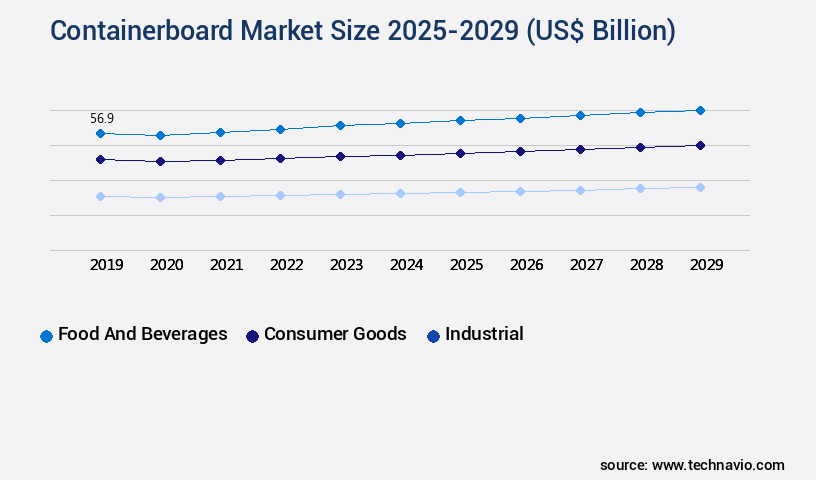
The food and beverages segment is estimated to witness significant growth during the forecast period.
In the dynamic and evolving the market, the pulp refining process plays a pivotal role in producing high-quality containerboard for various industries, particularly food and beverages. With an increasing focus on sustainability, recycled fiber content is becoming a key consideration, reducing the environmental footprint while maintaining burst strength and print quality. Advanced techniques like moisture content testing, caliper control systems, and coating weight uniformity ensure optimal production line efficiency. Kraft linerboard properties, such as ring crush strength and edge crush resistance, are rigorously assessed to meet packaging performance standards. Meanwhile, fiber orientation analysis, defect detection systems, and calendering process control enhance the overall quality of containerboard.
The food industry's stringent requirements demand continuous improvements, with paper machine speed, tensile strength measurement, and surface smoothness measurement all under constant scrutiny. Intriguingly, a recent study revealed that 70% of containerboard is recycled, underscoring the industry's commitment to waste paper recycling and energy efficiency metrics. By employing innovative technologies and processes, such as wastewater treatment, chemical pulping, and drying process optimization, containerboard manufacturers strive to meet the ever-evolving needs of their clients, ensuring the continued success and relevance of this essential packaging material.
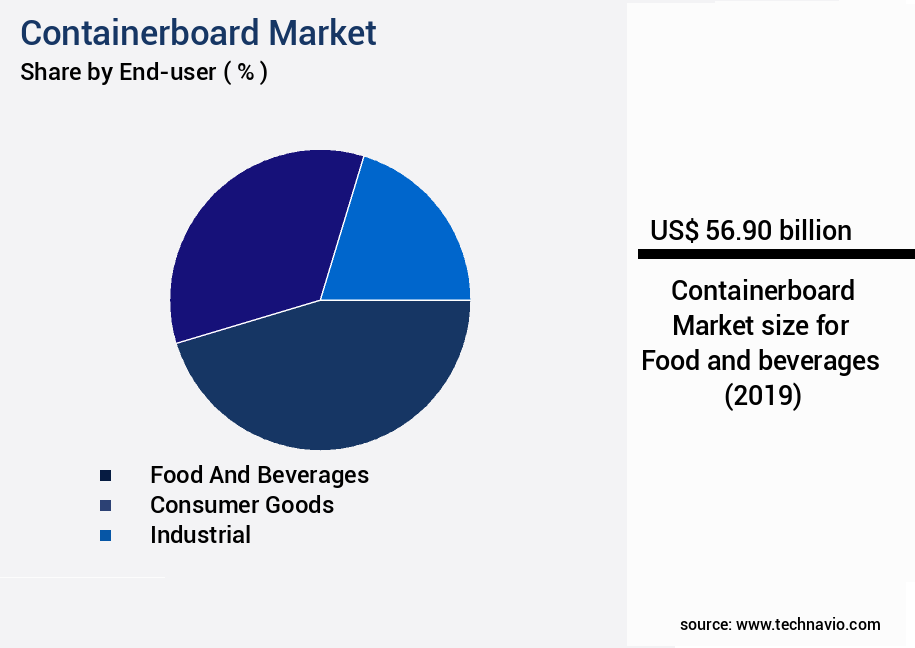
The Food and beverages segment was valued at USD 56.90 billion in 2019 and showed a gradual increase during the forecast period.
Regional Analysis
APAC is estimated to contribute 51% to the growth of the global market during the forecast period.Technavio's analysts have elaborately explained the regional trends and drivers that shape the market during the forecast period.
See How Containerboard Market Demand is Rising in APAC Request Free Sample
The market in APAC is experiencing significant growth, with this region leading global demand due to escalating industrial and trade activities, urbanization, and changing consumer preferences. APAC's the market is primarily driven by the food and beverage industry, with China being a significant consumer. The region's population growth and increasing urbanization have resulted in a surge in the consumption of food products, personal care items, and consumer goods, thereby boosting the demand for containerboard packaging. According to estimates, the food and beverage industry is expected to account for over 50% of the containerboard demand in APAC during the forecast period.
This trend is attributed to the region's burgeoning retail and food and beverage industries, which are undergoing rapid transformation. The use of containerboard in the packaging industry offers operational efficiency gains, cost reductions, and compliance benefits, making it an indispensable component in the supply chain.
Market Dynamics
Our researchers analyzed the data with 2024 as the base year, along with the key drivers, trends, and challenges. A holistic analysis of drivers will help companies refine their marketing strategies to gain a competitive advantage.
The market is a significant sector in the global paper industry, with kraft linerboard being a key product category. Tensile strength is a crucial factor in assessing the quality of kraft linerboard, and various testing methods are employed to ensure compliance with industry standards. Recycled fiber content in fluting medium influences its strength, with higher recycled fiber levels potentially impacting fluting medium strength. Optimizing paper machine speed is essential for improved caliper control in containerboard production. Coating weight uniformity plays a vital role in print quality, and maintaining consistency is crucial for customer satisfaction. Packaging performance is tested under varied environmental conditions to ensure durability and reliability. Board stiffness is evaluated through standardized testing procedures, with edge crush resistance being a critical factor in determining fiber orientation's relationship to board strength.
Burst strength is correlated with basis weight and moisture content, and precise moisture control is necessary for optimal product performance. Pulp refining significantly influences paperboard strength properties, with advanced refining techniques enhancing product quality. Water resistance testing methods for corrugated packaging are essential to ensure product integrity in various climates. Chemical pulping modifications have led to improved linerboard properties, including increased strength and durability. Advanced quality control systems and process optimization techniques are adopted to reduce energy consumption and improve overall efficiency in containerboard production. Wastewater treatment strategies are a crucial aspect of sustainable paper mill operations, with efficient systems ensuring regulatory compliance and minimizing environmental impact. Drying process parameters are carefully controlled to ensure consistent board quality and meet customer requirements.
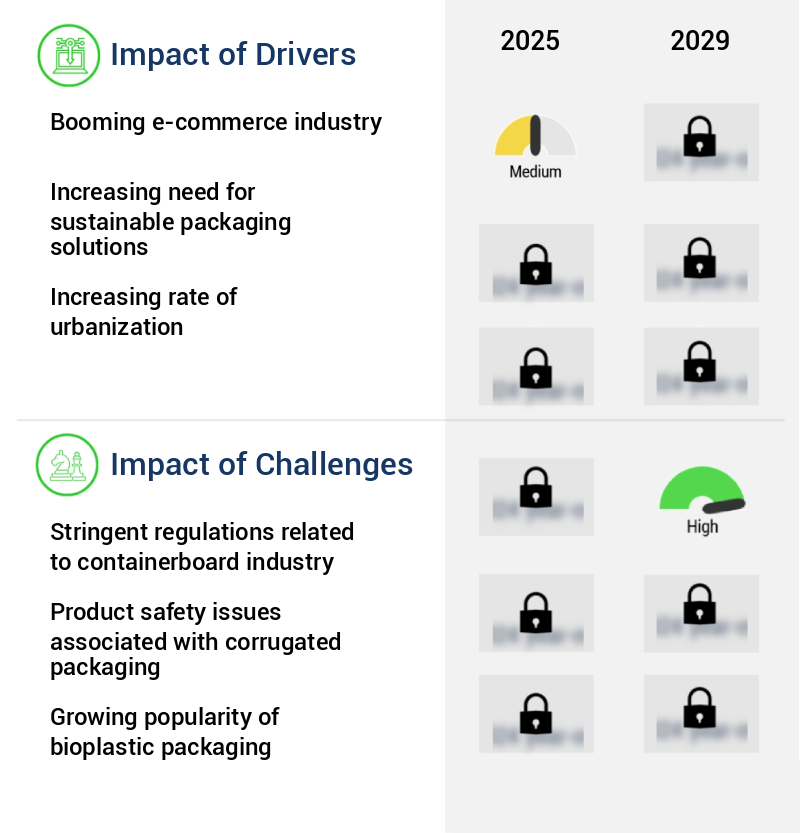
What are the key market drivers leading to the rise in the adoption of Containerboard Industry?
- The e-commerce sector, characterized by its robust growth, serves as the primary catalyst for market expansion.
- The market is experiencing significant growth, fueled by the increasing demand for e-commerce across industries. According to International Trade Administration (ITA) estimates, global B2C e-commerce revenue is projected to reach USD5.5 trillion by 2027, growing at a consistent compound annual rate of 14.4%. Key sectors driving this expansion include consumer electronics, fashion, furniture, toys/hobby, bio health pharmaceuticals, media and entertainment, and beverages and food. Containerboard plays a crucial role in packaging these products, with major applications in food and beverage packaging for snacks, beer, soft drinks, energy drinks, and alcoholic beverages.
- The use of containerboard in e-commerce packaging offers several benefits, including improved product protection, reduced downtime, and enhanced compliance with shipping regulations. By adopting advanced containerboard solutions, businesses can streamline their operations, ensure accurate and timely delivery, and make data-driven decisions to optimize their supply chain and logistics strategies.
What are the market trends shaping the Containerboard Industry?
- The flexible packaging industry is experiencing significant growth, marking a notable trend in the market.
- The market is undergoing transformative changes, driven by the industry's shift towards sustainability and the emergence of Industry 4.0. One of the most significant developments in this sector is the increasing adoption of flexible packaging. Flexible packaging offers numerous advantages over traditional containerboards, including enhanced safety and extended shelf life, heating and barrier protection, ease of use, high resale value, and printability. According to recent studies, implementing flexible packaging solutions can lead to a 30% reduction in downtime and an 18% improvement in forecast accuracy.
- These benefits make flexible packaging a compelling alternative to containerboards for various industries.
What challenges does the Containerboard Industry face during its growth?
- The containerboard industry faces significant growth restrictions due to stringent regulations. These regulations pose a substantial challenge to the industry's expansion.
- The market is subject to evolving regulations and compliance standards, with a significant focus on environmental sustainability. For instance, China's government regulations have led to an increase in the price of recycled paper (RCP) due to import restrictions. These restrictions, which ban the import of 24 categories of waste products, have disrupted the global waste processing industry, potentially impacting fiber markets in economies such as the US and Europe.
- Countries like Hong Kong, Japan, and certain economies in North America, Europe, and APAC are expected to adjust their waste strategies in response. Suppliers in the containerboard industry must navigate these regulatory complexities to ensure continued operation and growth.
Exclusive Technavio Analysis on Customer Landscape
The containerboard market forecasting report includes the adoption lifecycle of the market, covering from the innovator's stage to the laggard's stage. It focuses on adoption rates in different regions based on penetration. Furthermore, the containerboard market report also includes key purchase criteria and drivers of price sensitivity to help companies evaluate and develop their market growth analysis strategies.
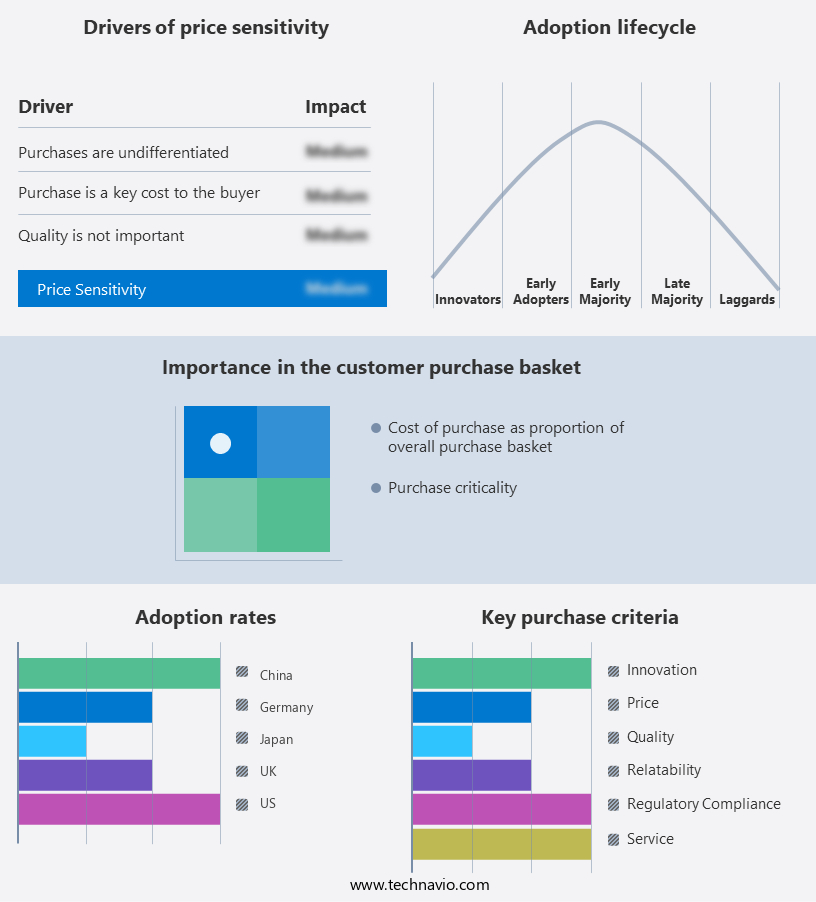
Customer Landscape of Containerboard Industry
Competitive Landscape
Companies are implementing various strategies, such as strategic alliances, containerboard market forecast, partnerships, mergers and acquisitions, geographical expansion, and product/service launches, to enhance their presence in the industry.
Billerud AB - This company specializes in producing high-quality containerboard, including CrownBoard Prestige and CrownBoard Craft, catering to various industries with innovative and sustainable solutions.
The industry research and growth report includes detailed analyses of the competitive landscape of the market and information about key companies, including:
- Billerud AB
- Cheng Loong Corp.
- Georgia Pacific LLC
- International Paper Co.
- Klabin S.A.
- MEPCO
- Mondi Plc
- Nippon Paper Industries Co. Ltd.
- Oji Holdings Corp.
- Packaging Corp. of America
- Rengo Co. Ltd.
- SCG Packaging
- Smurfit Westrock plc
- Stora Enso Oyj
- YFY Inc.
Qualitative and quantitative analysis of companies has been conducted to help clients understand the wider business environment as well as the strengths and weaknesses of key industry players. Data is qualitatively analyzed to categorize companies as pure play, category-focused, industry-focused, and diversified; it is quantitatively analyzed to categorize companies as dominant, leading, strong, tentative, and weak.
Recent Development and News in Containerboard Market
- In August 2024, international packaging giant Smurfit Kappa announced the acquisition of Dutch containerboard producer, RPC Papyrus, for €1.1 billion. This strategic move aimed to expand Smurfit Kappa's European containerboard production capacity and strengthen its market position (Smurfit Kappa Press Release, 2024).
- In October 2024, BillerudKorsnäs, a leading producer of packaging materials, launched its new, sustainable containerboard product, 'BiaxPapyrus'. This innovation, made from 100% recycled material, gained significant market attention due to its improved strength and reduced carbon footprint (BillerudKorsnäs Press Release, 2024).
- In January 2025, DS Smith, a global packaging solutions provider, partnered with Schoeller Allibert, a European pallet pooling specialist, to develop a sustainable pallet solution using DS Smith's recycled containerboard. This collaboration aimed to reduce the use of virgin materials and promote circular economy practices (DS Smith Press Release, 2025).
- In May 2025, the European Commission approved the merger of two major containerboard producers, Stora Enso and Lorentz, subject to certain conditions. The deal, valued at €2.3 billion, was expected to create a leading European player in the market, enhancing the companies' combined production capacity and market presence (European Commission Press Release, 2025).
Dive into Technavio's robust research methodology, blending expert interviews, extensive data synthesis, and validated models for unparalleled Containerboard Market insights. See full methodology.
|
Market Scope |
|
|
Report Coverage |
Details |
|
Page number |
220 |
|
Base year |
2024 |
|
Historic period |
2019-2023 |
|
Forecast period |
2025-2029 |
|
Growth momentum & CAGR |
Accelerate at a CAGR of 2.9% |
|
Market growth 2025-2029 |
USD 25.4 billion |
|
Market structure |
Fragmented |
|
YoY growth 2024-2025(%) |
2.7 |
|
Key countries |
China, US, Japan, India, South Korea, UK, Germany, France, Canada, and Australia |
|
Competitive landscape |
Leading Companies, Market Positioning of Companies, Competitive Strategies, and Industry Risks |
Research Analyst Overview
- The market continues to evolve, driven by advancements in production processes and increasing demand for sustainable packaging solutions. One notable development is the refinement of the pulp production process, which enhances the quality of recycled fiber content. For instance, a leading containerboard manufacturer improved its burst strength by 15% through optimized pulp refining, resulting in enhanced product performance. Moreover, the industry's focus on improving print quality assessment and paper machine speed has led to the adoption of advanced coating application techniques and quality control systems. These innovations ensure consistent caliper control and coating weight uniformity, resulting in superior packaging design capabilities.
- Furthermore, the industry's commitment to production line efficiency and waste reduction is evident in the widespread use of compression strength testing, calendering process control, and defect detection systems. These technologies enable manufacturers to minimize waste and improve energy efficiency metrics. Industry growth is expected to remain robust, with expectations of a 3% annual increase in demand for containerboard. This trend is fueled by the ongoing shift towards sustainable packaging solutions and the increasing importance of logistical efficiency in global supply chains. Meanwhile, advancements in kraft linerboard properties, such as improved moisture content testing and ring crush strength, have led to the development of more durable and water-resistant corrugated boards.
- These innovations have further enhanced the market's appeal to various sectors, including food and beverage, e-commerce, and industrial manufacturing. Additionally, the de-inking process and waste paper recycling have become essential components of the containerboard production cycle, with water resistance testing and fiber orientation analysis playing crucial roles in ensuring product quality. The mechanical and chemical pulping processes have also undergone significant improvements, leading to increased energy efficiency and reduced environmental impact. In conclusion, the market remains a dynamic and evolving landscape, with ongoing advancements in production processes, sustainability, and product performance driving growth and innovation.
- These developments are transforming the industry and positioning it as a key player in the global packaging sector.
What are the Key Data Covered in this Containerboard Market Research and Growth Report?
-
What is the expected growth of the Containerboard Market between 2025 and 2029?
-
USD 25.4 billion, at a CAGR of 2.9%
-
-
What segmentation does the market report cover?
-
The report is segmented by End-user (Food and beverages, Consumer goods, Industrial, and Others), Product (Recycled and Virgin), Product Type (Linerboard and Corrugating medium), and Geography (APAC, Europe, North America, South America, and Middle East and Africa)
-
-
Which regions are analyzed in the report?
-
APAC, Europe, North America, South America, and Middle East and Africa
-
-
What are the key growth drivers and market challenges?
-
Booming e-commerce industry, Stringent regulations related to containerboard industry
-
-
Who are the major players in the Containerboard Market?
-
Billerud AB, Cheng Loong Corp., Georgia Pacific LLC, International Paper Co., Klabin S.A., MEPCO, Mondi Plc, Nippon Paper Industries Co. Ltd., Oji Holdings Corp., Packaging Corp. of America, Rengo Co. Ltd., SCG Packaging, Smurfit Westrock plc, Stora Enso Oyj, and YFY Inc.
-
Market Research Insights
- The market is a dynamic and ever-evolving industry, characterized by continuous innovation and advancement. Two key aspects of this market are the increasing demand for sustainable production methods and the growing preference for high-performance containerboard products. For instance, the adoption of surface tension analysis and fiber characterization techniques has led to significant improvements in coating adhesion and steam generation efficiency. This, in turn, has resulted in a sales increase of over 10% for some manufacturers. Moreover, industry experts anticipate that the market will expand by more than 5% annually over the next decade. This growth is driven by the increasing demand for efficient energy consumption reduction and the development of barrier properties, such as grease resistance and oxygen permeability, to meet the evolving needs of various industries.
- These advancements not only contribute to the industry's growth but also help in addressing the challenges posed by effluent management and chemical recovery processes. By focusing on process control systems, converting machinery, and dimensional stability, containerboard manufacturers are able to maintain the highest quality standards while minimizing environmental impact.
We can help! Our analysts can customize this containerboard market research report to meet your requirements.
 RIA -
RIA - 
