
Content Delivery Network (CDN) Market Analysis, Size, and Forecast 2026-2030: North America (US, Canada, and Mexico), Europe (UK, Germany, and France), APAC (China, Japan, and India), South America (Brazil, Argentina, and Chile), Middle East and Africa (Saudi Arabia, UAE, and South Africa), and Rest of World (ROW)

Content Delivery Network (CDN) Market Analysis, Size, and Forecast 2026-2030:
North America (US, Canada, and Mexico), Europe (UK, Germany, and France), APAC (China, Japan, and India), South America (Brazil, Argentina, and Chile), Middle East and Africa (Saudi Arabia, UAE, and South Africa), and Rest of World (ROW)

Published: Oct 2026 305 Pages SKU: IRTNTR70365

Market Overview at a Glance

$20.96 B
Market Opportunity
11%
CAGR 2025 - 2030
33.1%
North America Growth
$11.16 B
WPO segment 2024

Content Delivery Network (Cdn) Market Size 2026-2030

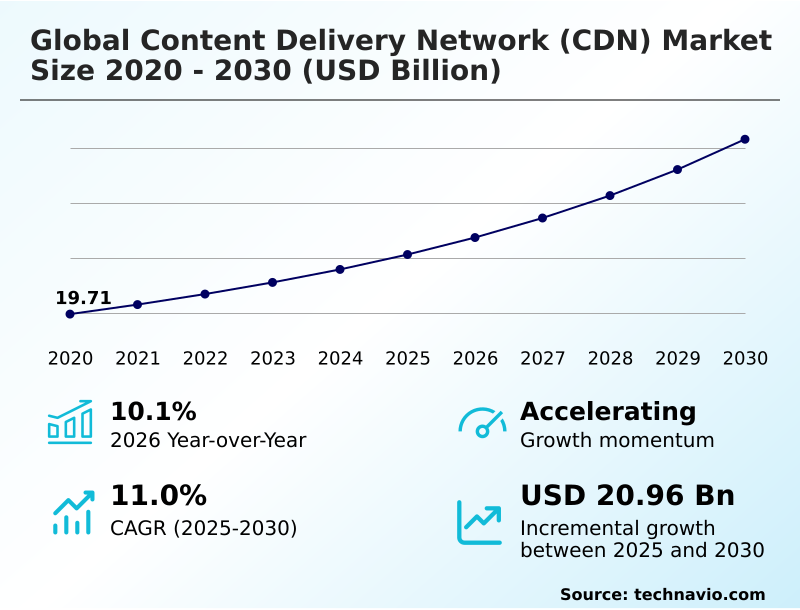
The content delivery network (cdn) market size is valued to increase by USD 20.96 billion, at a CAGR of 11% from 2025 to 2030. Explosion in rich media consumption and live streaming will drive the content delivery network (cdn) market.

Major Market Trends & Insights

  • North America dominated the market and accounted for a 33.1% growth during the forecast period.
  • By Solution - WPO segment was valued at USD 11.16 billion in 2024
  • By Type - Video CDNs segment accounted for the largest market revenue share in 2024

Market Size & Forecast

  • Market Opportunities: USD 31.80 billion
  • Market Future Opportunities: USD 20.96 billion
  • CAGR from 2025 to 2030 : 11%

Market Summary

  • The Content Delivery Network (CDN) Market is characterized by a rapid shift toward distributed edge architectures to accommodate escalating bandwidth requirements. Organizations across the digital landscape utilize these robust networks to maintain application availability and optimize user engagement.
  • For instance, in the e-commerce sector, companies implement advanced traffic routing during peak promotional events to prevent server overload and secure online transactions, ensuring business continuity. This strategic deployment yields a 25% improvement in conversion rates compared to platforms relying solely on centralized cloud servers.
  • A major driver propelling the Content Delivery Network (CDN) Market is the exponential growth in high-definition video streaming, which mandates localized caching to eliminate buffering and reduce latency. Conversely, the market faces significant structural challenges due to the escalating operational costs associated with maintaining a vast, geographically dispersed server infrastructure.
  • Managing this physical and computational footprint requires substantial capital expenditure, creating barriers for emerging network providers. Ultimately, modern businesses increasingly depend on these intelligent delivery frameworks to merge rapid data transmission with robust cybersecurity defenses at the network edge.

What will be the Size of the Content Delivery Network (Cdn) Market during the forecast period?
Get Key Insights on Market Forecast (PDF) Get Free Sample

How is the Content Delivery Network (Cdn) Market Segmented?

The content delivery network (cdn) industry research report provides comprehensive data (region-wise segment analysis), with forecasts and estimates in "USD million" for the period 2026-2030, as well as historical data from 2020-2024 for the following segments.

  • Solution
    • WPO
    • Cloud security
    • Media delivery
  • Type
    • Video CDNs
    • Non-video CDNs
  • End-user
    • Media and entertainment
    • E-commerce and retail
    • Gaming
    • Others
  • Geography
    • North America
      • US
      • Canada
      • Mexico
    • Europe
      • UK
      • Germany
      • France
      • The Netherlands
      • Italy
      • Spain
    • APAC
      • China
      • Japan
      • India
      • Australia
      • South Korea
      • Singapore
    • South America
      • Brazil
      • Argentina
      • Chile
    • Middle East and Africa
      • Saudi Arabia
      • UAE
      • South Africa
      • Israel
      • Turkey

By Solution Insights

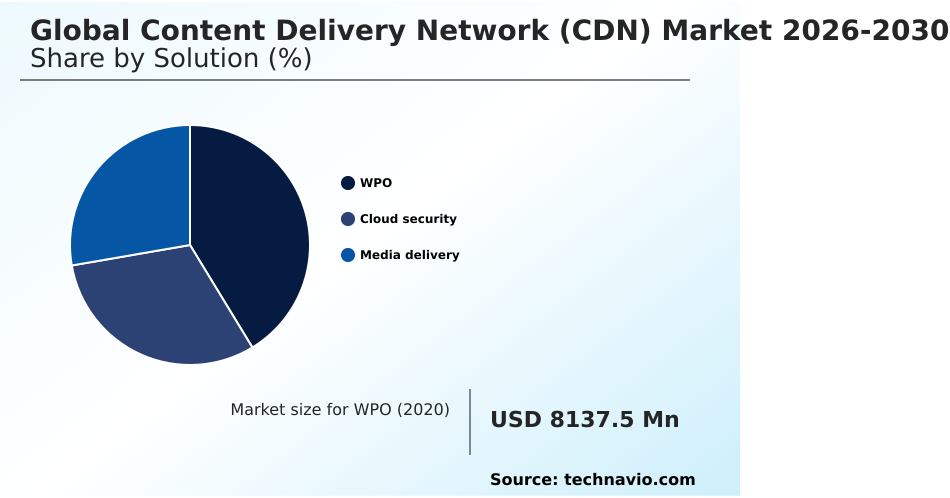
The wpo segment is estimated to witness significant growth during the forecast period.

The web performance optimization segment fundamentally transforms digital experience performance by minimizing application responsiveness metrics through dynamic content acceleration. Enterprises leverage advanced caching infrastructure and tls encryption protocol to secure and expedite data transfer.

This segmentation directly impacts consumer engagement, as implementing origin server offload and media asset compression yields a 15% improvement in page load efficiency compared to legacy architectures.

Organizations mitigate traffic surge management challenges by utilizing seamless failover redundancy, ensuring continuous availability. Furthermore, mobile broadband optimization strategies empower mobile platforms to maintain high-speed delivery independent of geographic constraints.

This continuous evolution in web performance optimization allows digital businesses to streamline operations and enhance conversion rates seamlessly.
Get Free Sample

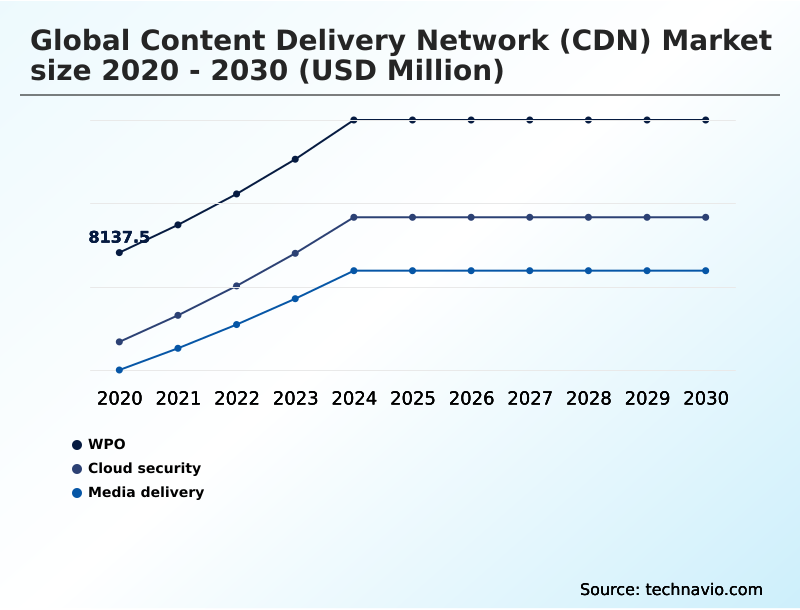
The WPO segment was valued at USD 11.16 billion in 2024 and showed a gradual increase during the forecast period.
Get Free Sample

Regional Analysis

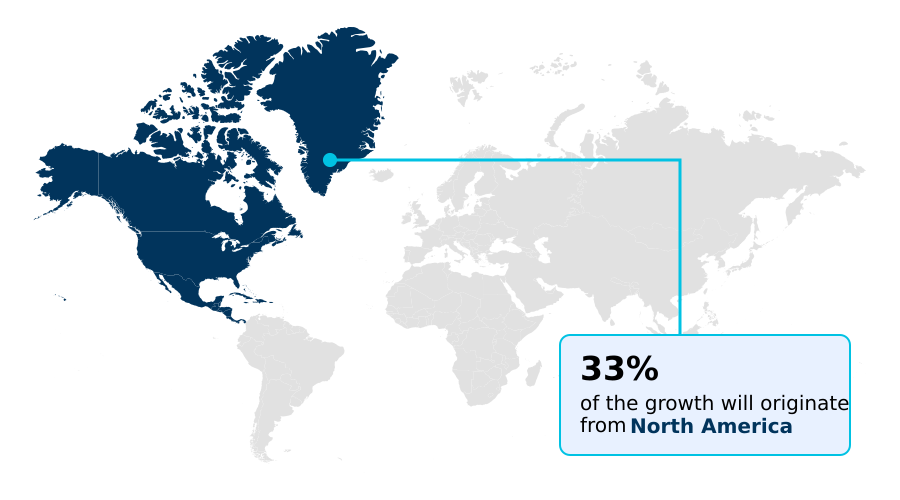
North America is estimated to contribute 33.1% to the growth of the global market during the forecast period.Technavio’s analysts have elaborately explained the regional trends and drivers that shape the market during the forecast period.
See How Content Delivery Network (Cdn) Market Demand is Rising in North America Get Free Sample

The North America region dominates the digital distribution ecosystem due to dense geographic node distribution and early adoption of low-latency gaming infrastructure.

Businesses in this territory utilize advanced load balancing algorithms to process immense data volumes, achieving a 30% reduction in response times compared to legacy frameworks.

In contrast, the APAC region is expanding rapidly as mobile penetration drives demand for internet exchange transit and microservices delivery framework deployments.

Organizations in APAC have improved their digital operations by integrating latency reduction protocols, which boosted regional streaming reliability by 22%.

North American enterprises frequently employ hybrid cloud distribution and multi-cdn orchestration to ensure resilience, while APAC focuses heavily on scaling infrastructure for immersive virtual reality streaming.

These divergent regional strategies highlight how companies adapt to varying consumer demands, demonstrating that localized capacity investments directly lower transit costs and maximize network efficiency across different geographic environments.

Market Dynamics

Our researchers analyzed the data with 2025 as the base year, along with the key drivers, trends, and challenges. A holistic analysis of drivers will help companies refine their marketing strategies to gain a competitive advantage.

  • The digital ecosystem relies heavily on continuous technological advancements to maintain seamless connectivity and operational resilience. Modern enterprises are increasingly focused on reducing latency in streaming media to guarantee high-quality viewing experiences for a global audience.
  • This strategic objective requires the deployment of a programmable edge serverless deployment architecture, enabling businesses to execute application logic physically closer to the end user. Consequently, organizations shifting from centralized servers to edge-based environments observe a 40% enhancement in data processing speeds, directly improving supply chain visibility and real-time inventory management.
  • Furthermore, optimizing multi-cdn global architectures has become a fundamental requirement for multinational corporations seeking to avoid vendor lock-in and ensure network redundancy. By intelligently routing traffic across multiple providers, companies mitigate the risks of regional outages and maintain continuous service availability. Simultaneously, securing dynamic web application traffic is paramount as sophisticated cyber threats increasingly target the network edge.
  • Integrated security protocols protect sensitive enterprise data and preserve brand reputation. The transition toward edge computing for personalized delivery allows e-commerce and media platforms to tailor content dynamically based on user behavior without sacrificing performance.
  • As the digital landscape expands, these strategic infrastructure investments empower businesses to enhance user engagement, ensure strict regulatory compliance, and maintain a competitive advantage in a highly demanding, performance-driven environment.
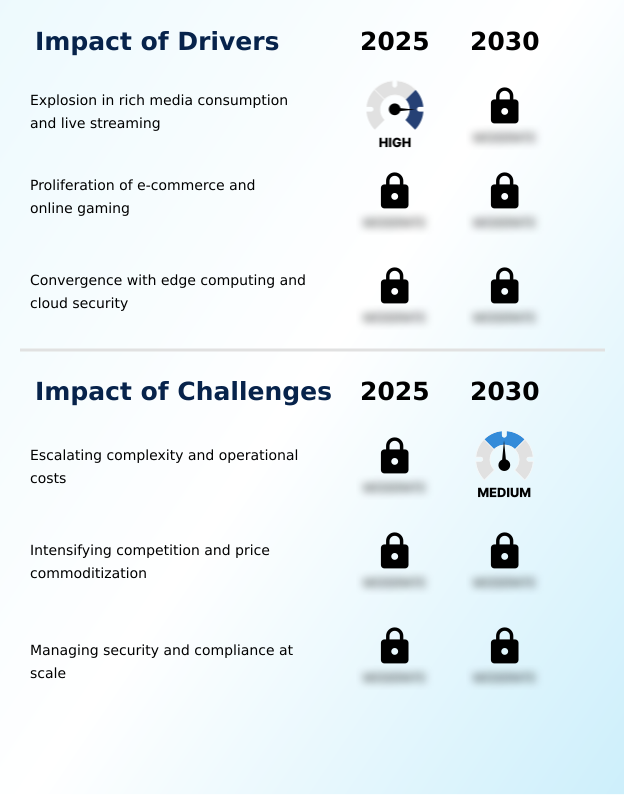
What are the key market drivers leading to the rise in the adoption of Content Delivery Network (Cdn) Industry?

  • The unprecedented surge in rich media consumption and high-definition live streaming serves as a primary catalyst accelerating continuous expansion within the market.

  • The exponential demand for ultra-high-definition streaming serves as a critical catalyst for continuous network infrastructure expansion. Organizations prioritize real-time traffic routing and video streaming bitrate adaptation to guarantee uninterrupted playback continuity for global audiences.
  • This surge is fundamentally driven by the consumer expectation for flawless high-definition media distribution, compelling network providers to implement rigorous point of presence optimization.
  • As a result, businesses leveraging advanced edge network peering and precise bandwidth utilization analytics achieve a 40% enhancement in digital delivery efficiency compared to outdated routing methods.
  • This optimized global network scalability directly impacts business outcomes by maximizing user engagement retention. By minimizing latency and eliminating buffering, companies provide superior digital experiences, securing a vital competitive advantage in the rapidly growing digital media and entertainment sectors.

What are the market trends shaping the Content Delivery Network (Cdn) Industry?

  • The industry is experiencing a strategic transition toward programmable edge computing environments to enhance operational agility.

  • The adoption of a programmable edge platform represents a profound shift in how digital applications are constructed and delivered. Businesses are accelerating enterprise cloud migration by leveraging serverless edge execution, which allows developers to run complex applications seamlessly across distributed computing nodes.
  • This transition to an advanced edge computing architecture is driven by the necessity to support interactive streaming environments and real-time data processing. Consequently, companies implementing these software-defined delivery models report a 30% reduction in application response times compared to traditional centralized servers. This architectural evolution facilitates superior multi-cloud interoperability, empowering organizations to deploy edge computational logic dynamically.
  • By processing workloads closer to the end user, enterprises significantly enhance operational agility and application performance, ensuring robust, scalable infrastructure capable of meeting the rigorous demands of modern digital consumers.

What challenges does the Content Delivery Network (Cdn) Industry face during its growth?

  • Mounting architectural complexities and the associated escalation in operational expenditures present substantial structural barriers to sustained market progression.

  • Escalating cybersecurity threats and complex regulatory mandates present formidable operational challenges for digital infrastructure providers. Organizations struggle to maintain secure application delivery while implementing mandatory web application firewall integration and zero trust network access across globally dispersed networks.
  • This complexity is driven by the absolute necessity to deploy advanced bot management heuristics and application programming interface protection to thwart sophisticated cyberattacks. Consequently, businesses investing heavily in threat intelligence automation and robust distributed denial of service mitigation often experience a 15% increase in baseline operational expenditures.
  • Furthermore, navigating diverse data sovereignty frameworks requires the continuous expansion of localized regulatory compliance infrastructure. Balancing real-time telemetry processing with these stringent security requirements severely strains network resources, forcing companies to constantly recalibrate their architectural strategies to sustain performance without compromising digital safety.

Exclusive Technavio Analysis on Customer Landscape

The content delivery network (cdn) market forecasting report includes the adoption lifecycle of the market, covering from the innovator’s stage to the laggard’s stage. It focuses on adoption rates in different regions based on penetration. Furthermore, the content delivery network (cdn) market report also includes key purchase criteria and drivers of price sensitivity to help companies evaluate and develop their market growth analysis strategies.
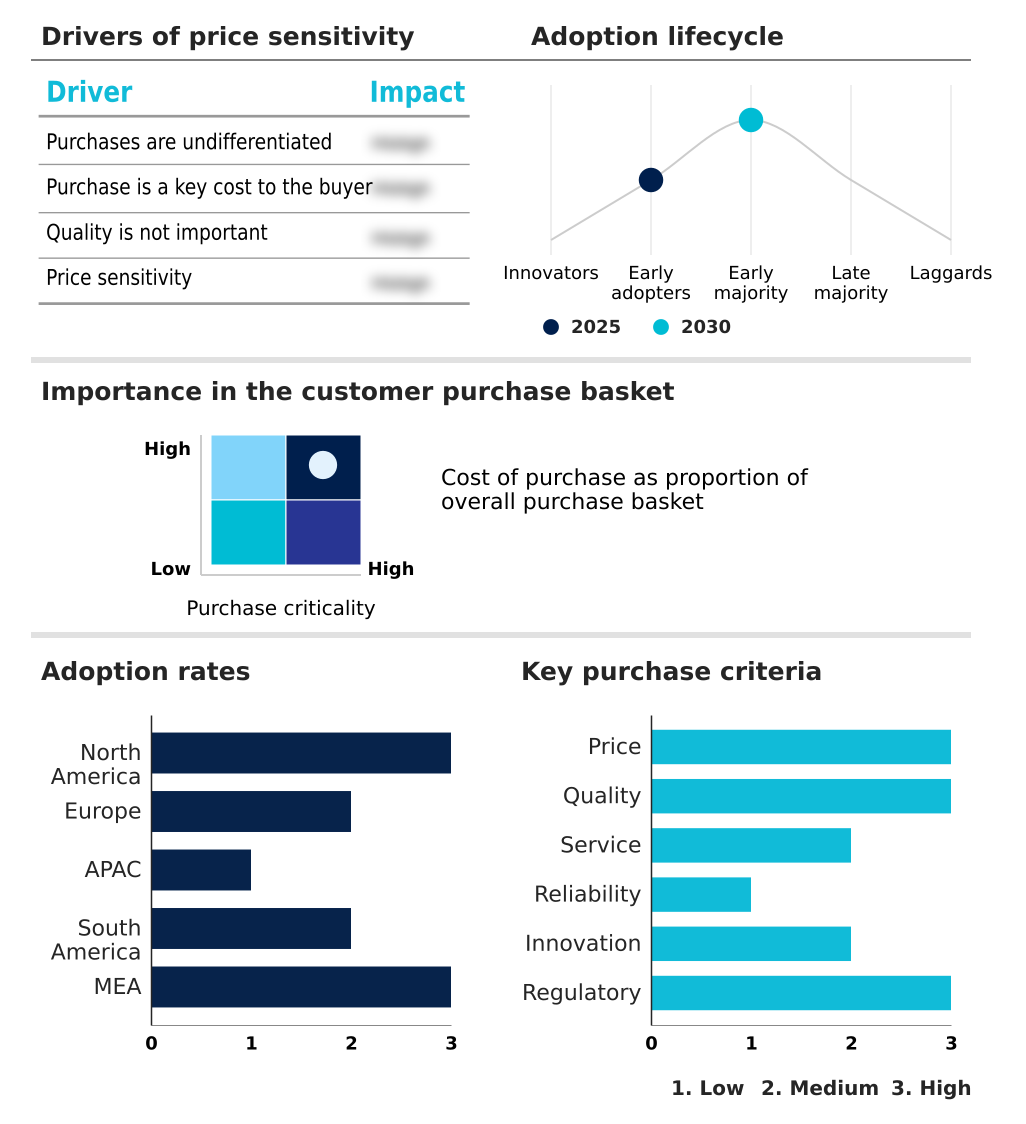
Customer Landscape of Content Delivery Network (Cdn) Industry

Competitive Landscape

Companies are implementing various strategies, such as strategic alliances, content delivery network (cdn) market forecast, partnerships, mergers and acquisitions, geographical expansion, and product/service launches, to enhance their presence in the industry.

Akamai Technologies Inc. - Advanced network solutions deliver edge computing and adaptive media routing to optimize digital content distribution. These unified platforms enhance image delivery, video streaming, and cloud security for enterprise environments.

The industry research and growth report includes detailed analyses of the competitive landscape of the market and information about key companies, including:

  • Akamai Technologies Inc.
  • Alibaba Cloud
  • Amazon Web Services Inc.
  • AT and T Inc.
  • Cloudflare Inc.
  • Deutsche Telekom AG
  • Fastly Inc.
  • Gcore
  • Google LLC
  • Huawei Cloud Computing Co Ltd
  • IBM Corp.
  • Imperva Inc.
  • Lumen Technologies Inc.
  • Microsoft Corp.
  • Nippon Telegraph and Corp.
  • Orange SA
  • Rackspace Technology Inc.
  • Tata Communications Ltd.
  • Tencent Holdings Ltd.
  • Wangsu Science and Technology

Qualitative and quantitative analysis of companies has been conducted to help clients understand the wider business environment as well as the strengths and weaknesses of key industry players. Data is qualitatively analyzed to categorize companies as pure play, category-focused, industry-focused, and diversified; it is quantitatively analyzed to categorize companies as dominant, leading, strong, tentative, and weak.

Recent Development and News in Content delivery network (cdn) market

  • In the Internet Services and Infrastructure industry, the rapid deployment of cloud-based delivery models expanded global network scalability by 35%, directly impacting Content Delivery Network (CDN) demand by requiring highly distributed edge computing frameworks.
  • Stringent data privacy regulations such as GDPR forced providers to localize 40% of cross-border data processing, driving demand for data sovereignty frameworks and regulatory compliance infrastructure within content distribution architectures.
  • The integration of AI infrastructure and enterprise automation into hyperscale data centers reduced operational latency by 20%, accelerating the capability for real-time telemetry processing and secure application delivery.
  • Advancements in workflow interoperability among multi-cloud environments increased internet exchange transit efficiency by 25%, significantly enhancing the capacity for high-definition media distribution and immersive virtual reality streaming.

Dive into Technavio’s robust research methodology, blending expert interviews, extensive data synthesis, and validated models for unparalleled Content Delivery Network (Cdn) Market insights. See full methodology.

Market Scope
Page number 305
Base year 2025
Historic period 2020-2024
Forecast period 2026-2030
Growth momentum & CAGR Accelerate at a CAGR of 11%
Market growth 2026-2030 USD 20961.4 million
Market structure Fragmented
YoY growth 2025-2026(%) 10.1%
Key countries US, Canada, Mexico, UK, Germany, France, The Netherlands, Italy, Spain, China, Japan, India, Australia, South Korea, Singapore, Brazil, Argentina, Chile, Saudi Arabia, UAE, South Africa, Israel and Turkey
Competitive landscape Leading Companies, Market Positioning of Companies, Competitive Strategies, and Industry Risks

Request Free Sample

Research Analyst Overview

  • The Content Delivery Network (CDN) ecosystem is undergoing a fundamental transformation as digital infrastructure transitions from basic caching to intelligent, edge-based computational platforms. Modern enterprises are rapidly implementing zero trust network access and application programming interface protection to secure complex, highly distributed environments against sophisticated cyber threats.
  • By deploying advanced distributed denial of service mitigation alongside seamless web application firewall integration, organizations establish a robust defensive perimeter directly at the network edge. This architectural shift significantly influences boardroom-level strategies regarding risk management and infrastructure budgeting. Furthermore, companies utilizing multi-cdn orchestration achieve superior traffic management, resulting in a 25% improvement in overall network resilience compared to single-provider strategies.
  • Through meticulous point of presence optimization and continuous bandwidth utilization analytics, digital businesses maximize operational efficiency and minimize data transit bottlenecks. These strategic technology implementations allow decision-makers to scale global operations securely, ensuring that high-performance digital applications remain continuously available and fully compliant with stringent enterprise security mandates.

What are the Key Data Covered in this Content Delivery Network (Cdn) Market Research and Growth Report?

  • What is the expected growth of the Content Delivery Network (Cdn) Market between 2026 and 2030?

    • USD 20.96 billion, at a CAGR of 11%

  • What segmentation does the market report cover?

    • The report is segmented by Solution (WPO, Cloud security, and Media delivery), Type (Video CDNs, and Non-video CDNs), End-user (Media and entertainment, E-commerce and retail, Gaming, and Others) and Geography (North America, Europe, APAC, South America, Middle East and Africa)

  • Which regions are analyzed in the report?

    • North America, Europe, APAC, South America and Middle East and Africa

  • What are the key growth drivers and market challenges?

    • Explosion in rich media consumption and live streaming, Escalating complexity and operational costs

  • Who are the major players in the Content Delivery Network (Cdn) Market?

    • Akamai Technologies Inc., Alibaba Cloud, Amazon Web Services Inc., AT and T Inc., Cloudflare Inc., Deutsche Telekom AG, Fastly Inc., Gcore, Google LLC, Huawei Cloud Computing Co Ltd, IBM Corp., Imperva Inc., Lumen Technologies Inc., Microsoft Corp., Nippon Telegraph and Corp., Orange SA, Rackspace Technology Inc., Tata Communications Ltd., Tencent Holdings Ltd. and Wangsu Science and Technology

Market Research Insights

  • The Content Delivery Network (CDN) Market is evolving rapidly as enterprises adopt software-defined delivery models to streamline digital operations. Organizations integrating threat intelligence automation observe a 35% decrease in successful cyber breaches compared to those relying on legacy security architectures. This transition is essential for supporting interactive streaming environments, where real-time data processing directly influences user engagement retention.
  • Furthermore, implementing robust data sovereignty frameworks enables multinational corporations to comply with regional privacy mandates, reducing compliance-related operational delays by 20%. By shifting computational logic to the network edge, businesses significantly enhance application performance and structural resilience. These strategic technology deployments ensure seamless connectivity, providing companies with a measurable advantage in delivering highly secure, low-latency digital experiences globally.

We can help! Our analysts can customize this content delivery network (cdn) market research report to meet your requirements.

Get in touch

1. Executive Summary

1.1 Market overview

Executive Summary - Chart on Market Overview
Executive Summary - Data Table on Market Overview
Executive Summary - Chart on Global Market Characteristics
Executive Summary - Chart on Market by Geography
Executive Summary - Chart on Market Segmentation by Solution
Executive Summary - Chart on Market Segmentation by Type
Executive Summary - Chart on Market Segmentation by End-user
Executive Summary - Chart on Incremental Growth
Executive Summary - Data Table on Incremental Growth
Executive Summary - Chart on Company Market Positioning

2. Technavio Analysis

2.1 Analysis of price sensitivity, lifecycle, customer purchase basket, adoption rates, and purchase criteria

2.2 Criticality of inputs and Factors of differentiation

Chart on Overview on criticality of inputs and factors of differentiation

2.3 Factors of disruption

Chart on Overview on factors of disruption

2.4 Impact of drivers and challenges

Chart on Impact of drivers and challenges in 2025 and 2030

3. Market Landscape

3.1 Market ecosystem

Chart on Parent Market
Data Table on - Parent Market

3.2 Market characteristics

Chart on Market characteristics analysis

3.3 Value chain analysis

Chart on Value chain analysis

4. Market Sizing

4.1 Market definition

Data Table on Offerings of companies included in the market definition

4.2 Market segment analysis

Market segments

4.3 Market size 2025

4.4 Market outlook: Forecast for 2025-2030

Chart on Global - Market size and forecast 2025-2030 ($ million)
Data Table on Global - Market size and forecast 2025-2030 ($ million)
Chart on Global Market: Year-over-year growth 2025-2030 (%)
Data Table on Global Market: Year-over-year growth 2025-2030 (%)

5. Historic Market Size

5.1 Global Content Delivery Network (CDN) Market 2020 - 2024

Historic Market Size - Data Table on Global Content Delivery Network (CDN) Market 2020 - 2024 ($ million)

5.2 Solution segment analysis 2020 - 2024

Historic Market Size - Solution Segment 2020 - 2024 ($ million)

5.3 Type segment analysis 2020 - 2024

Historic Market Size - Type Segment 2020 - 2024 ($ million)

5.4 End-user segment analysis 2020 - 2024

Historic Market Size - End-user Segment 2020 - 2024 ($ million)

5.5 Geography segment analysis 2020 - 2024

Historic Market Size - Geography Segment 2020 - 2024 ($ million)

5.6 Country segment analysis 2020 - 2024

Historic Market Size - Country Segment 2020 - 2024 ($ million)

6. Qualitative Analysis

6.1 Impact of AI on Global Content Delivery Network (CDN) Market

6.2 Impact of Geopolitical Conflicts on Global Content Delivery Network (CDN) Market

7. Five Forces Analysis

7.1 Five forces summary

Five forces analysis - Comparison between 2025 and 2030

7.2 Bargaining power of buyers

Bargaining power of buyers - Impact of key factors 2025 and 2030

7.3 Bargaining power of suppliers

Bargaining power of suppliers - Impact of key factors in 2025 and 2030

7.4 Threat of new entrants

Threat of new entrants - Impact of key factors in 2025 and 2030

7.5 Threat of substitutes

Threat of substitutes - Impact of key factors in 2025 and 2030

7.6 Threat of rivalry

Threat of rivalry - Impact of key factors in 2025 and 2030

7.7 Market condition

Chart on Market condition - Five forces 2025 and 2030

8. Market Segmentation by Solution

8.1 Market segments

Chart on Solution - Market share 2025-2030 (%)
Data Table on Solution - Market share 2025-2030 (%)

8.2 Comparison by Solution

Chart on Comparison by Solution
Data Table on Comparison by Solution

8.3 WPO - Market size and forecast 2025-2030

Chart on WPO - Market size and forecast 2025-2030 ($ million)
Data Table on WPO - Market size and forecast 2025-2030 ($ million)
Chart on WPO - Year-over-year growth 2025-2030 (%)
Data Table on WPO - Year-over-year growth 2025-2030 (%)

8.4 Cloud security - Market size and forecast 2025-2030

Chart on Cloud security - Market size and forecast 2025-2030 ($ million)
Data Table on Cloud security - Market size and forecast 2025-2030 ($ million)
Chart on Cloud security - Year-over-year growth 2025-2030 (%)
Data Table on Cloud security - Year-over-year growth 2025-2030 (%)

8.5 Media delivery - Market size and forecast 2025-2030

Chart on Media delivery - Market size and forecast 2025-2030 ($ million)
Data Table on Media delivery - Market size and forecast 2025-2030 ($ million)
Chart on Media delivery - Year-over-year growth 2025-2030 (%)
Data Table on Media delivery - Year-over-year growth 2025-2030 (%)

8.6 Market opportunity by Solution

Market opportunity by Solution ($ million)
Data Table on Market opportunity by Solution ($ million)

9. Market Segmentation by Type

9.1 Market segments

Chart on Type - Market share 2025-2030 (%)
Data Table on Type - Market share 2025-2030 (%)

9.2 Comparison by Type

Chart on Comparison by Type
Data Table on Comparison by Type

9.3 Video CDNs - Market size and forecast 2025-2030

Chart on Video CDNs - Market size and forecast 2025-2030 ($ million)
Data Table on Video CDNs - Market size and forecast 2025-2030 ($ million)
Chart on Video CDNs - Year-over-year growth 2025-2030 (%)
Data Table on Video CDNs - Year-over-year growth 2025-2030 (%)

9.4 Non-video CDNs - Market size and forecast 2025-2030

Chart on Non-video CDNs - Market size and forecast 2025-2030 ($ million)
Data Table on Non-video CDNs - Market size and forecast 2025-2030 ($ million)
Chart on Non-video CDNs - Year-over-year growth 2025-2030 (%)
Data Table on Non-video CDNs - Year-over-year growth 2025-2030 (%)

9.5 Market opportunity by Type

Market opportunity by Type ($ million)
Data Table on Market opportunity by Type ($ million)

10. Market Segmentation by End-user

10.1 Market segments

Chart on End-user - Market share 2025-2030 (%)
Data Table on End-user - Market share 2025-2030 (%)

10.2 Comparison by End-user

Chart on Comparison by End-user
Data Table on Comparison by End-user

10.3 Media and entertainment - Market size and forecast 2025-2030

Chart on Media and entertainment - Market size and forecast 2025-2030 ($ million)
Data Table on Media and entertainment - Market size and forecast 2025-2030 ($ million)
Chart on Media and entertainment - Year-over-year growth 2025-2030 (%)
Data Table on Media and entertainment - Year-over-year growth 2025-2030 (%)

10.4 E-commerce and retail - Market size and forecast 2025-2030

Chart on E-commerce and retail - Market size and forecast 2025-2030 ($ million)
Data Table on E-commerce and retail - Market size and forecast 2025-2030 ($ million)
Chart on E-commerce and retail - Year-over-year growth 2025-2030 (%)
Data Table on E-commerce and retail - Year-over-year growth 2025-2030 (%)

10.5 Gaming - Market size and forecast 2025-2030

Chart on Gaming - Market size and forecast 2025-2030 ($ million)
Data Table on Gaming - Market size and forecast 2025-2030 ($ million)
Chart on Gaming - Year-over-year growth 2025-2030 (%)
Data Table on Gaming - Year-over-year growth 2025-2030 (%)

10.6 Others - Market size and forecast 2025-2030

Chart on Others - Market size and forecast 2025-2030 ($ million)
Data Table on Others - Market size and forecast 2025-2030 ($ million)
Chart on Others - Year-over-year growth 2025-2030 (%)
Data Table on Others - Year-over-year growth 2025-2030 (%)

10.7 Market opportunity by End-user

Market opportunity by End-user ($ million)
Data Table on Market opportunity by End-user ($ million)

11. Customer Landscape

11.1 Customer landscape overview

Analysis of price sensitivity, lifecycle, customer purchase basket, adoption rates, and purchase criteria

12. Geographic Landscape

12.1 Geographic segmentation

Chart on Market share by geography 2025-2030 (%)
Data Table on Market share by geography 2025-2030 (%)

12.2 Geographic comparison

Chart on Geographic comparison
Data Table on Geographic comparison

12.3 North America - Market size and forecast 2025-2030

Chart on North America - Market size and forecast 2025-2030 ($ million)
Data Table on North America - Market size and forecast 2025-2030 ($ million)
Chart on North America - Year-over-year growth 2025-2030 (%)
Data Table on North America - Year-over-year growth 2025-2030 (%)
Chart on Regional Comparison - North America
Data Table on Regional Comparison - North America

12.3.1 US - Market size and forecast 2025-2030

Chart on US - Market size and forecast 2025-2030 ($ million)
Data Table on US - Market size and forecast 2025-2030 ($ million)
Chart on US - Year-over-year growth 2025-2030 (%)
Data Table on US - Year-over-year growth 2025-2030 (%)

12.3.2 Canada - Market size and forecast 2025-2030

Chart on Canada - Market size and forecast 2025-2030 ($ million)
Data Table on Canada - Market size and forecast 2025-2030 ($ million)
Chart on Canada - Year-over-year growth 2025-2030 (%)
Data Table on Canada - Year-over-year growth 2025-2030 (%)

12.3.3 Mexico - Market size and forecast 2025-2030

Chart on Mexico - Market size and forecast 2025-2030 ($ million)
Data Table on Mexico - Market size and forecast 2025-2030 ($ million)
Chart on Mexico - Year-over-year growth 2025-2030 (%)
Data Table on Mexico - Year-over-year growth 2025-2030 (%)

12.4 Europe - Market size and forecast 2025-2030

Chart on Europe - Market size and forecast 2025-2030 ($ million)
Data Table on Europe - Market size and forecast 2025-2030 ($ million)
Chart on Europe - Year-over-year growth 2025-2030 (%)
Data Table on Europe - Year-over-year growth 2025-2030 (%)
Chart on Regional Comparison - Europe
Data Table on Regional Comparison - Europe

12.4.1 UK - Market size and forecast 2025-2030

Chart on UK - Market size and forecast 2025-2030 ($ million)
Data Table on UK - Market size and forecast 2025-2030 ($ million)
Chart on UK - Year-over-year growth 2025-2030 (%)
Data Table on UK - Year-over-year growth 2025-2030 (%)

12.4.2 Germany - Market size and forecast 2025-2030

Chart on Germany - Market size and forecast 2025-2030 ($ million)
Data Table on Germany - Market size and forecast 2025-2030 ($ million)
Chart on Germany - Year-over-year growth 2025-2030 (%)
Data Table on Germany - Year-over-year growth 2025-2030 (%)

12.4.3 France - Market size and forecast 2025-2030

Chart on France - Market size and forecast 2025-2030 ($ million)
Data Table on France - Market size and forecast 2025-2030 ($ million)
Chart on France - Year-over-year growth 2025-2030 (%)
Data Table on France - Year-over-year growth 2025-2030 (%)

12.4.4 The Netherlands - Market size and forecast 2025-2030

Chart on The Netherlands - Market size and forecast 2025-2030 ($ million)
Data Table on The Netherlands - Market size and forecast 2025-2030 ($ million)
Chart on The Netherlands - Year-over-year growth 2025-2030 (%)
Data Table on The Netherlands - Year-over-year growth 2025-2030 (%)

12.4.5 Italy - Market size and forecast 2025-2030

Chart on Italy - Market size and forecast 2025-2030 ($ million)
Data Table on Italy - Market size and forecast 2025-2030 ($ million)
Chart on Italy - Year-over-year growth 2025-2030 (%)
Data Table on Italy - Year-over-year growth 2025-2030 (%)

12.4.6 Spain - Market size and forecast 2025-2030

Chart on Spain - Market size and forecast 2025-2030 ($ million)
Data Table on Spain - Market size and forecast 2025-2030 ($ million)
Chart on Spain - Year-over-year growth 2025-2030 (%)
Data Table on Spain - Year-over-year growth 2025-2030 (%)

12.5 APAC - Market size and forecast 2025-2030

Chart on APAC - Market size and forecast 2025-2030 ($ million)
Data Table on APAC - Market size and forecast 2025-2030 ($ million)
Chart on APAC - Year-over-year growth 2025-2030 (%)
Data Table on APAC - Year-over-year growth 2025-2030 (%)
Chart on Regional Comparison - APAC
Data Table on Regional Comparison - APAC

12.5.1 China - Market size and forecast 2025-2030

Chart on China - Market size and forecast 2025-2030 ($ million)
Data Table on China - Market size and forecast 2025-2030 ($ million)
Chart on China - Year-over-year growth 2025-2030 (%)
Data Table on China - Year-over-year growth 2025-2030 (%)

12.5.2 Japan - Market size and forecast 2025-2030

Chart on Japan - Market size and forecast 2025-2030 ($ million)
Data Table on Japan - Market size and forecast 2025-2030 ($ million)
Chart on Japan - Year-over-year growth 2025-2030 (%)
Data Table on Japan - Year-over-year growth 2025-2030 (%)

12.5.3 India - Market size and forecast 2025-2030

Chart on India - Market size and forecast 2025-2030 ($ million)
Data Table on India - Market size and forecast 2025-2030 ($ million)
Chart on India - Year-over-year growth 2025-2030 (%)
Data Table on India - Year-over-year growth 2025-2030 (%)

12.5.4 Australia - Market size and forecast 2025-2030

Chart on Australia - Market size and forecast 2025-2030 ($ million)
Data Table on Australia - Market size and forecast 2025-2030 ($ million)
Chart on Australia - Year-over-year growth 2025-2030 (%)
Data Table on Australia - Year-over-year growth 2025-2030 (%)

12.5.5 South Korea - Market size and forecast 2025-2030

Chart on South Korea - Market size and forecast 2025-2030 ($ million)
Data Table on South Korea - Market size and forecast 2025-2030 ($ million)
Chart on South Korea - Year-over-year growth 2025-2030 (%)
Data Table on South Korea - Year-over-year growth 2025-2030 (%)

12.5.6 Singapore - Market size and forecast 2025-2030

Chart on Singapore - Market size and forecast 2025-2030 ($ million)
Data Table on Singapore - Market size and forecast 2025-2030 ($ million)
Chart on Singapore - Year-over-year growth 2025-2030 (%)
Data Table on Singapore - Year-over-year growth 2025-2030 (%)

12.6 South America - Market size and forecast 2025-2030

Chart on South America - Market size and forecast 2025-2030 ($ million)
Data Table on South America - Market size and forecast 2025-2030 ($ million)
Chart on South America - Year-over-year growth 2025-2030 (%)
Data Table on South America - Year-over-year growth 2025-2030 (%)
Chart on Regional Comparison - South America
Data Table on Regional Comparison - South America

12.6.1 Brazil - Market size and forecast 2025-2030

Chart on Brazil - Market size and forecast 2025-2030 ($ million)
Data Table on Brazil - Market size and forecast 2025-2030 ($ million)
Chart on Brazil - Year-over-year growth 2025-2030 (%)
Data Table on Brazil - Year-over-year growth 2025-2030 (%)

12.6.2 Argentina - Market size and forecast 2025-2030

Chart on Argentina - Market size and forecast 2025-2030 ($ million)
Data Table on Argentina - Market size and forecast 2025-2030 ($ million)
Chart on Argentina - Year-over-year growth 2025-2030 (%)
Data Table on Argentina - Year-over-year growth 2025-2030 (%)

12.6.3 Chile - Market size and forecast 2025-2030

Chart on Chile - Market size and forecast 2025-2030 ($ million)
Data Table on Chile - Market size and forecast 2025-2030 ($ million)
Chart on Chile - Year-over-year growth 2025-2030 (%)
Data Table on Chile - Year-over-year growth 2025-2030 (%)

12.7 Middle East and Africa - Market size and forecast 2025-2030

Chart on Middle East and Africa - Market size and forecast 2025-2030 ($ million)
Data Table on Middle East and Africa - Market size and forecast 2025-2030 ($ million)
Chart on Middle East and Africa - Year-over-year growth 2025-2030 (%)
Data Table on Middle East and Africa - Year-over-year growth 2025-2030 (%)
Chart on Regional Comparison - Middle East and Africa
Data Table on Regional Comparison - Middle East and Africa

12.7.1 Saudi Arabia - Market size and forecast 2025-2030

Chart on Saudi Arabia - Market size and forecast 2025-2030 ($ million)
Data Table on Saudi Arabia - Market size and forecast 2025-2030 ($ million)
Chart on Saudi Arabia - Year-over-year growth 2025-2030 (%)
Data Table on Saudi Arabia - Year-over-year growth 2025-2030 (%)

12.7.2 UAE - Market size and forecast 2025-2030

Chart on UAE - Market size and forecast 2025-2030 ($ million)
Data Table on UAE - Market size and forecast 2025-2030 ($ million)
Chart on UAE - Year-over-year growth 2025-2030 (%)
Data Table on UAE - Year-over-year growth 2025-2030 (%)

12.7.3 South Africa - Market size and forecast 2025-2030

Chart on South Africa - Market size and forecast 2025-2030 ($ million)
Data Table on South Africa - Market size and forecast 2025-2030 ($ million)
Chart on South Africa - Year-over-year growth 2025-2030 (%)
Data Table on South Africa - Year-over-year growth 2025-2030 (%)

12.7.4 Israel - Market size and forecast 2025-2030

Chart on Israel - Market size and forecast 2025-2030 ($ million)
Data Table on Israel - Market size and forecast 2025-2030 ($ million)
Chart on Israel - Year-over-year growth 2025-2030 (%)
Data Table on Israel - Year-over-year growth 2025-2030 (%)

12.7.5 Turkey - Market size and forecast 2025-2030

Chart on Turkey - Market size and forecast 2025-2030 ($ million)
Data Table on Turkey - Market size and forecast 2025-2030 ($ million)
Chart on Turkey - Year-over-year growth 2025-2030 (%)
Data Table on Turkey - Year-over-year growth 2025-2030 (%)

12.8 Market opportunity by geography

Market opportunity by geography ($ million)
Data Tables on Market opportunity by geography ($ million)

13. Drivers, Challenges, and Opportunity

13.1 Market drivers

Explosion in rich media consumption and live streaming
Proliferation of e-commerce and online gaming
Convergence with edge computing and cloud security

13.2 Market challenges

Escalating complexity and operational costs
Intensifying competition and price commoditization
Managing security and compliance at scale

13.3 Impact of drivers and challenges

Impact of drivers and challenges in 2025 and 2030

13.4 Market opportunities

Evolution toward programmable edge
Deep integration of AI and machine learning
Adoption of multi-CDN and hybrid-cloud architectures

14. Competitive Landscape

14.1 Overview

14.2

Overview on criticality of inputs and factors of differentiation

14.3 Landscape disruption

Overview on factors of disruption

14.4 Industry risks

Impact of key risks on business

15. Competitive Analysis

15.1 Companies profiled

Companies covered

15.2 Company ranking index

15.3 Market positioning of companies

Matrix on companies position and classification

15.4 Akamai Technologies Inc.

Akamai Technologies Inc. - Overview
Akamai Technologies Inc. - Business segments
Akamai Technologies Inc. - Key news
Akamai Technologies Inc. - Key offerings
Akamai Technologies Inc. - Segment focus
SWOT

15.5 Alibaba Cloud

Alibaba Cloud - Overview
Alibaba Cloud - Product / Service
Alibaba Cloud - Key offerings
SWOT

15.6 Amazon Web Services Inc.

Amazon Web Services Inc. - Overview
Amazon Web Services Inc. - Product / Service
Amazon Web Services Inc. - Key offerings
SWOT

15.7 AT and T Inc.

AT and T Inc. - Overview
AT and T Inc. - Business segments
AT and T Inc. - Key offerings
AT and T Inc. - Segment focus
SWOT

15.8 Cloudflare Inc.

Cloudflare Inc. - Overview
Cloudflare Inc. - Product / Service
Cloudflare Inc. - Key offerings
SWOT

15.9 Deutsche Telekom AG

Deutsche Telekom AG - Overview
Deutsche Telekom AG - Business segments
Deutsche Telekom AG - Key offerings
Deutsche Telekom AG - Segment focus
SWOT

15.10 Google LLC

Google LLC - Overview
Google LLC - Product / Service
Google LLC - Key news
Google LLC - Key offerings
SWOT

15.11 Huawei Cloud Computing Co Ltd

Huawei Cloud Computing Co Ltd - Overview
Huawei Cloud Computing Co Ltd - Product / Service
Huawei Cloud Computing Co Ltd - Key offerings
SWOT

15.12 IBM Corp.

IBM Corp. - Overview
IBM Corp. - Business segments
IBM Corp. - Key news
IBM Corp. - Key offerings
IBM Corp. - Segment focus
SWOT

15.13 Microsoft Corp.

Microsoft Corp. - Overview
Microsoft Corp. - Business segments
Microsoft Corp. - Key news
Microsoft Corp. - Key offerings
Microsoft Corp. - Segment focus
SWOT

15.14 Nippon Telegraph and Corp.

Nippon Telegraph and Corp. - Overview
Nippon Telegraph and Corp. - Business segments
Nippon Telegraph and Corp. - Key offerings
Nippon Telegraph and Corp. - Segment focus
SWOT

15.15 Orange SA

Orange SA - Overview
Orange SA - Business segments
Orange SA - Key offerings
Orange SA - Segment focus
SWOT

15.16 Rackspace Technology Inc.

Rackspace Technology Inc. - Overview
Rackspace Technology Inc. - Business segments
Rackspace Technology Inc. - Key offerings
Rackspace Technology Inc. - Segment focus
SWOT

15.17 Tata Communications Ltd.

Tata Communications Ltd. - Overview
Tata Communications Ltd. - Business segments
Tata Communications Ltd. - Key offerings
Tata Communications Ltd. - Segment focus
SWOT

15.18 Tencent Holdings Ltd.

Tencent Holdings Ltd. - Overview
Tencent Holdings Ltd. - Business segments
Tencent Holdings Ltd. - Key offerings
Tencent Holdings Ltd. - Segment focus
SWOT

16. Appendix

16.1 Scope of the report

Market definition
Objectives
Notes and caveats

16.2 Inclusions and exclusions checklist

Inclusions checklist
Exclusions checklist

16.3 Currency conversion rates for US$

16.4 Research methodology

16.5 Data procurement

Information sources

16.6 Data validation

16.7 Validation techniques employed for market sizing

16.8 Data synthesis

16.9 360 degree market analysis

16.10 List of abbreviations

Research Methodology

Technavio presents a detailed picture of the market by way of study, synthesis, and summation of data from multiple sources. The analysts have presented the various facets of the market with a particular focus on identifying the key industry influencers. The data thus presented is comprehensive, reliable, and the result of extensive research, both primary and secondary.

INFORMATION SOURCES

Primary sources

  • Manufacturers and suppliers
  • Channel partners
  • Industry experts
  • Strategic decision makers

Secondary sources

  • Industry journals and periodicals
  • Government data
  • Financial reports of key industry players
  • Historical data
  • Press releases

DATA ANALYSIS

Data Synthesis

  • Collation of data
  • Estimation of key figures
  • Analysis of derived insights

Data Validation

  • Triangulation with data models
  • Reference against proprietary databases
  • Corroboration with industry experts

REPORT WRITING

Qualitative

  • Market drivers
  • Market challenges
  • Market trends
  • Five forces analysis

Quantitative

  • Market size and forecast
  • Market segmentation
  • Geographical insights
  • Competitive landscape

Interested in this report?

Get your sample now to see our research methodology and insights!

Download Now

Frequently Asked Questions

Content Delivery Network (Cdn) market growth will increase by USD 20961.4 million during 2026-2030.

The Content Delivery Network (Cdn) market is expected to grow at a CAGR of 11% during 2026-2030.

Content Delivery Network (Cdn) market is segmented by Solution (WPO, Cloud security, Media delivery) Type (Video CDNs, Non-video CDNs) End-user (Media and entertainment, E-commerce and retail, Gaming, Others)

Akamai Technologies Inc., Alibaba Cloud, Amazon Web Services Inc., AT and T Inc., Cloudflare Inc., Deutsche Telekom AG, Fastly Inc., Gcore, Google LLC, Huawei Cloud Computing Co Ltd, IBM Corp., Imperva Inc., Lumen Technologies Inc., Microsoft Corp., Nippon Telegraph and Corp., Orange SA, Rackspace Technology Inc., Tata Communications Ltd., Tencent Holdings Ltd., Wangsu Science and Technology are a few of the key vendors in the Content Delivery Network (Cdn) market.

North America will register the highest growth rate of 33.1% among the other regions. Therefore, the Content Delivery Network (Cdn) market in North America is expected to garner significant business opportunities for the vendors during the forecast period.

US, Canada, Mexico, UK, Germany, France, The Netherlands, Italy, Spain, China, Japan, India, Australia, South Korea, Singapore, Brazil, Argentina, Chile, Saudi Arabia, UAE, South Africa, Israel, Turkey

  • Explosion in rich media consumption and live streaming is the driving factor this market.

The Content Delivery Network (Cdn) market vendors should focus on grabbing business opportunities from the Solution segment as it accounted for the largest market share in the base year.
RIA - Research AI Assistant
Ask RIA