Web Performance Market Analysis North America, Europe, APAC, Middle East and Africa, South America - US, Germany, China, UK, Canada - Size and Forecast 2024-2028

Web Performance Market Analysis North America, Europe, APAC, Middle East and Africa, South America - US, Germany, China, UK, Canada - Size and Forecast 2024-2028

Published: Jul 2024 140 Pages SKU: IRTNTR73261

Market Overview at a Glance

$2.80 B
Market Opportunity
8.12%
CAGR
7.51
YoY growth 2023-2024(%)

Web Performance Market Size 2024-2028 

The web performance market size is forecast to increase by USD 2.8 billion, at a CAGR of 8.12% between 2023 and 2028. The market is experiencing significant growth, driven by the increasing use of advanced web technologies and the expanding Internet user base. Key trends include the demand for mobile web performance solutions due to the rise in mobile internet usage, as well as the integration of security services such as Web Application Firewall as a Service (WAFaaS) and multi-factor authentication to enhance security. Sectors like media and entertainment, healthcare, transportation, logistics and manufacturing are major contributors to the market's growth, as they rely heavily on web applications for business operations. However, high deployment costs and the increasing number of cyber attacks pose challenges to market growth. The need for faster web performance and security measures is becoming crucial for businesses to maintain a competitive edge and provide a seamless user experience.

Market Analysis

Web Performance Market Size

 Request Free Sample

The market is experiencing significant growth due to the increasing reliance on the Internet for business operations and consumer engagement. The e-commerce industry, in particular, is driving the demand for improved web performance as online sales continue to stream. Content Delivery Networks (CDNs) play a crucial role in delivering content quickly and efficiently, especially for large media files such as images. IT and telecom sectors are also investing heavily in web performance to enhance user experience. E-commerce sites, media and entertainment, healthcare, logistics and transportation, and the SME sector are some of the key industries leveraging web performance technologies.

Moreover, mobile devices have further complicated the digital landscape, necessitating optimization for various screen sizes and mobile-specific protocols like Transmission Control Protocol (TCP) and Hypertext Transfer Protocol (HTTP). Search engine optimization, user experience, and privacy laws are critical factors influencing web performance. Tools like SolarWinds and AppDynamics help monitor and optimize web performance, while Hypertext Markup Language (HTML) and HTTP/2 enable faster content delivery. Mobile penetration continues to rise, making it essential for businesses to prioritize web performance to cater to the growing mobile user base.

Market Segmentation

The market research report provides comprehensive data (region-wise segment analysis), with forecasts and estimates in "USD billion" for the period 2024-2028, as well as historical data from 2018-2022 for the following segments.

  • Deployment
    • On premise
    • Cloud
  • Geography
    • North America
      • Canada
      • US
    • Europe
      • Germany
      • UK
    • APAC
      • China
    • Middle East and Africa
    • South America

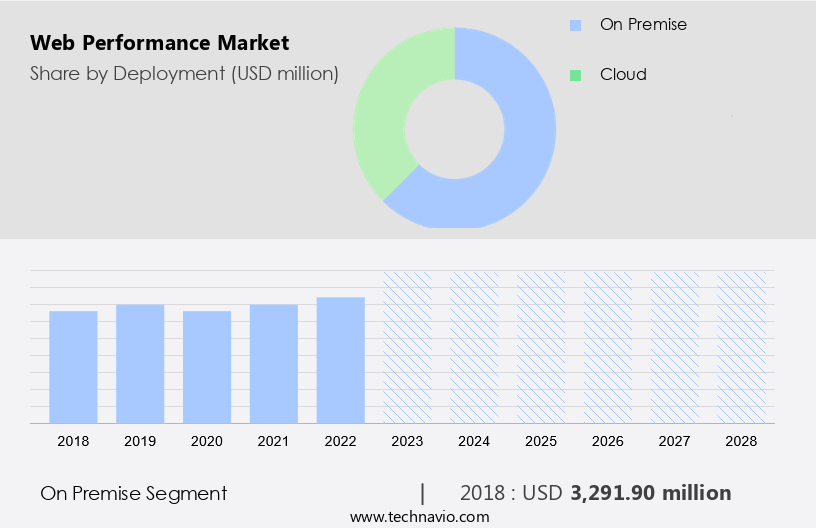
By Deployment Insights

The on premise segment is estimated to witness significant growth during the forecast period. The market witnessed significant growth in 2023, with on-premises solutions holding the largest market share. This model necessitates substantial investments for product purchases, installation, maintenance, and upgrades. Additionally, organizations must hire and train an in-house IT workforce to support users, which can be costly for small and medium-sized enterprises (SMEs). Despite the expense, large enterprises, primarily those dealing with sensitive data, prefer the on-premises model due to its enhanced security features. This model ensures end-to-end quality control and eliminates third-party involvement, making it a popular choice for organizations concerned with data security. In the dynamic digital landscape of the e-commerce industry, web performance solutions, such as those offered by SEMrush and application delivery controllers, play a crucial role in ensuring optimal website performance on both desktop and mobile devices.

Security breaches can lead to significant financial losses and reputational damage, making the need for reliable web performance solutions more pressing than ever.

Web Performance Market Size

Get a glance at the market share of various segments Request Free Sample

The on-premise segment was valued at USD 3.29 billion in 2018 and showed a gradual increase during the forecast period.

Regional Insights

North America is estimated to contribute 39% to the growth of the global market during the forecast period. Technavio's analysts have elaborately explained the regional trends and drivers that shape the market during the forecast period.

Web Performance Market Share by Geography

For more insights on the market share of various regions Request Free Sample

In the dynamic digital landscape of North America, particularly in the US, the e-commerce industry is experiencing significant growth. This expansion is driven by several factors, including the increasing number of cybersecurity breaches and the transition from traditional IT systems to cloud-based services. As more businesses move online and rely on web applications, the need for reliable web performance solutions becomes increasingly crucial. Application delivery controllers (ADCs) from companies like SEMrush are essential components in ensuring optimal web performance and security. The growing number of IT firms and start-ups in the region is also fueling the demand for these solutions.

Moreover, government initiatives and regulations on cybersecurity are further expected to boost market growth in the future. The use of mobile devices for online shopping and browsing is another significant trend, making web performance solutions an indispensable part of the digital ecosystem.

Market Dynamics

Our researchers analyzed the data with 2023 as the base year, along with the key drivers, trends, and challenges. A holistic analysis of drivers will help companies refine their marketing strategies to gain a competitive advantage.

Market Driver

The rising number of cyber attacks is the key driver of the market. The e-commerce industry and IT and telecom sectors are increasingly relying on content delivery networks (CDNs) to ensure optimal web performance and deliver high-quality user experiences. With the proliferation of images and rich media content, the need for efficient content delivery has become more critical than ever. According to recent studies, the use of CDNs can significantly improve website loading times and enhance user engagement.

Further, SolarWinds and appdynamics are among the leading providers of web performance solutions, offering real-time performance monitoring and analytics. TotalRetail and Google Lighthouse Score are other notable tools that help businesses assess and improve their website performance. As cybersecurity threats continue to evolve, SMEs must prioritize web performance to safeguard their digital assets and maintain customer trust.

Market Trends

Demand for mobile web performance solutions is the upcoming trend in the market. In today's digital age, the growing number of mobile Internet users necessitates swift and efficient web performance. With the expansion of various networks such as 5G, LTE, 3G, and 2G, more individuals can access the web at affordable costs. This trend is particularly significant in the E-Commerce Industry, where quick loading times are essential for customer satisfaction. Content Delivery Networks (CDNs) have emerged as a popular solution for enhancing web performance. These networks distribute content to users from servers located in their geographic regions, reducing latency and improving load times. SolarWinds, AppDynamics, and Google Lighthouse Score are among the tools used by IT and Telecom companies and SMEs to assess web performance and optimize their online presence.

Moreover, the total retail and other industry reports indicate that web performance significantly impacts user experience and sales conversions. As a result, businesses are investing in web performance solutions to meet the increasing demands of mobile users. For instance, Google's Lighthouse Score is a free tool that provides valuable insights into web performance and suggests improvements. By focusing on web performance, companies can deliver a seamless user experience and maintain a competitive edge in the market.

Market Challenge

High deployment costs is a key challenge affecting the market growth. The E-Commerce Industry and IT and Telecom sectors are increasingly relying on content delivery networks (CDNs) to enhance web performance and provide faster load times for images and other media. However, the adoption of CDNs and other web performance solutions comes with significant expenses. The total cost of implementation includes software licensing fees, system design and customization, training, and ongoing maintenance. Hiring dedicated IT personnel to manage the solution adds to the financial burden.

Moreover, understanding the intricacies of web performance solutions necessitates continuous learning and skill development, resulting in additional, often hidden, costs. Companies, particularly SMEs, may find it challenging to absorb these expenses. Tools like SolarWinds, AppDynamics, TotalRetail, and Google Lighthouse Score can help optimize web performance, but their integration and usage require expertise and resources.

Exclusive Customer Landscape

The market forecasting report includes the adoption lifecycle of the market, covering from the innovator's stage to the laggard's stage. It focuses on adoption rates in different regions based on penetration. Furthermore, the report also includes key purchase criteria and drivers of price sensitivity to help companies evaluate and develop their market growth analysis strategies.

Web Performance Market Share by Geography

 Customer Landscape

Key Companies & Market Insights

Companies are implementing various strategies, such as strategic alliances, partnerships, mergers and acquisitions, geographical expansion, and product/service launches, to enhance their presence in the market.

Akamai Technologies Inc. - The company offers web performance solutions to boost performance and UX by enabling developers to build web applications closer to end-users. 

The market research and growth report includes detailed analyses of the competitive landscape of the market and information about key companies, including:

  • AT and T Inc.
  • Broadcom Inc.
  • Cavisson Systems Inc.
  • CDNetworks Inc.
  • Cisco Systems Inc.
  • Cloudflare Inc.
  • DigitalOcean Holdings Inc.
  • DreamHost LLC
  • Dynatrace Inc.
  • Equinix Inc.
  • F5 Inc.
  • International Business Machines Corp.
  • New Relic Inc.
  • Nippon Telegraph and Telephone Corp.
  • Open Text Corporation
  • Radware Ltd.
  • SolarWinds Corp.
  • TransUnion
  • WPEngine Inc.

Qualitative and quantitative analysis of companies has been conducted to help clients understand the wider business environment as well as the strengths and weaknesses of key market players. Data is qualitatively analyzed to categorize companies as pure play, category-focused, industry-focused, and diversified; it is quantitatively analyzed to categorize companies as dominant, leading, strong, tentative, and weak.

Research Analyst Overview

In today's digital landscape, web performance plays a crucial role in the success of businesses, particularly in the e-commerce industry. With the increasing usage of mobile devices and the internet, delivering high-quality, fast, and secure digital experiences is essential for customer engagement, conversion rates, and online presence. Web performance solutions, such as Content Delivery Networks (CDNs), Application Delivery Controllers (ADCs), and edge cloud platforms, have emerged as essential components of the digital infrastructure. CDNs help improve website performance by caching and delivering content from servers located closer to end-users, reducing latency and enhancing user experience. In the e-commerce sector, this translates into faster loading times for product images and web pages, leading to increased customer satisfaction and sales.

Moreover, web performance is also critical for industries like media and entertainment, healthcare, logistics and transportation, manufacturing, and IT and telecom. Security breaches and cyber threats pose significant risks, necessitating solutions that ensure data integrity and privacy, such as multi-factor authentication and WAFaaS. Web technologies, like Transmission Control Protocol (TCP), Hypertext Transfer Protocol (HTTP), and Hypertext Markup Language (HTML), also play a role in web performance. The e-commerce industry, in particular, benefits from optimizing Google Lighthouse score, Semrush analysis, and industry benchmarks to improve user experience and search engine rankings. Moreover, the digital landscape is evolving, with cloud deployment models like community and public cloud and on-premises solutions offering businesses flexibility and scalability. Internet usage and mobile penetration continue to grow, making web performance a top priority for businesses across industries.

Market Scope

Report Coverage

Details

Page number

140

Base year

2023

Historic period

2018-2022

Forecast period

2024-2028

Growth momentum & CAGR

Accelerate at a CAGR of 8.12%

Market Growth 2024-2028

USD 2.80 billion

Market structure

Fragmented

YoY growth 2023-2024(%)

7.51

Regional analysis

North America, Europe, APAC, Middle East and Africa, and South America

Performing market contribution

North America at 39%

Key countries

US, Germany, China, UK, and Canada

Competitive landscape

Leading Companies, Market Positioning of Companies, Competitive Strategies, and Industry Risks

Key companies profiled

Akamai Technologies Inc., AT and T Inc., Broadcom Inc., Cavisson Systems Inc., CDNetworks Inc., Cisco Systems Inc., Cloudflare Inc., DigitalOcean Holdings Inc., DreamHost LLC, Dynatrace Inc., Equinix Inc., F5 Inc., International Business Machines Corp., New Relic Inc., Nippon Telegraph and Telephone Corp., Open Text Corporation, Radware Ltd., SolarWinds Corp., TransUnion, and WPEngine Inc.

Market dynamics

Parent market analysis, market growth inducers and obstacles, market forecast, fast-growing and slow-growing segment analysis, COVID-19 impact and recovery analysis and future consumer dynamics, market condition analysis for the forecast period

Customization purview

If our market report has not included the data that you are looking for, you can reach out to our analysts and get segments customized.

Request Free Sample

What are the Key Data Covered in this Market Research and Growth Report?

  • CAGR of the market during the forecast period
  • Detailed information on factors that will drive the market growth and forecasting between 2024 and 2028
  • Precise estimation of the size of the market  and its contribution of the market in focus to the parent market
  • Accurate predictions about upcoming market growth and trends and changes in consumer behaviour
  • Growth of the market across North America, Europe, APAC, Middle East and Africa, and South America
  • Thorough analysis of the market's competitive landscape and detailed information about companies
  • Comprehensive analysis of factors that will challenge the growth of market companies

We can help! Our analysts can customize this market research report to meet your requirements. Get in touch

1 Executive Summary

  • 1.1 Market overview
    • Executive Summary - Chart on Market Overview
    • Executive Summary - Data Table on Market Overview
    • Executive Summary - Chart on Global Market Characteristics
    • Executive Summary - Chart on Market by Geography
    • Executive Summary - Chart on Market Segmentation by Deployment
    • Executive Summary - Chart on Incremental Growth
    • Executive Summary - Data Table on Incremental Growth
    • Executive Summary - Chart on Company Market Positioning

2 Market Landscape

  • 2.1 Market ecosystem
    • Parent Market
    • Data Table on - Parent Market
  • 2.2 Market characteristics
    • Market characteristics analysis
  • 2.3 Value chain analysis
    • Value Chain Analysis

3 Market Sizing

  • 3.1 Market definition
    • Offerings of companies included in the market definition
  • 3.2 Market segment analysis
    • Market segments
  • 3.3 Market size 2023
    • 3.4 Market outlook: Forecast for 2023-2028
      • Chart on Global - Market size and forecast 2023-2028 ($ million)
      • Data Table on Global - Market size and forecast 2023-2028 ($ million)
      • Chart on Global Market: Year-over-year growth 2023-2028 (%)
      • Data Table on Global Market: Year-over-year growth 2023-2028 (%)

    4 Historic Market Size

    • 4.1 Global Web Performance Market 2018 - 2022
      • Historic Market Size - Data Table on Global Web Performance Market 2018 - 2022 ($ million)
    • 4.2 Deployment segment analysis 2018 - 2022
      • Historic Market Size - Deployment Segment 2018 - 2022 ($ million)
    • 4.3 Geography segment analysis 2018 - 2022
      • Historic Market Size - Geography Segment 2018 - 2022 ($ million)
    • 4.4 Country segment analysis 2018 - 2022
      • Historic Market Size - Country Segment 2018 - 2022 ($ million)

    5 Five Forces Analysis

    • 5.1 Five forces summary
      • Five forces analysis - Comparison between 2023 and 2028
    • 5.2 Bargaining power of buyers
      • Bargaining power of buyers - Impact of key factors 2023 and 2028
    • 5.3 Bargaining power of suppliers
      • Bargaining power of suppliers - Impact of key factors in 2023 and 2028
    • 5.4 Threat of new entrants
      • Threat of new entrants - Impact of key factors in 2023 and 2028
    • 5.5 Threat of substitutes
      • Threat of substitutes - Impact of key factors in 2023 and 2028
    • 5.6 Threat of rivalry
      • Threat of rivalry - Impact of key factors in 2023 and 2028
    • 5.7 Market condition
      • Chart on Market condition - Five forces 2023 and 2028

    6 Market Segmentation by Deployment

    • 6.1 Market segments
      • Chart on Deployment - Market share 2023-2028 (%)
      • Data Table on Deployment - Market share 2023-2028 (%)
    • 6.2 Comparison by Deployment
      • Chart on Comparison by Deployment
      • Data Table on Comparison by Deployment
    • 6.3 On-premises - Market size and forecast 2023-2028
      • Chart on On-premises - Market size and forecast 2023-2028 ($ million)
      • Data Table on On-premises - Market size and forecast 2023-2028 ($ million)
      • Chart on On-premises - Year-over-year growth 2023-2028 (%)
      • Data Table on On-premises - Year-over-year growth 2023-2028 (%)
    • 6.4 Cloud - Market size and forecast 2023-2028
      • Chart on Cloud - Market size and forecast 2023-2028 ($ million)
      • Data Table on Cloud - Market size and forecast 2023-2028 ($ million)
      • Chart on Cloud - Year-over-year growth 2023-2028 (%)
      • Data Table on Cloud - Year-over-year growth 2023-2028 (%)
    • 6.5 Market opportunity by Deployment
      • Market opportunity by Deployment ($ million)
      • Data Table on Market opportunity by Deployment ($ million)

    7 Customer Landscape

    • 7.1 Customer landscape overview
      • Analysis of price sensitivity, lifecycle, customer purchase basket, adoption rates, and purchase criteria

    8 Geographic Landscape

    • 8.1 Geographic segmentation
      • Chart on Market share by geography 2023-2028 (%)
      • Data Table on Market share by geography 2023-2028 (%)
    • 8.2 Geographic comparison
      • Chart on Geographic comparison
      • Data Table on Geographic comparison
    • 8.3 North America - Market size and forecast 2023-2028
      • Chart on North America - Market size and forecast 2023-2028 ($ million)
      • Data Table on North America - Market size and forecast 2023-2028 ($ million)
      • Chart on North America - Year-over-year growth 2023-2028 (%)
      • Data Table on North America - Year-over-year growth 2023-2028 (%)
    • 8.4 Europe - Market size and forecast 2023-2028
      • Chart on Europe - Market size and forecast 2023-2028 ($ million)
      • Data Table on Europe - Market size and forecast 2023-2028 ($ million)
      • Chart on Europe - Year-over-year growth 2023-2028 (%)
      • Data Table on Europe - Year-over-year growth 2023-2028 (%)
    • 8.5 APAC - Market size and forecast 2023-2028
      • Chart on APAC - Market size and forecast 2023-2028 ($ million)
      • Data Table on APAC - Market size and forecast 2023-2028 ($ million)
      • Chart on APAC - Year-over-year growth 2023-2028 (%)
      • Data Table on APAC - Year-over-year growth 2023-2028 (%)
    • 8.6 Middle East and Africa - Market size and forecast 2023-2028
      • Chart on Middle East and Africa - Market size and forecast 2023-2028 ($ million)
      • Data Table on Middle East and Africa - Market size and forecast 2023-2028 ($ million)
      • Chart on Middle East and Africa - Year-over-year growth 2023-2028 (%)
      • Data Table on Middle East and Africa - Year-over-year growth 2023-2028 (%)
    • 8.7 South America - Market size and forecast 2023-2028
      • Chart on South America - Market size and forecast 2023-2028 ($ million)
      • Data Table on South America - Market size and forecast 2023-2028 ($ million)
      • Chart on South America - Year-over-year growth 2023-2028 (%)
      • Data Table on South America - Year-over-year growth 2023-2028 (%)
    • 8.8 US - Market size and forecast 2023-2028
      • Chart on US - Market size and forecast 2023-2028 ($ million)
      • Data Table on US - Market size and forecast 2023-2028 ($ million)
      • Chart on US - Year-over-year growth 2023-2028 (%)
      • Data Table on US - Year-over-year growth 2023-2028 (%)
    • 8.9 Germany - Market size and forecast 2023-2028
      • Chart on Germany - Market size and forecast 2023-2028 ($ million)
      • Data Table on Germany - Market size and forecast 2023-2028 ($ million)
      • Chart on Germany - Year-over-year growth 2023-2028 (%)
      • Data Table on Germany - Year-over-year growth 2023-2028 (%)
    • 8.10 China - Market size and forecast 2023-2028
      • Chart on China - Market size and forecast 2023-2028 ($ million)
      • Data Table on China - Market size and forecast 2023-2028 ($ million)
      • Chart on China - Year-over-year growth 2023-2028 (%)
      • Data Table on China - Year-over-year growth 2023-2028 (%)
    • 8.11 UK - Market size and forecast 2023-2028
      • Chart on UK - Market size and forecast 2023-2028 ($ million)
      • Data Table on UK - Market size and forecast 2023-2028 ($ million)
      • Chart on UK - Year-over-year growth 2023-2028 (%)
      • Data Table on UK - Year-over-year growth 2023-2028 (%)
    • 8.12 Canada - Market size and forecast 2023-2028
      • Chart on Canada - Market size and forecast 2023-2028 ($ million)
      • Data Table on Canada - Market size and forecast 2023-2028 ($ million)
      • Chart on Canada - Year-over-year growth 2023-2028 (%)
      • Data Table on Canada - Year-over-year growth 2023-2028 (%)
    • 8.13 Market opportunity by geography
      • Market opportunity by geography ($ million)
      • Data Tables on Market opportunity by geography ($ million)

    9 Drivers, Challenges, and Opportunity/Restraints

    • 9.1 Market drivers
      • 9.2 Market challenges
        • 9.3 Impact of drivers and challenges
          • Impact of drivers and challenges in 2023 and 2028
        • 9.4 Market opportunities/restraints

          10 Competitive Landscape

          • 10.1 Overview
            • 10.2 Competitive Landscape
              • Overview on criticality of inputs and factors of differentiation
            • 10.3 Landscape disruption
              • Overview on factors of disruption
            • 10.4 Industry risks
              • Impact of key risks on business

            11 Competitive Analysis

            • 11.1 Companies profiled
              • Companies covered
            • 11.2 Market positioning of companies
              • Matrix on companies position and classification
            • 11.3 Akamai Technologies Inc.
              • Akamai Technologies Inc. - Overview
              • Akamai Technologies Inc. - Business segments
              • Akamai Technologies Inc. - Key news
              • Akamai Technologies Inc. - Key offerings
              • Akamai Technologies Inc. - Segment focus
            • 11.4 Broadcom Inc.
              • Broadcom Inc. - Overview
              • Broadcom Inc. - Business segments
              • Broadcom Inc. - Key news
              • Broadcom Inc. - Key offerings
              • Broadcom Inc. - Segment focus
            • 11.5 Cavisson Systems Inc.
              • Cavisson Systems Inc. - Overview
              • Cavisson Systems Inc. - Product / Service
              • Cavisson Systems Inc. - Key offerings
            • 11.6 Cloudflare Inc.
              • Cloudflare Inc. - Overview
              • Cloudflare Inc. - Product / Service
              • Cloudflare Inc. - Key news
              • Cloudflare Inc. - Key offerings
            • 11.7 Dynatrace Inc.
              • Dynatrace Inc. - Overview
              • Dynatrace Inc. - Product / Service
              • Dynatrace Inc. - Key news
              • Dynatrace Inc. - Key offerings
            • 11.8 F5 Inc.
              • F5 Inc. - Overview
              • F5 Inc. - Product / Service
              • F5 Inc. - Key news
              • F5 Inc. - Key offerings
            • 11.9 International Business Machines Corp.
              • International Business Machines Corp. - Overview
              • International Business Machines Corp. - Business segments
              • International Business Machines Corp. - Key news
              • International Business Machines Corp. - Key offerings
              • International Business Machines Corp. - Segment focus
            • 11.10 New Relic Inc.
              • New Relic Inc. - Overview
              • New Relic Inc. - Product / Service
              • New Relic Inc. - Key offerings
            • 11.11 Open Text Corporation
              • Open Text Corporation - Overview
              • Open Text Corporation - Business segments
              • Open Text Corporation - Key news
              • Open Text Corporation - Key offerings
              • Open Text Corporation - Segment focus
            • 11.12 TransUnion
              • TransUnion - Overview
              • TransUnion - Business segments
              • TransUnion - Key news
              • TransUnion - Key offerings
              • TransUnion - Segment focus

            12 Appendix

            • 12.1 Scope of the report
              • 12.2 Inclusions and exclusions checklist
                • Inclusions checklist
                • Exclusions checklist
              • 12.3 Currency conversion rates for US$
                • Currency conversion rates for US$
              • 12.4 Research methodology
                • Research methodology
              • 12.5 Data procurement
                • Information sources
              • 12.6 Data validation
                • Data validation
              • 12.7 Validation techniques employed for market sizing
                • Validation techniques employed for market sizing
              • 12.8 Data synthesis
                • Data synthesis
              • 12.9 360 degree market analysis
                • 360 degree market analysis
              • 12.10 List of abbreviations
                • List of abbreviations

              Research Methodology

              Technavio presents a detailed picture of the market by way of study, synthesis, and summation of data from multiple sources. The analysts have presented the various facets of the market with a particular focus on identifying the key industry influencers. The data thus presented is comprehensive, reliable, and the result of extensive research, both primary and secondary.

              INFORMATION SOURCES

              Primary sources

              • Manufacturers and suppliers
              • Channel partners
              • Industry experts
              • Strategic decision makers

              Secondary sources

              • Industry journals and periodicals
              • Government data
              • Financial reports of key industry players
              • Historical data
              • Press releases

              DATA ANALYSIS

              Data Synthesis

              • Collation of data
              • Estimation of key figures
              • Analysis of derived insights

              Data Validation

              • Triangulation with data models
              • Reference against proprietary databases
              • Corroboration with industry experts

              REPORT WRITING

              Qualitative

              • Market drivers
              • Market challenges
              • Market trends
              • Five forces analysis

              Quantitative

              • Market size and forecast
              • Market segmentation
              • Geographical insights
              • Competitive landscape

              Interested in this report?

              Get your sample now to see our research methodology and insights!

              Download Now

              Frequently Asked Questions

              Web Performance market growth will increase by $ 2800 mn during 2024-2028 .

              The Web Performance market is expected to grow at a CAGR of 8.12% during 2024-2028 .

              Web Performance market is segmented by Deployment( On premise, Cloud)

              Akamai Technologies Inc., AT and T Inc., Broadcom Inc., Cavisson Systems Inc., CDNetworks Inc., Cisco Systems Inc., Cloudflare Inc., DigitalOcean Holdings Inc., DreamHost LLC, Dynatrace Inc., Equinix Inc., F5 Inc., International Business Machines Corp., New Relic Inc., Nippon Telegraph and Telephone Corp., Open Text Corporation, Radware Ltd., SolarWinds Corp., TransUnion, WPEngine Inc. are a few of the key vendors in the Web Performance market.

              North America will register the highest growth rate of 39% among the other regions. Therefore, the Web Performance market in North America is expected to garner significant business opportunities for the vendors during the forecast period.

              US, Germany, China, UK, Canada

              • Rising number of cyber attacksAdvances in the Internet of Things (IoT) technologies have resulted in a rise in the number of cybercrimes. This has compelled companies to focus on effective web performance. With the continuously changing cyber landscape is the driving factor this market.
              • there is a high demand for cybersecurity solutions is the driving factor this market.
              • as companies across industries aim to protect their data and financial security. However is the driving factor this market.
              • despite the large investments that organizations make every year in cybersecurity solutions is the driving factor this market.
              • the number of cybersecurity attacks is on the rise and poses a major threat to business enterprises. The number of cyberattacks has also increased over the years. In some cases is the driving factor this market.
              • enterprises notice the data breaches only after some time. Some examples of major cyberattacks include:In May 2021 is the driving factor this market.
              • there was a breach in Brenntag is the driving factor this market.
              • a German chemical distribution company. The hackers demanded $7.5 million dollars in bitcoin to release 150 GB worth of stolen data. In May 2021 is the driving factor this market.
              • computer manufacturer Acer was attacked by the REvil hacker group; REvil hackers exploited a vulnerability in a Microsoft Exchange server to get access to Acer files is the driving factor this market.
              • following which they leaked images of the company sensitive financial documents and spreadsheets. Other types of cyberattacks that are becoming more common are ransomware attacks is the driving factor this market.
              • such as Locky and WannaCry. These attacks are carried out by cybercriminals who lure unsuspecting individuals into traps is the driving factor this market.
              • take control of files by locking their systems is the driving factor this market.
              • and demand a huge ransom to release the locked files. The next level of ransomware attacks involves the leak of classified government documents using more sophisticated tools and automation techniques. Nowadays is the driving factor this market.
              • the cybercriminals who launch ransomware attacks have shifted their focus to businesses is the driving factor this market.
              • as the financial gains from getting access to critical enterprise data are higher than that from consumer data. This could result in the entire company shutting down until it pays up is the driving factor this market.
              • failing which it faces the risk of losing all its sensitive data. For instance is the driving factor this market.
              • in August 2018 is the driving factor this market.
              • the Taiwan Semiconductor Manufacturing Company was forced to shut down its fabs (semiconductor manufacturing factories) after its systems were infected with a variant of the WannaCry ransomware. Similarly is the driving factor this market.
              • in April 2020 is the driving factor this market.
              • Cognizant Technology Solutions Corp. announced that it had faced a Maze ransomware attack is the driving factor this market.
              • which caused disruption to its clients data. As these cyber-attacks impact web performance and website speed is the driving factor this market.
              • enterprises are increasingly adopting web performance solutions to prevent cyberattacks is the driving factor this market.
              • which will drive the growth of the global web performance market during the forecast period. is the driving factor this market.

              The Web Performance market vendors should focus on grabbing business opportunities from the On premise segment as it accounted for the largest market share in the base year.