Corn Flour Market Size 2024-2028
The corn flour market size is forecast to increase by USD 3.38 billion, at a CAGR of 3.2% between 2023 and 2028.
- The market is witnessing significant shifts, driven by the rising preference for private-label brands and the increasing awareness about gluten-free food products. The prominence of private-label brands is on the rise due to their competitive pricing and perceived quality, posing a challenge for established market players. Moreover, the health-conscious consumer trend is fueling the demand for gluten-free corn flour, as consumers seek alternatives to wheat-based products.
- However, this market faces challenges, as corn crops are increasingly vulnerable to climate change, leading to potential production risks and price volatility. Companies in the market must navigate these challenges by focusing on innovation, sustainability, and supply chain resilience to capitalize on the growing demand for gluten-free and private-label corn flour products.
What will be the Size of the Corn Flour Market during the forecast period?

Explore in-depth regional segment analysis with market size data - historical 2018-2022 and forecasts 2024-2028 - in the full report.
Request Free Sample
The market continues to evolve, driven by the diverse applications and dynamic market dynamics in various sectors. Corn flour, a versatile ingredient derived from corn, undergoes intricate processing methods to ensure optimal quality. The continuous unfolding of market activities includes the determination of entities such as fat content, gelatinization temperature, starch granule morphology, and density measurement. Purity assessment plays a crucial role in ensuring the highest standards, while corn gluten meal is a valuable byproduct with significant applications. Rheological properties and texture profile analysis provide insights into the end-product's quality, with amylopectin content and ash content analysis contributing to the overall carbohydrate composition.
Shelf life extension and transportation logistics are essential considerations, with modified starches and milling efficiency optimizing product stability. Food safety regulations and quality control procedures are integral to maintaining consumer trust, with colorimetric analysis and storage conditions ensuring product integrity. The market's ongoing evolution encompasses the exploration of corn flour derivatives and the integration of advanced technologies, such as protein quantification, amylose content determination, and fiber content analysis. The market's continuous dynamism underscores the importance of effective supply chain management and adherence to industry standards.
How is this Corn Flour Industry segmented?
The corn flour industry research report provides comprehensive data (region-wise segment analysis), with forecasts and estimates in "USD million" for the period 2024-2028, as well as historical data from 2018-2022 for the following segments.
- End-user
- Industrial
- Retail
- Food service
- Distribution Channel
- Supermarkets and hypermarkets
- Convenience stores
- Online retail
- Others
- Product Type
- Precooked Corn Flour
- Uncooked Corn Flour
- Form
- Yellow Corn Flour
- White Corn Flour
- Blue Corn Flour
- Application
- Food & Beverages (Bakery & Confectionery, Snacks, Breakfast Cereals, Tortillas & Nachos, Thickening Agent)
- Animal Feed
- Industrial (Biofuel, Adhesives)
- Nature
- Geography
- North America
- Europe
- Middle East and Africa
- APAC
- South America
- Rest of World (ROW)
By End-user Insights
The industrial segment is estimated to witness significant growth during the forecast period.
In the industrial sector, corn flour, derived from corn milling, holds a prominent position due to its extensive usage in various applications. In the US food industry, corn flour is particularly favored by snack manufacturers for producing tortilla chips and other snack products. The high starch content in corn flour contributes significantly to the desirable puff effect in the preparation of processed and extruded snacks. Moreover, its use in baby food production is on the rise due to the ease of digestion offered by its starch and protein content, which also creates creamy textures. The global demand for whole grain tortilla chips continues to surge, further propelling the market growth.
Additionally, corn flour finds application in various end-use industries such as bakery, confectionery, and beverage sectors. The production of corn flour involves several processes including particle size distribution assessment, bulk density determination, and packaging technologies. Corn flour processing techniques include starch extraction methods, corn gluten meal production, and corn flour derivatives creation. The rheological properties and texture profile analysis are crucial factors in assessing the quality of corn flour. Food safety regulations mandate purity assessment, colorimetric analysis, moisture content control, and gluten content analysis. Maltodextrin production from corn flour is another significant market trend, with applications in food and beverage industries.
Modified starches, fiber content analysis, and ash content analysis are other emerging areas of interest. Milling efficiency, transportation logistics, and supply chain management are essential aspects of the market. The market dynamics are influenced by factors such as viscosity testing, fat content determination, gelatinization temperature, starch granule morphology, density measurement, and amylose content determination. Overall, the market is characterized by continuous innovation and a focus on improving product quality and efficiency.

Request Free Sample
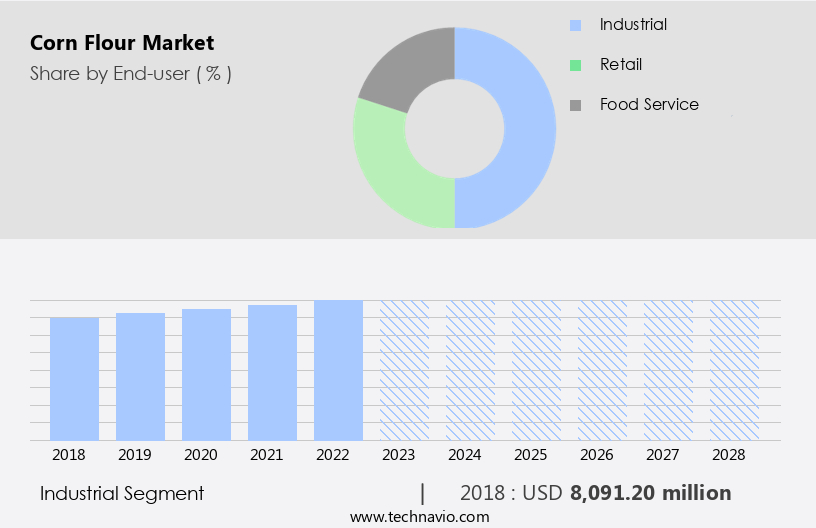
The Industrial segment was valued at USD 8.09 billion in 2018 and showed a gradual increase during the forecast period.
Regional Analysis
North America is estimated to contribute 32% to the growth of the global market during the forecast period.Technavio's analysts have elaborately explained the regional trends and drivers that shape the market during the forecast period.

Request Free Sample
The market in North America is experiencing steady growth due to the expanding Hispanic population and the rising demand for corn-based products, particularly in the United States. This trend is significantly influenced by the increasing number of food service outlets in the region, catering to the large urban population. Tortillas, a staple food for the Hispanic community, are a major driver of market growth. The production of corn flour involves various processes such as particle size distribution assessment, bulk density determination, and packaging technologies to ensure product quality. Corn flour is also used in the production of maltodextrin and various corn flour derivatives.
In the food industry, corn flour is subjected to various tests including viscosity, fat content determination, gelatinization temperature analysis, starch granule morphology assessment, density measurement, purity assessment, and colorimetric analysis to maintain consistency and meet food safety regulations. Corn gluten meal, a by-product of corn flour processing, is used as animal feed. The market also focuses on improving milling efficiency, starch extraction methods, and transportation logistics to ensure supply chain management. The rheological properties and texture profile analysis of corn flour are crucial for end-product applications. The amylopectin content and ash content analysis help determine the carbohydrate composition and overall product quality.
Shelf life extension is another critical factor, achieved through proper moisture content control and storage conditions. The market also offers modified starches to cater to diverse industry requirements. Protein quantification and amylose content determination are essential for product development and quality control procedures.
Market Dynamics
The global corn flour market is experiencing significant expansion, driven by evolving corn flour market trends like the surging demand for gluten-free corn flour. Consumers are increasingly seeking organic corn flour and recognizing the diverse corn flour applications in both culinary and industrial sectors. The popularity of pre-cooked corn flour, particularly masa harina, underscores its convenience. Advances in corn flour production technology are crucial for maintaining quality and efficiency, benefiting corn flour manufacturers. The snack food corn flour segment is a key growth area, alongside traditional uses like corn flour for baking. The market's robust corn flour industry growth is further supported by the growing awareness of corn flour benefits and a rising preference for non-GMO corn flour. Understanding corn flour market share, white corn flour, and the entire corn flour supply chain is vital for players navigating this dynamic market.
Our researchers analyzed the data with 2023 as the base year, along with the key drivers, trends, and challenges. A holistic analysis of drivers will help companies refine their marketing strategies to gain a competitive advantage.
What are the key market drivers leading to the rise in the adoption of Corn Flour Industry?
- The rising prevalence of private-label brands significantly contributes to the market's growth trajectory.
- The market is experiencing significant growth due to the increasing popularity of private-label brands among retailers. These retailers are capitalizing on the rising consumer demand for corn flour by introducing their own brands, which contributes to the market's expansion. In the last decade, the private-label product segment has seen substantial growth in terms of both scope and size. For instance, Alibaba, a leading global retailer, offers a range of corn flour options, including organic and conventional varieties, under its own brand. Corn flour is used extensively in various food applications, including corn syrup production and as a food ingredient.
- Its particle size distribution and bulk density are crucial factors in corn flour processing, which can impact the final product's quality. Packaging technologies play a vital role in preserving the corn flour's freshness and maintaining its desired properties. Additionally, corn flour is used in the production of maltodextrin, a common food additive, and in viscosity testing applications. The versatility of corn flour and its wide range of applications make it an essential ingredient in various industries, further driving market growth. Overall, The market is expected to continue its upward trajectory due to the increasing demand for corn flour and its derivatives in various industries.
What are the market trends shaping the Corn Flour Industry?
- Gluten-free products are gaining significant attention in the market, with increasing consumer awareness driving this trend. It is essential for businesses to stay informed about this developing preference and offer suitable options to cater to this growing demographic.
- The demand for corn flour has witnessed significant growth due to the increasing awareness and diagnosis of celiac disease, a severe form of gluten intolerance. Gluten, a protein found in grains like wheat, barley, rye, and others, can be detrimental to individuals with celiac disease. When water is added to flour, gluten forms a sticky network, making the flour elastic and chewy. However, for those with gluten intolerance, this property can lead to health issues. Corn flour, being naturally gluten-free, offers a viable alternative. In the production process, various parameters such as fat content determination, gelatinization temperature, starch granule morphology, density measurement, purity assessment, and amylopectin content are assessed to ensure the highest quality.
- Moreover, rheological properties and texture profile analysis are conducted to understand the behavior of the corn flour under different conditions. Corn gluten meal, a byproduct of corn flour production, also finds applications in various industries, further contributing to the market's growth. The importance of these evaluations lies in maintaining the consistency and quality of corn flour, ensuring it meets the specifications of various end-users.
What challenges does the Corn Flour Industry face during its growth?
- Climate change poses a significant challenge to the growth of the corn industry, as corn crops are highly susceptible to its effects.
- The market is significantly influenced by the agricultural sector, with production heavily reliant on corn crops. Climatic conditions, such as heatwaves and unpredictable rainfall, can negatively impact corn yields, potentially hindering market growth. Irrigated areas, which account for a significant portion of corn production, are particularly vulnerable to water shortages due to these changing conditions. Corn plants are sensitive to extreme temperatures and drought, making them susceptible to yield reduction. To mitigate the effects of these challenges, various methods are employed in the production of corn flour. These include ash content analysis, starch extraction methods, and protein quantification.
- Shelf life extension is also a priority, achieved through the use of modified starches. Corn flour derivatives, such as maltodextrin and corn syrup, are also produced from corn flour and contribute to the market's growth. Milling efficiency is another crucial factor, ensuring the optimal use of resources and reducing waste. In the realm of transportation logistics, efficient supply chain management is essential to maintaining market competitiveness. Ensuring the timely delivery of corn flour to manufacturers and consumers is crucial, particularly in regions with unpredictable weather patterns. Amylose content determination is also important in the production process, influencing the final product's texture and functionality.
Exclusive Customer Landscape
The corn flour market forecasting report includes the adoption lifecycle of the market, covering from the innovator's stage to the laggard's stage. It focuses on adoption rates in different regions based on penetration. Furthermore, the corn flour market report also includes key purchase criteria and drivers of price sensitivity to help companies evaluate and develop their market growth analysis strategies.
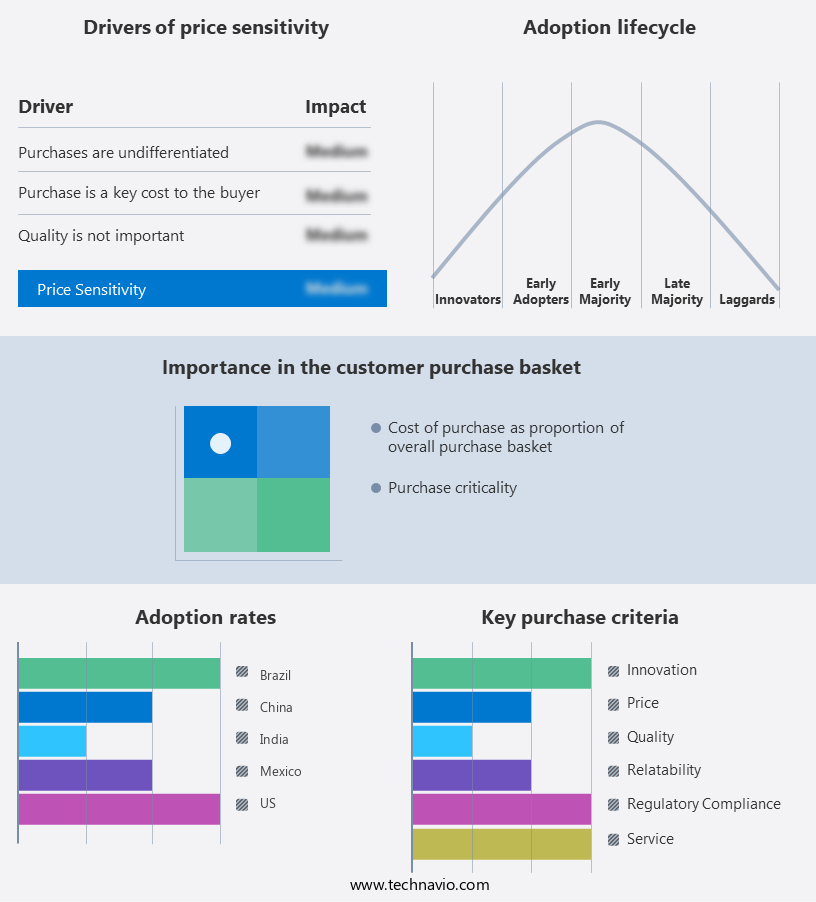
Customer Landscape
Key Companies & Market Insights
Companies are implementing various strategies, such as strategic alliances, corn flour market forecast, partnerships, mergers and acquisitions, geographical expansion, and product/service launches, to enhance their presence in the industry.
AGRANA Beteiligungs AG - The company produces Argo corn starch under two distinct brand names: ACH Food Companies Inc. And Abbotts Bakery. These brands cater to various market segments, showcasing the company's commitment to versatility and market expansion in the starch industry.
The industry research and growth report includes detailed analyses of the competitive landscape of the market and information about key companies, including:
- AGRANA Beteiligungs AG
- Associated British Foods Plc
- Bobs Red Mill Natural Foods Inc.
- Bunge Ltd.
- C.H. Guenther and Son Inc.
- Cargill Inc.
- Doves Farm Foods Ltd.
- General Mills Inc.
- Grain Millers Inc.
- Gruma SAB de CV
- Ingredion Inc.
- King Arthur Baking Co. Inc.
- LifeLine Foods LLC
- SEMO Milling LLC
- Shah Food Processing Pvt. Ltd.
- Sresta Natural Bioproducts Pvt. Ltd.
- To Your Health Sprouted Flour Co.
- Unilever PLC
- War Eagle Mill
- Weisenberger Mills Inc.
Qualitative and quantitative analysis of companies has been conducted to help clients understand the wider business environment as well as the strengths and weaknesses of key industry players. Data is qualitatively analyzed to categorize companies as pure play, category-focused, industry-focused, and diversified; it is quantitatively analyzed to categorize companies as dominant, leading, strong, tentative, and weak.
Recent Development and News in Corn Flour Market
- In January 2024, Archer Daniels Midland Company (ADM), a leading global food and agricultural enterprise, announced the expansion of its corn flour production capacity in the United States by 30%. This expansion was in response to growing demand for corn flour in the food and beverage industry (ADM press release).
- In March 2024, Cargill, a multinational food, agriculture, and industrial conglomerate, entered into a strategic partnership with a leading Chinese food company to establish a joint venture focused on producing and marketing corn flour in China. The joint venture aimed to capitalize on the increasing demand for corn flour in the Chinese market (Cargill press release).
- In May 2024, Gruma S.A.B. De C.V., a leading corn flour manufacturer, completed the acquisition of a corn milling plant in Brazil from Bunge Limited. This acquisition expanded Gruma's production capacity and strengthened its position in the Latin American market (Gruma press release).
- In April 2025, the European Commission approved the merger of two major corn flour producers, MGP Ingredients and Corn Products International. The merger created a leading global corn flour supplier, with a combined market share of approximately 25% (European Commission press release).
Research Analyst Overview
- The market encompasses various aspects of production and processing, with a focus on drying techniques and optimization of processing parameters to ensure consumer acceptance and application versatility. Yield optimization and process optimization are crucial for energy efficiency and waste minimization. Separation techniques, such as centrifugation methods and filtration methods, play a significant role in improving quality indices and functional properties. Sensory evaluation and physical properties assessment are essential for product consistency and meeting sensory attributes. Starch modification techniques, grinding techniques, and purification methods contribute to enhancing ingredient functionality and nutritional value.
- Quality assurance testing, including chemical composition analysis and microbial contamination assessment, is vital for maintaining product integrity. Pest control measures and enzyme activity assays are integral to maintaining the highest standards in corn flour production.
Dive into Technavio's robust research methodology, blending expert interviews, extensive data synthesis, and validated models for unparalleled Corn Flour Market insights. See full methodology.
Market Scope
|
Report Coverage
|
Details
|
Page number
|
176
|
Base year
|
2023
|
Historic period
|
2018-2022 |
Forecast period
|
2024-2028
|
Growth momentum & CAGR
|
Accelerate at a CAGR of 3.2%
|
Market growth 2024-2028
|
USD 3380.9 million
|
Market structure
|
Fragmented
|
YoY growth 2023-2024(%)
|
3.06
|
Key countries
|
US, Canada, Germany, UK, Italy, France, China, India, Japan, Brazil, Egypt, UAE, Oman, Argentina, KSA, UAE, Brazil, and Rest of World (ROW)
|
Competitive landscape
|
Leading Companies, Market Positioning of Companies, Competitive Strategies, and Industry Risks
|
Request Free Sample
What are the Key Data Covered in this Corn Flour Market Research and Growth Report?
- CAGR of the Corn Flour industry during the forecast period
- Detailed information on factors that will drive the growth and forecasting between 2024 and 2028
- Precise estimation of the size of the market and its contribution of the industry in focus to the parent market
- Accurate predictions about upcoming growth and trends and changes in consumer behaviour
- Growth of the market across North America, APAC, South America, Europe, and Middle East and Africa
- Thorough analysis of the market's competitive landscape and detailed information about companies
- Comprehensive analysis of factors that will challenge the corn flour market growth of industry companies
We can help! Our analysts can customize this corn flour market research report to meet your requirements.
Get in touch
1 Executive Summary
- 1.1 Market overview
- Executive Summary - Chart on Market Overview
- Executive Summary - Data Table on Market Overview
- Executive Summary - Chart on Global Market Characteristics
- Executive Summary - Chart on Market by Geography
- Executive Summary - Chart on Market Segmentation by End-user
- Executive Summary - Chart on Market Segmentation by Distribution Channel
- Executive Summary - Chart on Incremental Growth
- Executive Summary - Data Table on Incremental Growth
- Executive Summary - Chart on Company Market Positioning
2 Market Landscape
- 2.1 Market ecosystem
- Parent Market
- Data Table on - Parent Market
- 2.2 Market characteristics
- Market characteristics analysis
3 Market Sizing
- 3.1 Market definition
- Offerings of companies included in the market definition
- 3.2 Market segment analysis
- 3.4 Market outlook: Forecast for 2023-2028
- Chart on Global - Market size and forecast 2023-2028 ($ million)
- Data Table on Global - Market size and forecast 2023-2028 ($ million)
- Chart on Global Market: Year-over-year growth 2023-2028 (%)
- Data Table on Global Market: Year-over-year growth 2023-2028 (%)
4 Historic Market Size
- 4.1 Global Corn Flour Market 2018 - 2022
- Historic Market Size - Data Table on Global Corn Flour Market 2018 - 2022 ($ million)
- 4.2 End-user segment analysis 2018 - 2022
- Historic Market Size - End-user Segment 2018 - 2022 ($ million)
- 4.3 Distribution Channel segment analysis 2018 - 2022
- Historic Market Size - Distribution Channel Segment 2018 - 2022 ($ million)
- 4.4 Geography segment analysis 2018 - 2022
- Historic Market Size - Geography Segment 2018 - 2022 ($ million)
- 4.5 Country segment analysis 2018 - 2022
- Historic Market Size - Country Segment 2018 - 2022 ($ million)
5 Five Forces Analysis
- 5.1 Five forces summary
- Five forces analysis - Comparison between 2023 and 2028
- 5.2 Bargaining power of buyers
- Bargaining power of buyers - Impact of key factors 2023 and 2028
- 5.3 Bargaining power of suppliers
- Bargaining power of suppliers - Impact of key factors in 2023 and 2028
- 5.4 Threat of new entrants
- Threat of new entrants - Impact of key factors in 2023 and 2028
- 5.5 Threat of substitutes
- Threat of substitutes - Impact of key factors in 2023 and 2028
- 5.6 Threat of rivalry
- Threat of rivalry - Impact of key factors in 2023 and 2028
- 5.7 Market condition
- Chart on Market condition - Five forces 2023 and 2028
6 Market Segmentation by End-user
- 6.1 Market segments
- Chart on End-user - Market share (2023-2028) (%)
- Data Table on End-user - Market share (2023-2028) (%)
- 6.2 Comparison by End-user
- Chart on Comparison by End-user
- Data Table on Comparison by End-user
- 6.3 Industrial - Market size and forecast (2023-2028)
- Chart on Industrial - Market size and forecast (2023-2028) ($ million)
- Data Table on Industrial - Market size and forecast (2023-2028) ($ million)
- Chart on Industrial - Year-over-year growth (2023-2028) (%)
- Data Table on Industrial - Year-over-year growth (2023-2028) (%)
- 6.4 Retail - Market size and forecast (2023-2028)
- Chart on Retail - Market size and forecast (2023-2028) ($ million)
- Data Table on Retail - Market size and forecast (2023-2028) ($ million)
- Chart on Retail - Year-over-year growth (2023-2028) (%)
- Data Table on Retail - Year-over-year growth (2023-2028) (%)
- 6.5 Food service - Market size and forecast (2023-2028)
- Chart on Food service - Market size and forecast (2023-2028) ($ million)
- Data Table on Food service - Market size and forecast (2023-2028) ($ million)
- Chart on Food service - Year-over-year growth (2023-2028) (%)
- Data Table on Food service - Year-over-year growth (2023-2028) (%)
- 6.6 Market opportunity by End-user
- Market opportunity by End-user ($ million)
- Data Table on Market opportunity by End-user ($ million)
7 Market Segmentation by Distribution Channel
- 7.1 Market segments
- Chart on Distribution Channel - Market share (2023-2028) (%)
- Data Table on Distribution Channel - Market share (2023-2028) (%)
- 7.2 Comparison by Distribution Channel
- Chart on Comparison by Distribution Channel
- Data Table on Comparison by Distribution Channel
- 7.3 Supermarkets and hypermarkets - Market size and forecast (2023-2028)
- Chart on Supermarkets and hypermarkets - Market size and forecast (2023-2028) ($ million)
- Data Table on Supermarkets and hypermarkets - Market size and forecast (2023-2028) ($ million)
- Chart on Supermarkets and hypermarkets - Year-over-year growth (2023-2028) (%)
- Data Table on Supermarkets and hypermarkets - Year-over-year growth (2023-2028) (%)
- 7.4 Convenience stores - Market size and forecast (2023-2028)
- Chart on Convenience stores - Market size and forecast (2023-2028) ($ million)
- Data Table on Convenience stores - Market size and forecast (2023-2028) ($ million)
- Chart on Convenience stores - Year-over-year growth (2023-2028) (%)
- Data Table on Convenience stores - Year-over-year growth (2023-2028) (%)
- 7.5 Online retail - Market size and forecast (2023-2028)
- Chart on Online retail - Market size and forecast (2023-2028) ($ million)
- Data Table on Online retail - Market size and forecast (2023-2028) ($ million)
- Chart on Online retail - Year-over-year growth (2023-2028) (%)
- Data Table on Online retail - Year-over-year growth (2023-2028) (%)
- 7.6 Others - Market size and forecast (2023-2028)
- Chart on Others - Market size and forecast (2023-2028) ($ million)
- Data Table on Others - Market size and forecast (2023-2028) ($ million)
- Chart on Others - Year-over-year growth (2023-2028) (%)
- Data Table on Others - Year-over-year growth (2023-2028) (%)
- 7.7 Market opportunity by Distribution Channel
- Market opportunity by Distribution Channel ($ million)
- Data Table on Market opportunity by Distribution Channel ($ million)
8 Market Segmentation by Product Type
- 8.1 Market segments
- Chart on Product Type - Market share (2023-2028) (%)
- Data Table on Product Type - Market share (2023-2028) (%)
- 8.2 Comparison by Product Type
- Chart on Comparison by Product Type
- Data Table on Comparison by Product Type
- 8.3 Precooked Corn Flour - Market size and forecast (2023-2028)
- Chart on Precooked Corn Flour - Market size and forecast (2023-2028) ($ million)
- Data Table on Precooked Corn Flour - Market size and forecast (2023-2028) ($ million)
- Chart on Precooked Corn Flour - Year-over-year growth (2023-2028) (%)
- Data Table on Precooked Corn Flour - Year-over-year growth (2023-2028) (%)
- 8.4 Uncooked Corn Flour - Market size and forecast (2023-2028)
- Chart on Uncooked Corn Flour - Market size and forecast (2023-2028) ($ million)
- Data Table on Uncooked Corn Flour - Market size and forecast (2023-2028) ($ million)
- Chart on Uncooked Corn Flour - Year-over-year growth (2023-2028) (%)
- Data Table on Uncooked Corn Flour - Year-over-year growth (2023-2028) (%)
- 8.5 Market opportunity by Product Type
- Market opportunity by Product Type ($ million)
- Data Table on Market opportunity by Product Type ($ million)
9 Market Segmentation by Form
- 9.1 Market segments
- Chart on Form - Market share (2023-2028) (%)
- Data Table on Form - Market share (2023-2028) (%)
- 9.2 Comparison by Form
- Chart on Comparison by Form
- Data Table on Comparison by Form
- 9.3 Yellow Corn Flour - Market size and forecast (2023-2028)
- Chart on Yellow Corn Flour - Market size and forecast (2023-2028) ($ million)
- Data Table on Yellow Corn Flour - Market size and forecast (2023-2028) ($ million)
- Chart on Yellow Corn Flour - Year-over-year growth (2023-2028) (%)
- Data Table on Yellow Corn Flour - Year-over-year growth (2023-2028) (%)
- 9.4 White Corn Flour - Market size and forecast (2023-2028)
- Chart on White Corn Flour - Market size and forecast (2023-2028) ($ million)
- Data Table on White Corn Flour - Market size and forecast (2023-2028) ($ million)
- Chart on White Corn Flour - Year-over-year growth (2023-2028) (%)
- Data Table on White Corn Flour - Year-over-year growth (2023-2028) (%)
- 9.5 Blue Corn Flour - Market size and forecast (2023-2028)
- Chart on Blue Corn Flour - Market size and forecast (2023-2028) ($ million)
- Data Table on Blue Corn Flour - Market size and forecast (2023-2028) ($ million)
- Chart on Blue Corn Flour - Year-over-year growth (2023-2028) (%)
- Data Table on Blue Corn Flour - Year-over-year growth (2023-2028) (%)
- 9.6 Market opportunity by Form
- Market opportunity by Form ($ million)
- Data Table on Market opportunity by Form ($ million)
10 Market Segmentation by Application
- 10.1 Market segments
- Chart on Application - Market share (2023-2028) (%)
- Data Table on Application - Market share (2023-2028) (%)
- 10.2 Comparison by Application
- Chart on Comparison by Application
- Data Table on Comparison by Application
- 10.3 Food & Beverages (Bakery & Confectionery,Snacks, Breakfast Cereals, Tortillas & Nachos, Thickening Agent) - Market size and forecast (2023-2028)
- Chart on Food & Beverages (Bakery & Confectionery,Snacks, Breakfast Cereals, Tortillas & Nachos, Thickening Agent) - Market size and forecast (2023-2028) ($ million)
- Data Table on Food & Beverages (Bakery & Confectionery,Snacks, Breakfast Cereals, Tortillas & Nachos, Thickening Agent) - Market size and forecast (2023-2028) ($ million)
- Chart on Food & Beverages (Bakery & Confectionery,Snacks, Breakfast Cereals, Tortillas & Nachos, Thickening Agent) - Year-over-year growth (2023-2028) (%)
- Data Table on Food & Beverages (Bakery & Confectionery,Snacks, Breakfast Cereals, Tortillas & Nachos, Thickening Agent) - Year-over-year growth (2023-2028) (%)
- 10.4 Animal Feed - Market size and forecast (2023-2028)
- Chart on Animal Feed - Market size and forecast (2023-2028) ($ million)
- Data Table on Animal Feed - Market size and forecast (2023-2028) ($ million)
- Chart on Animal Feed - Year-over-year growth (2023-2028) (%)
- Data Table on Animal Feed - Year-over-year growth (2023-2028) (%)
- 10.5 Industrial (Biofuel, Adhesives) - Market size and forecast (2023-2028)
- Chart on Industrial (Biofuel, Adhesives) - Market size and forecast (2023-2028) ($ million)
- Data Table on Industrial (Biofuel, Adhesives) - Market size and forecast (2023-2028) ($ million)
- Chart on Industrial (Biofuel, Adhesives) - Year-over-year growth (2023-2028) (%)
- Data Table on Industrial (Biofuel, Adhesives) - Year-over-year growth (2023-2028) (%)
- 10.6 Market opportunity by Application
- Market opportunity by Application ($ million)
- Data Table on Market opportunity by Application ($ million)
11 Market Segmentation by Nature
- 11.1 Market segments
- Chart on Nature - Market share (2023-2028) (%)
- Data Table on Nature - Market share (2023-2028) (%)
- 11.2 Comparison by Nature
- Chart on Comparison by Nature
- Data Table on Comparison by Nature
- 11.3 Organic - Market size and forecast (2023-2028)
- Chart on Organic - Market size and forecast (2023-2028) ($ million)
- Data Table on Organic - Market size and forecast (2023-2028) ($ million)
- Chart on Organic - Year-over-year growth (2023-2028) (%)
- Data Table on Organic - Year-over-year growth (2023-2028) (%)
- 11.4 Conventional - Market size and forecast (2023-2028)
- Chart on Conventional - Market size and forecast (2023-2028) ($ million)
- Data Table on Conventional - Market size and forecast (2023-2028) ($ million)
- Chart on Conventional - Year-over-year growth (2023-2028) (%)
- Data Table on Conventional - Year-over-year growth (2023-2028) (%)
- 11.5 Market opportunity by Nature
- Market opportunity by Nature ($ million)
- Data Table on Market opportunity by Nature ($ million)
12 Customer Landscape
- 12.1 Customer landscape overview
- Analysis of price sensitivity, lifecycle, customer purchase basket, adoption rates, and purchase criteria
13 Geographic Landscape
- 13.1 Geographic segmentation
- Chart on Market share by geography 2023-2028 (%)
- Data Table on Market share by geography 2023-2028 (%)
- 13.2 Geographic comparison
- Chart on Geographic comparison
- Data Table on Geographic comparison
- 13.3 North America - Market size and forecast 2023-2028
- Chart on North America - Market size and forecast 2023-2028 ($ million)
- Data Table on North America - Market size and forecast 2023-2028 ($ million)
- Chart on North America - Year-over-year growth 2023-2028 (%)
- Data Table on North America - Year-over-year growth 2023-2028 (%)
- 13.4 APAC - Market size and forecast 2023-2028
- Chart on APAC - Market size and forecast 2023-2028 ($ million)
- Data Table on APAC - Market size and forecast 2023-2028 ($ million)
- Chart on APAC - Year-over-year growth 2023-2028 (%)
- Data Table on APAC - Year-over-year growth 2023-2028 (%)
- 13.5 South America - Market size and forecast 2023-2028
- Chart on South America - Market size and forecast 2023-2028 ($ million)
- Data Table on South America - Market size and forecast 2023-2028 ($ million)
- Chart on South America - Year-over-year growth 2023-2028 (%)
- Data Table on South America - Year-over-year growth 2023-2028 (%)
- 13.6 Europe - Market size and forecast 2023-2028
- Chart on Europe - Market size and forecast 2023-2028 ($ million)
- Data Table on Europe - Market size and forecast 2023-2028 ($ million)
- Chart on Europe - Year-over-year growth 2023-2028 (%)
- Data Table on Europe - Year-over-year growth 2023-2028 (%)
- 13.7 Middle East and Africa - Market size and forecast 2023-2028
- Chart on Middle East and Africa - Market size and forecast 2023-2028 ($ million)
- Data Table on Middle East and Africa - Market size and forecast 2023-2028 ($ million)
- Chart on Middle East and Africa - Year-over-year growth 2023-2028 (%)
- Data Table on Middle East and Africa - Year-over-year growth 2023-2028 (%)
- 13.8 US - Market size and forecast 2023-2028
- Chart on US - Market size and forecast 2023-2028 ($ million)
- Data Table on US - Market size and forecast 2023-2028 ($ million)
- Chart on US - Year-over-year growth 2023-2028 (%)
- Data Table on US - Year-over-year growth 2023-2028 (%)
- 13.9 China - Market size and forecast 2023-2028
- Chart on China - Market size and forecast 2023-2028 ($ million)
- Data Table on China - Market size and forecast 2023-2028 ($ million)
- Chart on China - Year-over-year growth 2023-2028 (%)
- Data Table on China - Year-over-year growth 2023-2028 (%)
- 13.10 Brazil - Market size and forecast 2023-2028
- Chart on Brazil - Market size and forecast 2023-2028 ($ million)
- Data Table on Brazil - Market size and forecast 2023-2028 ($ million)
- Chart on Brazil - Year-over-year growth 2023-2028 (%)
- Data Table on Brazil - Year-over-year growth 2023-2028 (%)
- 13.11 India - Market size and forecast 2023-2028
- Chart on India - Market size and forecast 2023-2028 ($ million)
- Data Table on India - Market size and forecast 2023-2028 ($ million)
- Chart on India - Year-over-year growth 2023-2028 (%)
- Data Table on India - Year-over-year growth 2023-2028 (%)
- 13.12 Mexico - Market size and forecast 2023-2028
- Chart on Mexico - Market size and forecast 2023-2028 ($ million)
- Data Table on Mexico - Market size and forecast 2023-2028 ($ million)
- Chart on Mexico - Year-over-year growth 2023-2028 (%)
- Data Table on Mexico - Year-over-year growth 2023-2028 (%)
- 13.13 Market opportunity by geography
- Market opportunity by geography ($ million)
- Data Tables on Market opportunity by geography ($ million)
- 13.14 Canada - Market size and forecast (2023-2028)
- Chart on Canada - Market size and forecast (2023-2028) ($ million)
- Data Table on Canada - Market size and forecast (2023-2028) ($ million)
- Chart on Canada - Year-over-year growth (2023-2028) (%)
- Data Table on Canada - Year-over-year growth (2023-2028) (%)
- 13.15 Germany - Market size and forecast (2023-2028)
- Chart on Germany - Market size and forecast (2023-2028) ($ million)
- Data Table on Germany - Market size and forecast (2023-2028) ($ million)
- Chart on Germany - Year-over-year growth (2023-2028) (%)
- Data Table on Germany - Year-over-year growth (2023-2028) (%)
- 13.16 UK - Market size and forecast (2023-2028)
- Chart on UK - Market size and forecast (2023-2028) ($ million)
- Data Table on UK - Market size and forecast (2023-2028) ($ million)
- Chart on UK - Year-over-year growth (2023-2028) (%)
- Data Table on UK - Year-over-year growth (2023-2028) (%)
- 13.17 Italy - Market size and forecast (2023-2028)
- Chart on Italy - Market size and forecast (2023-2028) ($ million)
- Data Table on Italy - Market size and forecast (2023-2028) ($ million)
- Chart on Italy - Year-over-year growth (2023-2028) (%)
- Data Table on Italy - Year-over-year growth (2023-2028) (%)
- 13.18 France - Market size and forecast (2023-2028)
- Chart on France - Market size and forecast (2023-2028) ($ million)
- Data Table on France - Market size and forecast (2023-2028) ($ million)
- Chart on France - Year-over-year growth (2023-2028) (%)
- Data Table on France - Year-over-year growth (2023-2028) (%)
- 13.19 Japan - Market size and forecast (2023-2028)
- Chart on Japan - Market size and forecast (2023-2028) ($ million)
- Data Table on Japan - Market size and forecast (2023-2028) ($ million)
- Chart on Japan - Year-over-year growth (2023-2028) (%)
- Data Table on Japan - Year-over-year growth (2023-2028) (%)
- 13.20 Egypt - Market size and forecast (2023-2028)
- Chart on Egypt - Market size and forecast (2023-2028) ($ million)
- Data Table on Egypt - Market size and forecast (2023-2028) ($ million)
- Chart on Egypt - Year-over-year growth (2023-2028) (%)
- Data Table on Egypt - Year-over-year growth (2023-2028) (%)
- 13.21 UAE - Market size and forecast (2023-2028)
- Chart on UAE - Market size and forecast (2023-2028) ($ million)
- Data Table on UAE - Market size and forecast (2023-2028) ($ million)
- Chart on UAE - Year-over-year growth (2023-2028) (%)
- Data Table on UAE - Year-over-year growth (2023-2028) (%)
- 13.22 Oman - Market size and forecast (2023-2028)
- Chart on Oman - Market size and forecast (2023-2028) ($ million)
- Data Table on Oman - Market size and forecast (2023-2028) ($ million)
- Chart on Oman - Year-over-year growth (2023-2028) (%)
- Data Table on Oman - Year-over-year growth (2023-2028) (%)
- 13.23 Argentina - Market size and forecast (2023-2028)
- Chart on Argentina - Market size and forecast (2023-2028) ($ million)
- Data Table on Argentina - Market size and forecast (2023-2028) ($ million)
- Chart on Argentina - Year-over-year growth (2023-2028) (%)
- Data Table on Argentina - Year-over-year growth (2023-2028) (%)
- 13.24 KSA - Market size and forecast (2023-2028)
- Chart on KSA - Market size and forecast (2023-2028) ($ million)
- Data Table on KSA - Market size and forecast (2023-2028) ($ million)
- Chart on KSA - Year-over-year growth (2023-2028) (%)
- Data Table on KSA - Year-over-year growth (2023-2028) (%)
- 13.25 Rest of World (ROW) - Market size and forecast (2023-2028)
- Chart on Rest of World (ROW) - Market size and forecast (2023-2028) ($ million)
- Data Table on Rest of World (ROW) - Market size and forecast (2023-2028) ($ million)
- Chart on Rest of World (ROW) - Year-over-year growth (2023-2028) (%)
- Data Table on Rest of World (ROW) - Year-over-year growth (2023-2028) (%)
14 Drivers, Challenges, and Opportunity/Restraints
- 14.3 Impact of drivers and challenges
- Impact of drivers and challenges in 2023 and 2028
- 14.4 Market opportunities/restraints
15 Competitive Landscape
- 15.2 Competitive Landscape
- Overview on criticality of inputs and factors of differentiation
- 15.3 Landscape disruption
- Overview on factors of disruption
- 15.4 Industry risks
- Impact of key risks on business
16 Competitive Analysis
- 16.2 Market positioning of companies
- Matrix on companies position and classification
- 16.3 Associated British Foods Plc
- Associated British Foods Plc - Overview
- Associated British Foods Plc - Business segments
- Associated British Foods Plc - Key offerings
- Associated British Foods Plc - Segment focus
- 16.4 Bobs Red Mill Natural Foods Inc.
- Bobs Red Mill Natural Foods Inc. - Overview
- Bobs Red Mill Natural Foods Inc. - Product / Service
- Bobs Red Mill Natural Foods Inc. - Key offerings
- 16.5 Bunge Ltd.
- Bunge Ltd. - Overview
- Bunge Ltd. - Business segments
- Bunge Ltd. - Key news
- Bunge Ltd. - Key offerings
- Bunge Ltd. - Segment focus
- 16.6 Cargill Inc.
- Cargill Inc. - Overview
- Cargill Inc. - Product / Service
- Cargill Inc. - Key offerings
- 16.7 Doves Farm Foods Ltd.
- Doves Farm Foods Ltd. - Overview
- Doves Farm Foods Ltd. - Product / Service
- Doves Farm Foods Ltd. - Key offerings
- 16.8 General Mills Inc.
- General Mills Inc. - Overview
- General Mills Inc. - Business segments
- General Mills Inc. - Key news
- General Mills Inc. - Key offerings
- General Mills Inc. - Segment focus
- 16.9 Grain Millers Inc.
- Grain Millers Inc. - Overview
- Grain Millers Inc. - Product / Service
- Grain Millers Inc. - Key offerings
- 16.10 Gruma SAB de CV
- Gruma SAB de CV - Overview
- Gruma SAB de CV - Business segments
- Gruma SAB de CV - Key offerings
- Gruma SAB de CV - Segment focus
- 16.11 Ingredion Inc.
- Ingredion Inc. - Overview
- Ingredion Inc. - Business segments
- Ingredion Inc. - Key news
- Ingredion Inc. - Key offerings
- Ingredion Inc. - Segment focus
- 16.12 King Arthur Baking Co. Inc.
- King Arthur Baking Co. Inc. - Overview
- King Arthur Baking Co. Inc. - Product / Service
- King Arthur Baking Co. Inc. - Key offerings
- 16.13 LifeLine Foods LLC
- LifeLine Foods LLC - Overview
- LifeLine Foods LLC - Product / Service
- LifeLine Foods LLC - Key offerings
- 16.14 SEMO Milling LLC
- SEMO Milling LLC - Overview
- SEMO Milling LLC - Product / Service
- SEMO Milling LLC - Key offerings
- 16.15 Shah Food Processing Pvt. Ltd.
- Shah Food Processing Pvt. Ltd. - Overview
- Shah Food Processing Pvt. Ltd. - Product / Service
- Shah Food Processing Pvt. Ltd. - Key offerings
- 16.16 Unilever PLC
- Unilever PLC - Overview
- Unilever PLC - Business segments
- Unilever PLC - Key news
- Unilever PLC - Key offerings
- Unilever PLC - Segment focus
- 16.17 Weisenberger Mills Inc.
- Weisenberger Mills Inc. - Overview
- Weisenberger Mills Inc. - Product / Service
- Weisenberger Mills Inc. - Key offerings
17 Appendix
- 17.2 Inclusions and exclusions checklist
- Inclusions checklist
- Exclusions checklist
- 17.3 Currency conversion rates for US$
- Currency conversion rates for US$
- 17.4 Research methodology
- 17.7 Validation techniques employed for market sizing
- Validation techniques employed for market sizing
- 17.9 360 degree market analysis
- 360 degree market analysis
- 17.10 List of abbreviations