Private Label Food And Beverages Market Analysis, Size, and Forecast 2026-2030: Europe (Germany, UK, and France), North America (US, Canada, and Mexico), APAC (China, Japan, and India), Middle East and Africa (Saudi Arabia, UAE, and South Africa), South America (Brazil and Argentina), and Rest of World (ROW)

Private Label Food And Beverages Market Analysis, Size, and Forecast 2026-2030:
Europe (Germany, UK, and France), North America (US, Canada, and Mexico), APAC (China, Japan, and India), Middle East and Africa (Saudi Arabia, UAE, and South Africa), South America (Brazil and Argentina), and Rest of World (ROW)

Published: Apr 2026 298 Pages SKU: IRTNTR43354

Market Overview at a Glance

$220.3 B
Market Opportunity
7%
CAGR 2025 - 2030
39.9%
Europe Growth
$413.5 B
Offline segment 2024

Private Label Food And Beverages Market Size 2026-2030

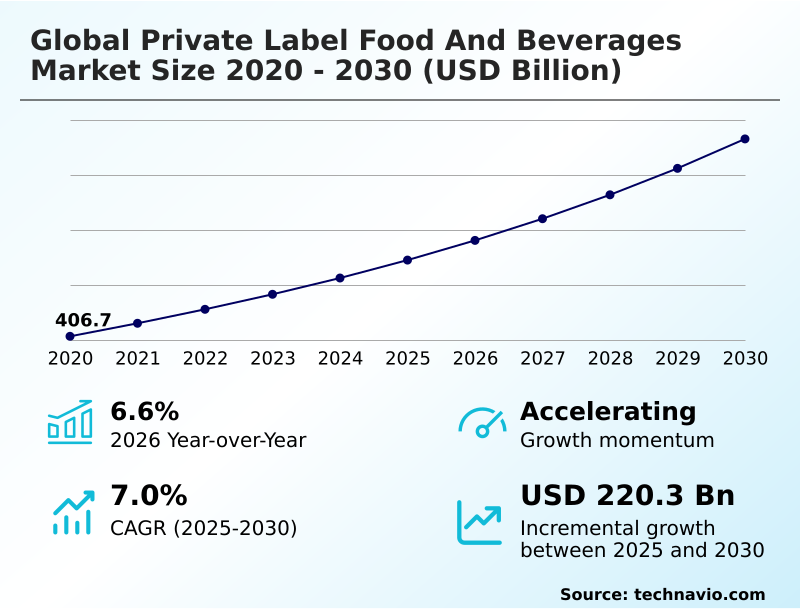
The private label food and beverages market size is valued to increase by USD 220.3 billion, at a CAGR of 7% from 2025 to 2030. Economic volatility and consumer price sensitivity will drive the private label food and beverages market.

Major Market Trends & Insights

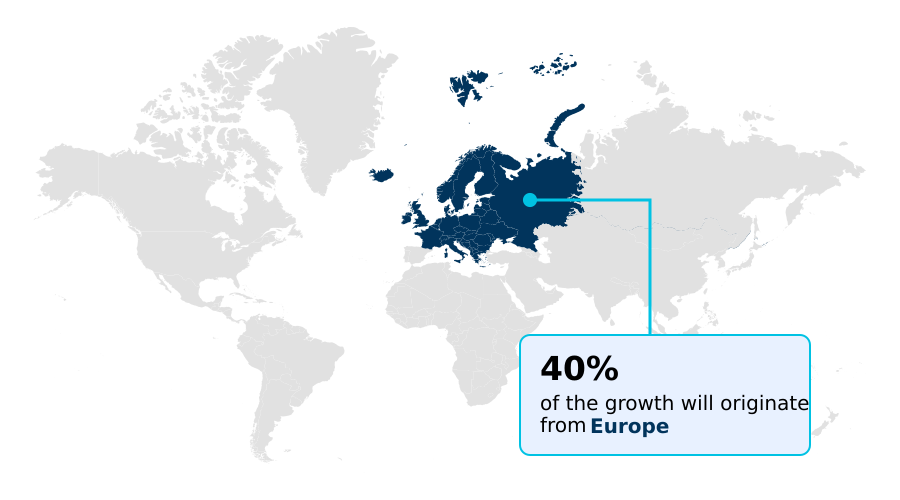
  • Europe dominated the market and accounted for a 39.9% growth during the forecast period.
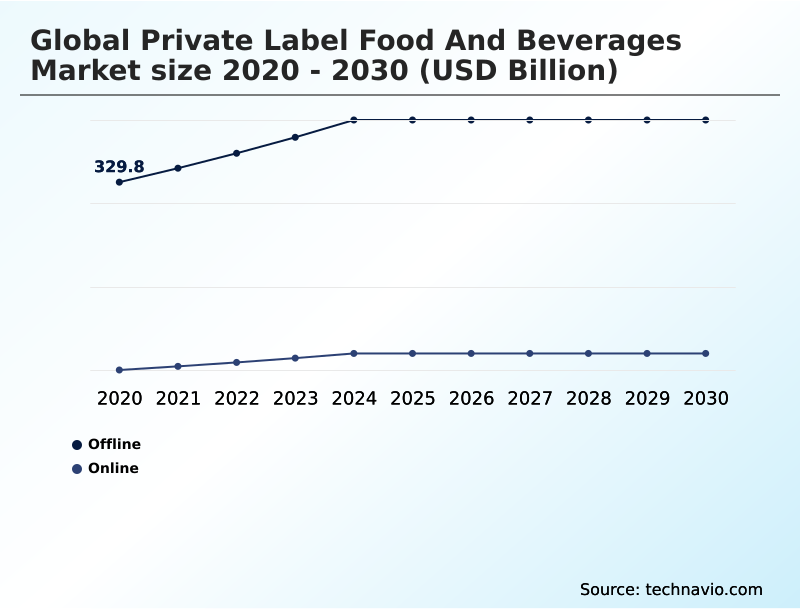
  • By Distribution Channel - Offline segment was valued at USD 413.5 billion in 2024
  • By Product - Food segment accounted for the largest market revenue share in 2024

Market Size & Forecast

  • Market Opportunities: USD 358.9 billion
  • Market Future Opportunities: USD 220.3 billion
  • CAGR from 2025 to 2030 : 7%

Market Summary

  • The private label food and beverages market is undergoing a significant transformation, moving beyond its traditional role as a budget-friendly alternative to become a hub of retail innovation. This evolution is driven by retailers' strategic focus on developing high-quality, differentiated product portfolios to build consumer loyalty and enhance profit margins.
  • Key trends include the push toward premiumization, with retailers launching gourmet, organic, and specialized dietary lines that compete directly with national brands on quality rather than just price. In a typical business scenario, a retailer might leverage data analytics from its loyalty program to identify a gap in the plant-based snack category.
  • Instead of waiting for a national brand to act, the retailer collaborates with a contract manufacturer to quickly launch a proprietary line of clean-label, plant-based snacks, capturing first-mover advantage and reinforcing its brand identity. This agility is central to the modern private label landscape.
  • However, this growth is moderated by challenges such as intense competition, supply chain complexities, and the constant need to innovate to maintain consumer interest in a crowded marketplace.

What will be the Size of the Private Label Food And Beverages Market during the forecast period?

Get Key Insights on Market Forecast (PDF) Request Free Sample

How is the Private Label Food And Beverages Market Segmented?

The private label food and beverages industry research report provides comprehensive data (region-wise segment analysis), with forecasts and estimates in "USD billion" for the period 2026-2030, as well as historical data from 2020-2024 for the following segments.

  • Distribution channel
    • Offline
    • Online
  • Product
    • Food
    • Beverages
  • Price range
    • Mid-range
    • Economy
    • Premium
  • Geography
    • Europe
      • Germany
      • UK
      • France
    • North America
      • US
      • Canada
      • Mexico
    • APAC
      • China
      • Japan
      • India
    • Middle East and Africa
      • Saudi Arabia
      • UAE
      • South Africa
    • South America
      • Brazil
      • Argentina
    • Rest of World (ROW)

By Distribution Channel Insights

The offline segment is estimated to witness significant growth during the forecast period.

The offline segment is the primary channel for store brand development, where strategic in-store brand placement and brand architecture are critical.

Physical retail formats, from hypermarkets to formats leveraging a discount retailer strategy, are evolving their omni-channel retail strategy to enhance the consumer experience.

Innovations in private label manufacturing allow for rapid product iterations showcased directly on shelves, shaping store brand quality perception at the point of purchase.

To combat showrooming, leading retailers are transforming their physical spaces into discovery zones, integrating digital tools that guide purchasing decisions. This approach to in-house brand development boosts private label market penetration by making the value proposition tangible.

Sensor-driven inventory systems are improving replenishment efficiency by 35%, ensuring high-demand items are consistently available.

Request Free Sample

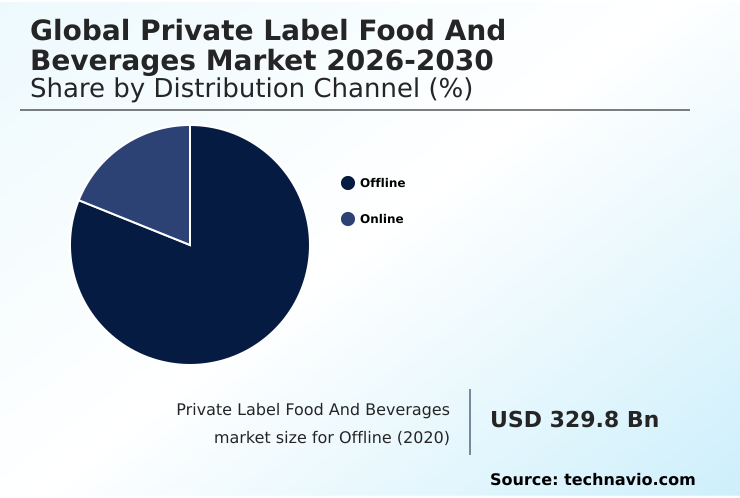
The Offline segment was valued at USD 413.5 billion in 2024 and showed a gradual increase during the forecast period.

Request Free Sample

Regional Analysis

Europe is estimated to contribute 39.9% to the growth of the global market during the forecast period.Technavio’s analysts have elaborately explained the regional trends and drivers that shape the market during the forecast period.

See How Private Label Food And Beverages Market Demand is Rising in Europe Request Free Sample

The global geographic landscape is marked by varied stages of market maturity.

Europe remains a stronghold for private label market penetration, poised to contribute nearly 40% of the market’s growth, driven by a deeply embedded discount retailer strategy and high consumer acceptance.

Here, the focus is on optimizing contract food production for premium private label and organic store brands. In contrast, North America is seeing rapid innovation in in-house brand development for categories like frozen food private label and shelf-stable private brands.

The APAC region represents the fastest-growing frontier, where a burgeoning middle class and the expansion of modern retail are creating new opportunities for a private label product launch.

In this region, retailers are leveraging private label data analytics to tailor offerings to local tastes, achieving initial adoption rates 25% faster than with standardized global products.
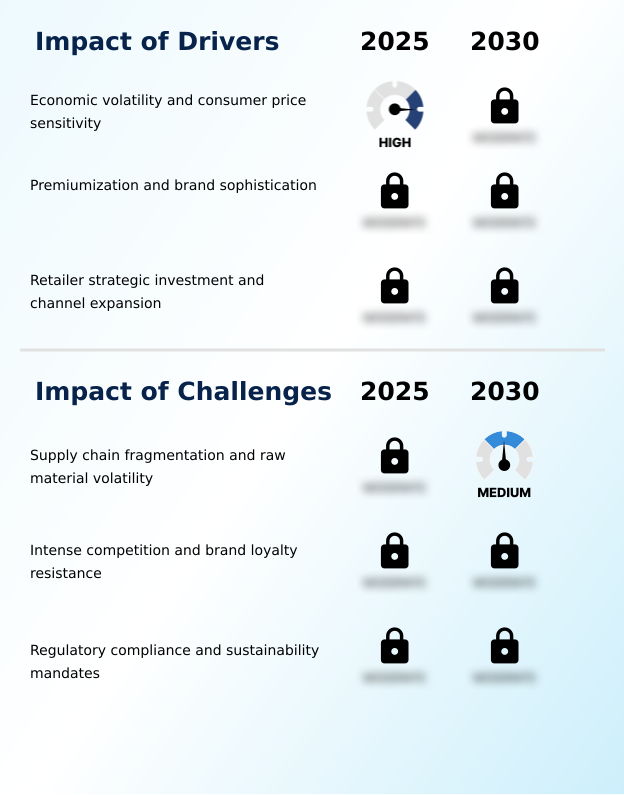
Market Dynamics

Our researchers analyzed the data with 2025 as the base year, along with the key drivers, trends, and challenges. A holistic analysis of drivers will help companies refine their marketing strategies to gain a competitive advantage.

  • Analyzing the global private label food and beverages market growth reveals a complex interplay of factors. The impact of inflation on private labels has been a significant catalyst, accelerating the shift in consumer perception of store brands. Retailer strategies for private brands have evolved, moving from simple value offerings to creating sophisticated private label brand architecture tiers.
  • This shift addresses the need for a strong private label market share vs national brands. Key opportunities are emerging from this transformation, with private label e-commerce opportunities leading the charge. However, significant private label supply chain challenges persist, demanding closer collaboration with private label manufacturing partners.
  • A major focus is on premium private label food trends and the burgeoning private label organic food market. Simultaneously, private label beverage market analysis shows a move toward functional and health-oriented drinks.
  • Meeting private label food safety standards remains non-negotiable, while sustainability in private label packaging is becoming a key differentiator; firms focusing on this report a customer approval rating that is 30% higher than those who do not.
  • As the future of private label food evolves, we see a focus on private label innovation in snacks and a deeper dive into private label health and wellness products. The success of the discount store private label strategy continues to influence the entire sector, while the overall private label penetration in Europe serves as a benchmark for other regions.
  • These dynamics are central to understanding private label market drivers 2026 and beyond.

What are the key market drivers leading to the rise in the adoption of Private Label Food And Beverages Industry?

  • Sustained economic volatility and heightened consumer price sensitivity are the primary drivers for the expansion of the global private label food and beverages market.

  • Economic pressures and heightened consumer price sensitivity are primary drivers, compelling shoppers to reconsider the private label vs national brand debate.
  • Retailers are capitalizing on this by enhancing their private brand portfolio, recognizing that retailer-owned brands are crucial for retailer margin optimization.
  • A strong store brand product assortment builds store brand consumer loyalty, which is a key defense in the current private label competitive landscape.
  • The growth of e-commerce private label has been a powerful catalyst; online shoppers are 40% more likely to switch to a store brand when it is presented as a viable alternative during checkout.
  • Furthermore, retailers with a well-curated private brand portfolio report 5% higher overall store traffic, demonstrating the strategic importance of effective private label brand management.

What are the market trends shaping the Private Label Food And Beverages Industry?

  • The market is witnessing a significant trend toward the expansion of functional health and personalized wellness tiers, transforming private labels into lifestyle brands that command consumer trust.

  • Key trends are reshaping the market as retailers pursue gourmet differentiation and the premiumization of store brands. The expansion into functional food formulation and plant-based private label products is accelerating, driven by consumer demand for healthier options. Retailers are launching retailer-exclusive products that feature clean-label private brands, often developed with unique private label packaging design to stand out.
  • This strategy is particularly effective in the private label beverage trends and private label food trends, where innovation can capture consumer interest. Retailer-exclusive products now account for up to 60% of new items in premium categories.
  • Furthermore, private label health and wellness lines are seeing a 25% higher repeat purchase rate compared to standard offerings, underscoring the shift toward value-added store brands.

What challenges does the Private Label Food And Beverages Industry face during its growth?

  • Supply chain fragmentation and the volatility of raw material costs present a key challenge affecting the market's growth and stability.

  • Navigating the private label supply chain remains a primary challenge, with raw material sourcing volatility leading to input cost increases of up to 30% for some manufacturers. This complicates private label cost engineering and puts pressure on the relationships with third-party manufacturing partners. Ensuring food safety compliance across a fragmented network of suppliers requires robust supply chain integration.
  • Additionally, addressing private label regulatory challenges and consumer demands for private label sustainability presents a significant hurdle. The investment required to implement sustainable packaging solutions adds an average of 15% to production costs for value-tier products. These factors demand more sophisticated private label sourcing strategies to balance cost, quality, and compliance in a competitive environment.

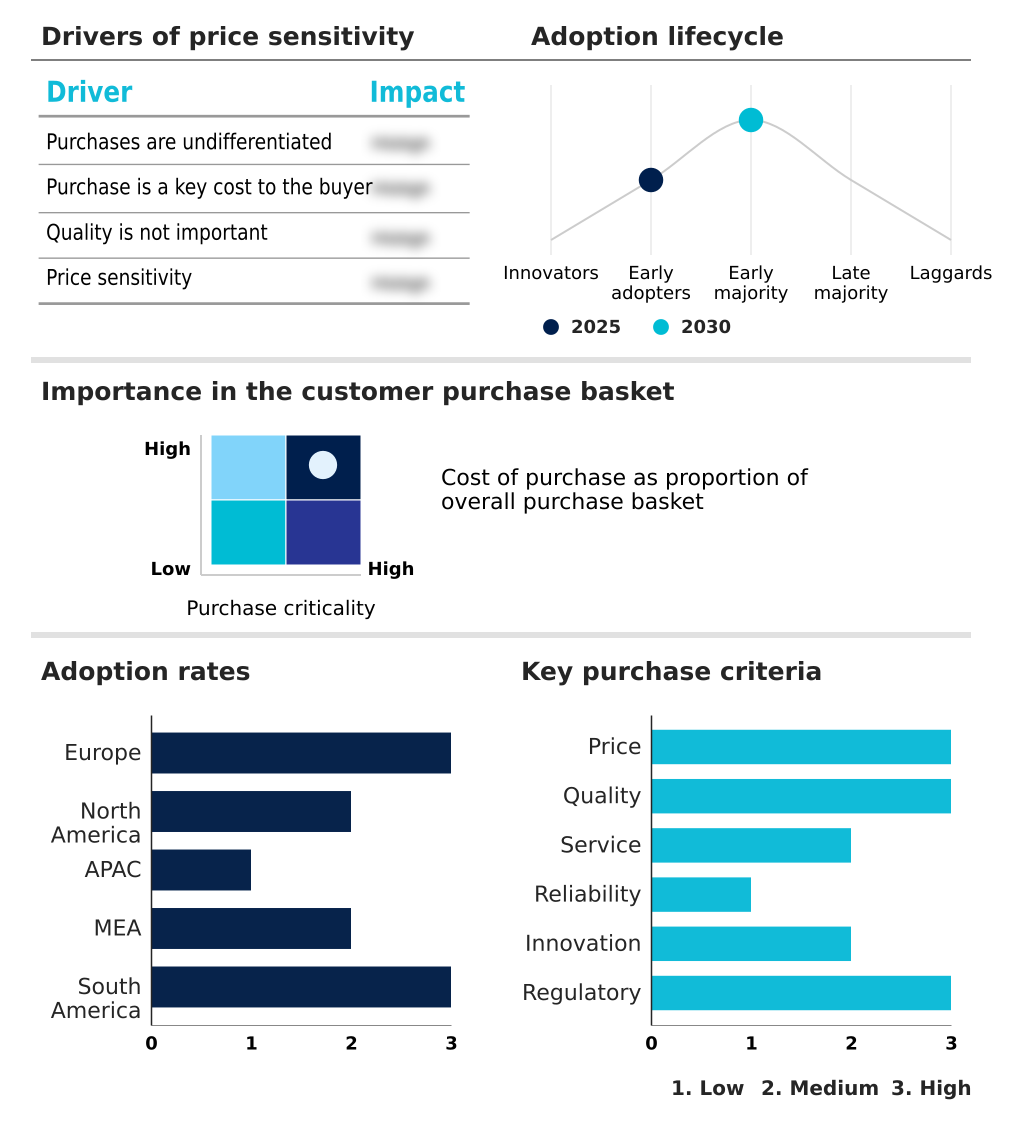
Exclusive Technavio Analysis on Customer Landscape

The private label food and beverages market forecasting report includes the adoption lifecycle of the market, covering from the innovator’s stage to the laggard’s stage. It focuses on adoption rates in different regions based on penetration. Furthermore, the private label food and beverages market report also includes key purchase criteria and drivers of price sensitivity to help companies evaluate and develop their market growth analysis strategies.

Customer Landscape of Private Label Food And Beverages Industry

Competitive Landscape

Companies are implementing various strategies, such as strategic alliances, private label food and beverages market forecast, partnerships, mergers and acquisitions, geographical expansion, and product/service launches, to enhance their presence in the industry.

ARYZTA AG - Key offerings include a diverse range of store-brand grocery products, from snacks to meal items, supplied through strategic private label manufacturing partnerships.

The industry research and growth report includes detailed analyses of the competitive landscape of the market and information about key companies, including:

  • ARYZTA AG
  • Associated British Foods Plc
  • B and G Foods Inc.
  • Conagra Brands Inc.
  • Corporativo Bimbo SA de CV
  • Del Monte Foods Corp
  • Froneri International Ltd.
  • Groupe Lactalis
  • Hormel Foods Corp.
  • McCormick and Co. Inc.
  • Nomad Foods Ltd.
  • Post Holdings Inc.
  • Primo Water Corp.
  • Seneca Foods Corp.
  • Sovos Compliance LLC.
  • SunOpta Inc.
  • The Hain Celestial Group
  • The J.M. Smucker Co.
  • TreeHouse Foods Inc.
  • Unilever PLC

Qualitative and quantitative analysis of companies has been conducted to help clients understand the wider business environment as well as the strengths and weaknesses of key industry players. Data is qualitatively analyzed to categorize companies as pure play, category-focused, industry-focused, and diversified; it is quantitatively analyzed to categorize companies as dominant, leading, strong, tentative, and weak.

Recent Development and News in Private label food and beverages market

  • In September 2024, Walmart announced the launch of its new private brand, bettergoods, marking its largest private-label food introduction in over 20 years with around 300 products.
  • In November 2024, Amazon announced the launch of its new private-label grocery brand, Amazon Grocery, unifying existing lines like Amazon Fresh and Happy Belly into a single offering.
  • In January 2025, TreeHouse Foods Inc. completed the acquisition of Harris Tea, a move designed to establish leadership in the private label tea category and complement its existing beverage capabilities.
  • In April 2025, Target Corporation revealed its strategy to introduce 600 new items to its Good and Gather and Favorite Day private-label lines, emphasizing collaborations and innovation.

Dive into Technavio’s robust research methodology, blending expert interviews, extensive data synthesis, and validated models for unparalleled Private Label Food And Beverages Market insights. See full methodology.

Market Scope
Page number 298
Base year 2025
Historic period 2020-2024
Forecast period 2026-2030
Growth momentum & CAGR Accelerate at a CAGR of 7%
Market growth 2026-2030 USD 220.3 billion
Market structure Fragmented
YoY growth 2025-2026(%) 6.6%
Key countries Germany, UK, France, Italy, Spain, The Netherlands, US, Canada, Mexico, China, Japan, India, South Korea, Australia, Indonesia, Saudi Arabia, UAE, South Africa, Israel, Turkey, Brazil, Argentina and Chile
Competitive landscape Leading Companies, Market Positioning of Companies, Competitive Strategies, and Industry Risks

Request Free Sample

Research Analyst Overview

  • The private label food and beverages market is defined by a strategic pivot from cost-based competition to value-driven brand building. Retailers are leveraging sophisticated brand architecture and omni-channel retail strategy to elevate retailer-owned brands beyond their traditional value perception.
  • A key boardroom focus is on retailer margin optimization, where a well-integrated private brand portfolio can improve category profitability by over 10% compared to relying solely on national brands. This involves significant investment in store brand development, including premium private label and organic store brands.
  • The process requires seamless supply chain integration and careful management of raw material sourcing with contract food production partners. Success depends on maintaining stringent food safety compliance while innovating with functional food formulation and plant-based private label options.
  • As e-commerce private label channels grow, effective in-store brand placement and gourmet differentiation for shelf-stable private brands and frozen food private label products become critical. This shift necessitates robust third-party manufacturing relationships and the adoption of sustainable packaging solutions to manage consumer price sensitivity.

What are the Key Data Covered in this Private Label Food And Beverages Market Research and Growth Report?

  • What is the expected growth of the Private Label Food And Beverages Market between 2026 and 2030?

    • USD 220.3 billion, at a CAGR of 7%

  • What segmentation does the market report cover?

    • The report is segmented by Distribution Channel (Offline, and Online), Product (Food, and Beverages), Price Range (Mid-range, Economy, and Premium) and Geography (Europe, North America, APAC, Middle East and Africa, South America)

  • Which regions are analyzed in the report?

    • Europe, North America, APAC, Middle East and Africa and South America

  • What are the key growth drivers and market challenges?

    • Economic volatility and consumer price sensitivity, Supply chain fragmentation and raw material volatility

  • Who are the major players in the Private Label Food And Beverages Market?

    • ARYZTA AG, Associated British Foods Plc, B and G Foods Inc., Conagra Brands Inc., Corporativo Bimbo SA de CV, Del Monte Foods Corp, Froneri International Ltd., Groupe Lactalis, Hormel Foods Corp., McCormick and Co. Inc., Nomad Foods Ltd., Post Holdings Inc., Primo Water Corp., Seneca Foods Corp., Sovos Compliance LLC., SunOpta Inc., The Hain Celestial Group, The J.M. Smucker Co., TreeHouse Foods Inc. and Unilever PLC

Market Research Insights

  • The market's dynamics are shifting as retailers refine their private label brand management and e-commerce brand strategy. The focus is moving from simple price arbitrage to sophisticated in-house brand development that fosters store brand consumer loyalty. This is evident in the premiumization of store brands, where the goal is to positively shape store brand quality perception.
  • Retailers leveraging private label data analytics for their store brand product assortment report a 15% higher customer retention rate compared to those who do not.
  • Furthermore, a well-defined private brand innovation pipeline can improve the success rate of a new private label product launch by over 20%, demonstrating the importance of strategic planning over reactive cost-cutting in the current private label competitive landscape.

We can help! Our analysts can customize this private label food and beverages market research report to meet your requirements.

Get in touch

1. Executive Summary

1.1 Market overview

Executive Summary - Chart on Market Overview
Executive Summary - Data Table on Market Overview
Executive Summary - Chart on Global Market Characteristics
Executive Summary - Chart on Market by Geography
Executive Summary - Chart on Market Segmentation by Distribution Channel
Executive Summary - Chart on Market Segmentation by Product
Executive Summary - Chart on Market Segmentation by Price Range
Executive Summary - Chart on Incremental Growth
Executive Summary - Data Table on Incremental Growth
Executive Summary - Chart on Company Market Positioning

2. Technavio Analysis

2.1 Analysis of price sensitivity, lifecycle, customer purchase basket, adoption rates, and purchase criteria

2.2 Criticality of inputs and Factors of differentiation

Chart on Overview on criticality of inputs and factors of differentiation

2.3 Factors of disruption

Chart on Overview on factors of disruption

2.4 Impact of drivers and challenges

Chart on Impact of drivers and challenges in 2025 and 2030

3. Market Landscape

3.1 Market ecosystem

Chart on Parent Market
Data Table on - Parent Market

3.2 Market characteristics

Chart on Market characteristics analysis

3.3 Value chain analysis

Chart on Value chain analysis

4. Market Sizing

4.1 Market definition

Data Table on Offerings of companies included in the market definition

4.2 Market segment analysis

Market segments

4.3 Market size 2025

4.4 Market outlook: Forecast for 2025-2030

Chart on Global - Market size and forecast 2025-2030 ($ billion)
Data Table on Global - Market size and forecast 2025-2030 ($ billion)
Chart on Global Market: Year-over-year growth 2025-2030 (%)
Data Table on Global Market: Year-over-year growth 2025-2030 (%)

5. Historic Market Size

5.1 Global Private Label Food And Beverages Market 2020 - 2024

Historic Market Size - Data Table on Global Private Label Food And Beverages Market 2020 - 2024 ($ billion)

5.2 Distribution Channel segment analysis 2020 - 2024

Historic Market Size - Distribution Channel Segment 2020 - 2024 ($ billion)

5.3 Product segment analysis 2020 - 2024

Historic Market Size - Product Segment 2020 - 2024 ($ billion)

5.4 Price Range segment analysis 2020 - 2024

Historic Market Size - Price Range Segment 2020 - 2024 ($ billion)

5.5 Geography segment analysis 2020 - 2024

Historic Market Size - Geography Segment 2020 - 2024 ($ billion)

5.6 Country segment analysis 2020 - 2024

Historic Market Size - Country Segment 2020 - 2024 ($ billion)

6. Qualitative Analysis

6.1 Impact of AI on global private label food and beverages market

6.2 Impact of geopolitical conflict on global private label food and beverages market

7. Five Forces Analysis

7.1 Five forces summary

Five forces analysis - Comparison between 2025 and 2030

7.2 Bargaining power of buyers

Bargaining power of buyers - Impact of key factors 2025 and 2030

7.3 Bargaining power of suppliers

Bargaining power of suppliers - Impact of key factors in 2025 and 2030

7.4 Threat of new entrants

Threat of new entrants - Impact of key factors in 2025 and 2030

7.5 Threat of substitutes

Threat of substitutes - Impact of key factors in 2025 and 2030

7.6 Threat of rivalry

Threat of rivalry - Impact of key factors in 2025 and 2030

7.7 Market condition

Chart on Market condition - Five forces 2025 and 2030

8. Market Segmentation by Distribution Channel

8.1 Market segments

Chart on Distribution Channel - Market share 2025-2030 (%)
Data Table on Distribution Channel - Market share 2025-2030 (%)

8.2 Comparison by Distribution Channel

Chart on Comparison by Distribution Channel
Data Table on Comparison by Distribution Channel

8.3 Offline - Market size and forecast 2025-2030

Chart on Offline - Market size and forecast 2025-2030 ($ billion)
Data Table on Offline - Market size and forecast 2025-2030 ($ billion)
Chart on Offline - Year-over-year growth 2025-2030 (%)
Data Table on Offline - Year-over-year growth 2025-2030 (%)

8.4 Online - Market size and forecast 2025-2030

Chart on Online - Market size and forecast 2025-2030 ($ billion)
Data Table on Online - Market size and forecast 2025-2030 ($ billion)
Chart on Online - Year-over-year growth 2025-2030 (%)
Data Table on Online - Year-over-year growth 2025-2030 (%)

8.5 Market opportunity by Distribution Channel

Market opportunity by Distribution Channel ($ billion)
Data Table on Market opportunity by Distribution Channel ($ billion)

9. Market Segmentation by Product

9.1 Market segments

Chart on Product - Market share 2025-2030 (%)
Data Table on Product - Market share 2025-2030 (%)

9.2 Comparison by Product

Chart on Comparison by Product
Data Table on Comparison by Product

9.3 Food - Market size and forecast 2025-2030

Chart on Food - Market size and forecast 2025-2030 ($ billion)
Data Table on Food - Market size and forecast 2025-2030 ($ billion)
Chart on Food - Year-over-year growth 2025-2030 (%)
Data Table on Food - Year-over-year growth 2025-2030 (%)

9.4 Beverages - Market size and forecast 2025-2030

Chart on Beverages - Market size and forecast 2025-2030 ($ billion)
Data Table on Beverages - Market size and forecast 2025-2030 ($ billion)
Chart on Beverages - Year-over-year growth 2025-2030 (%)
Data Table on Beverages - Year-over-year growth 2025-2030 (%)

9.5 Market opportunity by Product

Market opportunity by Product ($ billion)
Data Table on Market opportunity by Product ($ billion)

10. Market Segmentation by Price Range

10.1 Market segments

Chart on Price Range - Market share 2025-2030 (%)
Data Table on Price Range - Market share 2025-2030 (%)

10.2 Comparison by Price Range

Chart on Comparison by Price Range
Data Table on Comparison by Price Range

10.3 Mid-range - Market size and forecast 2025-2030

Chart on Mid-range - Market size and forecast 2025-2030 ($ billion)
Data Table on Mid-range - Market size and forecast 2025-2030 ($ billion)
Chart on Mid-range - Year-over-year growth 2025-2030 (%)
Data Table on Mid-range - Year-over-year growth 2025-2030 (%)

10.4 Economy - Market size and forecast 2025-2030

Chart on Economy - Market size and forecast 2025-2030 ($ billion)
Data Table on Economy - Market size and forecast 2025-2030 ($ billion)
Chart on Economy - Year-over-year growth 2025-2030 (%)
Data Table on Economy - Year-over-year growth 2025-2030 (%)

10.5 Premium - Market size and forecast 2025-2030

Chart on Premium - Market size and forecast 2025-2030 ($ billion)
Data Table on Premium - Market size and forecast 2025-2030 ($ billion)
Chart on Premium - Year-over-year growth 2025-2030 (%)
Data Table on Premium - Year-over-year growth 2025-2030 (%)

10.6 Market opportunity by Price Range

Market opportunity by Price Range ($ billion)
Data Table on Market opportunity by Price Range ($ billion)

11. Customer Landscape

11.1 Customer landscape overview

Analysis of price sensitivity, lifecycle, customer purchase basket, adoption rates, and purchase criteria

12. Geographic Landscape

12.1 Geographic segmentation

Chart on Market share by geography 2025-2030 (%)
Data Table on Market share by geography 2025-2030 (%)

12.2 Geographic comparison

Chart on Geographic comparison
Data Table on Geographic comparison

12.3 Europe - Market size and forecast 2025-2030

Chart on Europe - Market size and forecast 2025-2030 ($ billion)
Data Table on Europe - Market size and forecast 2025-2030 ($ billion)
Chart on Europe - Year-over-year growth 2025-2030 (%)
Data Table on Europe - Year-over-year growth 2025-2030 (%)
Chart on Regional Comparison - Europe
Data Table on Regional Comparison - Europe

12.3.1 Germany - Market size and forecast 2025-2030

Chart on Germany - Market size and forecast 2025-2030 ($ billion)
Data Table on Germany - Market size and forecast 2025-2030 ($ billion)
Chart on Germany - Year-over-year growth 2025-2030 (%)
Data Table on Germany - Year-over-year growth 2025-2030 (%)

12.3.2 UK - Market size and forecast 2025-2030

Chart on UK - Market size and forecast 2025-2030 ($ billion)
Data Table on UK - Market size and forecast 2025-2030 ($ billion)
Chart on UK - Year-over-year growth 2025-2030 (%)
Data Table on UK - Year-over-year growth 2025-2030 (%)

12.3.3 France - Market size and forecast 2025-2030

Chart on France - Market size and forecast 2025-2030 ($ billion)
Data Table on France - Market size and forecast 2025-2030 ($ billion)
Chart on France - Year-over-year growth 2025-2030 (%)
Data Table on France - Year-over-year growth 2025-2030 (%)

12.3.4 Italy - Market size and forecast 2025-2030

Chart on Italy - Market size and forecast 2025-2030 ($ billion)
Data Table on Italy - Market size and forecast 2025-2030 ($ billion)
Chart on Italy - Year-over-year growth 2025-2030 (%)
Data Table on Italy - Year-over-year growth 2025-2030 (%)

12.3.5 Spain - Market size and forecast 2025-2030

Chart on Spain - Market size and forecast 2025-2030 ($ billion)
Data Table on Spain - Market size and forecast 2025-2030 ($ billion)
Chart on Spain - Year-over-year growth 2025-2030 (%)
Data Table on Spain - Year-over-year growth 2025-2030 (%)

12.3.6 The Netherlands - Market size and forecast 2025-2030

Chart on The Netherlands - Market size and forecast 2025-2030 ($ billion)
Data Table on The Netherlands - Market size and forecast 2025-2030 ($ billion)
Chart on The Netherlands - Year-over-year growth 2025-2030 (%)
Data Table on The Netherlands - Year-over-year growth 2025-2030 (%)

12.4 North America - Market size and forecast 2025-2030

Chart on North America - Market size and forecast 2025-2030 ($ billion)
Data Table on North America - Market size and forecast 2025-2030 ($ billion)
Chart on North America - Year-over-year growth 2025-2030 (%)
Data Table on North America - Year-over-year growth 2025-2030 (%)
Chart on Regional Comparison - North America
Data Table on Regional Comparison - North America

12.4.1 US - Market size and forecast 2025-2030

Chart on US - Market size and forecast 2025-2030 ($ billion)
Data Table on US - Market size and forecast 2025-2030 ($ billion)
Chart on US - Year-over-year growth 2025-2030 (%)
Data Table on US - Year-over-year growth 2025-2030 (%)

12.4.2 Canada - Market size and forecast 2025-2030

Chart on Canada - Market size and forecast 2025-2030 ($ billion)
Data Table on Canada - Market size and forecast 2025-2030 ($ billion)
Chart on Canada - Year-over-year growth 2025-2030 (%)
Data Table on Canada - Year-over-year growth 2025-2030 (%)

12.4.3 Mexico - Market size and forecast 2025-2030

Chart on Mexico - Market size and forecast 2025-2030 ($ billion)
Data Table on Mexico - Market size and forecast 2025-2030 ($ billion)
Chart on Mexico - Year-over-year growth 2025-2030 (%)
Data Table on Mexico - Year-over-year growth 2025-2030 (%)

12.5 APAC - Market size and forecast 2025-2030

Chart on APAC - Market size and forecast 2025-2030 ($ billion)
Data Table on APAC - Market size and forecast 2025-2030 ($ billion)
Chart on APAC - Year-over-year growth 2025-2030 (%)
Data Table on APAC - Year-over-year growth 2025-2030 (%)
Chart on Regional Comparison - APAC
Data Table on Regional Comparison - APAC

12.5.1 China - Market size and forecast 2025-2030

Chart on China - Market size and forecast 2025-2030 ($ billion)
Data Table on China - Market size and forecast 2025-2030 ($ billion)
Chart on China - Year-over-year growth 2025-2030 (%)
Data Table on China - Year-over-year growth 2025-2030 (%)

12.5.2 Japan - Market size and forecast 2025-2030

Chart on Japan - Market size and forecast 2025-2030 ($ billion)
Data Table on Japan - Market size and forecast 2025-2030 ($ billion)
Chart on Japan - Year-over-year growth 2025-2030 (%)
Data Table on Japan - Year-over-year growth 2025-2030 (%)

12.5.3 India - Market size and forecast 2025-2030

Chart on India - Market size and forecast 2025-2030 ($ billion)
Data Table on India - Market size and forecast 2025-2030 ($ billion)
Chart on India - Year-over-year growth 2025-2030 (%)
Data Table on India - Year-over-year growth 2025-2030 (%)

12.5.4 South Korea - Market size and forecast 2025-2030

Chart on South Korea - Market size and forecast 2025-2030 ($ billion)
Data Table on South Korea - Market size and forecast 2025-2030 ($ billion)
Chart on South Korea - Year-over-year growth 2025-2030 (%)
Data Table on South Korea - Year-over-year growth 2025-2030 (%)

12.5.5 Australia - Market size and forecast 2025-2030

Chart on Australia - Market size and forecast 2025-2030 ($ billion)
Data Table on Australia - Market size and forecast 2025-2030 ($ billion)
Chart on Australia - Year-over-year growth 2025-2030 (%)
Data Table on Australia - Year-over-year growth 2025-2030 (%)

12.5.6 Indonesia - Market size and forecast 2025-2030

Chart on Indonesia - Market size and forecast 2025-2030 ($ billion)
Data Table on Indonesia - Market size and forecast 2025-2030 ($ billion)
Chart on Indonesia - Year-over-year growth 2025-2030 (%)
Data Table on Indonesia - Year-over-year growth 2025-2030 (%)

12.6 Middle East and Africa - Market size and forecast 2025-2030

Chart on Middle East and Africa - Market size and forecast 2025-2030 ($ billion)
Data Table on Middle East and Africa - Market size and forecast 2025-2030 ($ billion)
Chart on Middle East and Africa - Year-over-year growth 2025-2030 (%)
Data Table on Middle East and Africa - Year-over-year growth 2025-2030 (%)
Chart on Regional Comparison - Middle East and Africa
Data Table on Regional Comparison - Middle East and Africa

12.6.1 Saudi Arabia - Market size and forecast 2025-2030

Chart on Saudi Arabia - Market size and forecast 2025-2030 ($ billion)
Data Table on Saudi Arabia - Market size and forecast 2025-2030 ($ billion)
Chart on Saudi Arabia - Year-over-year growth 2025-2030 (%)
Data Table on Saudi Arabia - Year-over-year growth 2025-2030 (%)

12.6.2 UAE - Market size and forecast 2025-2030

Chart on UAE - Market size and forecast 2025-2030 ($ billion)
Data Table on UAE - Market size and forecast 2025-2030 ($ billion)
Chart on UAE - Year-over-year growth 2025-2030 (%)
Data Table on UAE - Year-over-year growth 2025-2030 (%)

12.6.3 South Africa - Market size and forecast 2025-2030

Chart on South Africa - Market size and forecast 2025-2030 ($ billion)
Data Table on South Africa - Market size and forecast 2025-2030 ($ billion)
Chart on South Africa - Year-over-year growth 2025-2030 (%)
Data Table on South Africa - Year-over-year growth 2025-2030 (%)

12.6.4 Israel - Market size and forecast 2025-2030

Chart on Israel - Market size and forecast 2025-2030 ($ billion)
Data Table on Israel - Market size and forecast 2025-2030 ($ billion)
Chart on Israel - Year-over-year growth 2025-2030 (%)
Data Table on Israel - Year-over-year growth 2025-2030 (%)

12.6.5 Turkey - Market size and forecast 2025-2030

Chart on Turkey - Market size and forecast 2025-2030 ($ billion)
Data Table on Turkey - Market size and forecast 2025-2030 ($ billion)
Chart on Turkey - Year-over-year growth 2025-2030 (%)
Data Table on Turkey - Year-over-year growth 2025-2030 (%)

12.7 South America - Market size and forecast 2025-2030

Chart on South America - Market size and forecast 2025-2030 ($ billion)
Data Table on South America - Market size and forecast 2025-2030 ($ billion)
Chart on South America - Year-over-year growth 2025-2030 (%)
Data Table on South America - Year-over-year growth 2025-2030 (%)
Chart on Regional Comparison - South America
Data Table on Regional Comparison - South America

12.7.1 Brazil - Market size and forecast 2025-2030

Chart on Brazil - Market size and forecast 2025-2030 ($ billion)
Data Table on Brazil - Market size and forecast 2025-2030 ($ billion)
Chart on Brazil - Year-over-year growth 2025-2030 (%)
Data Table on Brazil - Year-over-year growth 2025-2030 (%)

12.7.2 Argentina - Market size and forecast 2025-2030

Chart on Argentina - Market size and forecast 2025-2030 ($ billion)
Data Table on Argentina - Market size and forecast 2025-2030 ($ billion)
Chart on Argentina - Year-over-year growth 2025-2030 (%)
Data Table on Argentina - Year-over-year growth 2025-2030 (%)

12.7.3 Chile - Market size and forecast 2025-2030

Chart on Chile - Market size and forecast 2025-2030 ($ billion)
Data Table on Chile - Market size and forecast 2025-2030 ($ billion)
Chart on Chile - Year-over-year growth 2025-2030 (%)
Data Table on Chile - Year-over-year growth 2025-2030 (%)

12.8 Market opportunity by geography

Market opportunity by geography ($ billion)
Data Tables on Market opportunity by geography ($ billion)

13. Drivers, Challenges, and Opportunity

13.1 Market drivers

Economic volatility and consumer price sensitivity
Premiumization and brand sophistication
Retailer strategic investment and channel expansion

13.2 Market challenges

Supply chain fragmentation and raw material volatility
Intense competition and brand loyalty resistance
Regulatory compliance and sustainability mandates

13.3 Impact of drivers and challenges

Impact of drivers and challenges in 2025 and 2030

13.4 Market opportunities

Expansion of functional health and personalized wellness tiers
Aggressive premiumization and gourmet differentiation
Digitization and omni-channel brand integration

14. Competitive Landscape

14.1 Overview

14.2

Overview on criticality of inputs and factors of differentiation

14.3 Landscape disruption

Overview on factors of disruption

14.4 Industry risks

Impact of key risks on business

15. Competitive Analysis

15.1 Companies profiled

Companies covered

15.2 Company ranking index

15.3 Market positioning of companies

Matrix on companies position and classification

15.4 Associated British Foods Plc

Associated British Foods Plc - Overview
Associated British Foods Plc - Business segments
Associated British Foods Plc - Key offerings
Associated British Foods Plc - Segment focus
SWOT

15.5 B and G Foods Inc.

B and G Foods Inc. - Overview
B and G Foods Inc. - Business segments
B and G Foods Inc. - Key news
B and G Foods Inc. - Key offerings
B and G Foods Inc. - Segment focus
SWOT

15.6 Conagra Brands Inc.

Conagra Brands Inc. - Overview
Conagra Brands Inc. - Business segments
Conagra Brands Inc. - Key offerings
Conagra Brands Inc. - Segment focus
SWOT

15.7 Corporativo Bimbo SA de CV

Corporativo Bimbo SA de CV - Overview
Corporativo Bimbo SA de CV - Business segments
Corporativo Bimbo SA de CV - Key offerings
Corporativo Bimbo SA de CV - Segment focus
SWOT

15.8 Froneri International Ltd.

Froneri International Ltd. - Overview
Froneri International Ltd. - Product / Service
Froneri International Ltd. - Key offerings
SWOT

15.9 Hormel Foods Corp.

Hormel Foods Corp. - Overview
Hormel Foods Corp. - Business segments
Hormel Foods Corp. - Key offerings
Hormel Foods Corp. - Segment focus
SWOT

15.10 McCormick and Co. Inc.

McCormick and Co. Inc. - Overview
McCormick and Co. Inc. - Business segments
McCormick and Co. Inc. - Key offerings
McCormick and Co. Inc. - Segment focus
SWOT

15.11 Nomad Foods Ltd.

Nomad Foods Ltd. - Overview
Nomad Foods Ltd. - Product / Service
Nomad Foods Ltd. - Key offerings
SWOT

15.12 Post Holdings Inc.

Post Holdings Inc. - Overview
Post Holdings Inc. - Business segments
Post Holdings Inc. - Key offerings
Post Holdings Inc. - Segment focus
SWOT

15.13 Primo Water Corp.

Primo Water Corp. - Overview
Primo Water Corp. - Business segments
Primo Water Corp. - Key offerings
Primo Water Corp. - Segment focus
SWOT

15.14 Seneca Foods Corp.

Seneca Foods Corp. - Overview
Seneca Foods Corp. - Product / Service
Seneca Foods Corp. - Key offerings
SWOT

15.15 The Hain Celestial Group

The Hain Celestial Group - Overview
The Hain Celestial Group - Business segments
The Hain Celestial Group - Key news
The Hain Celestial Group - Key offerings
The Hain Celestial Group - Segment focus
SWOT

15.16 The J.M. Smucker Co.

The J.M. Smucker Co. - Overview
The J.M. Smucker Co. - Business segments
The J.M. Smucker Co. - Key news
The J.M. Smucker Co. - Key offerings
The J.M. Smucker Co. - Segment focus
SWOT

15.17 TreeHouse Foods Inc.

TreeHouse Foods Inc. - Overview
TreeHouse Foods Inc. - Business segments
TreeHouse Foods Inc. - Key offerings
TreeHouse Foods Inc. - Segment focus
SWOT

15.18 Unilever PLC

Unilever PLC - Overview
Unilever PLC - Business segments
Unilever PLC - Key news
Unilever PLC - Key offerings
Unilever PLC - Segment focus
SWOT

16. Appendix

16.1 Scope of the report

Market definition
Objectives
Notes and caveats

16.2 Inclusions and exclusions checklist

Inclusions checklist
Exclusions checklist

16.3 Currency conversion rates for US$

16.4 Research methodology

16.5 Data procurement

Information sources

16.6 Data validation

16.7 Validation techniques employed for market sizing

16.8 Data synthesis

16.9 360 degree market analysis

16.10 List of abbreviations

Research Methodology

Technavio presents a detailed picture of the market by way of study, synthesis, and summation of data from multiple sources. The analysts have presented the various facets of the market with a particular focus on identifying the key industry influencers. The data thus presented is comprehensive, reliable, and the result of extensive research, both primary and secondary.

INFORMATION SOURCES

Primary sources

  • Manufacturers and suppliers
  • Channel partners
  • Industry experts
  • Strategic decision makers

Secondary sources

  • Industry journals and periodicals
  • Government data
  • Financial reports of key industry players
  • Historical data
  • Press releases

DATA ANALYSIS

Data Synthesis

  • Collation of data
  • Estimation of key figures
  • Analysis of derived insights

Data Validation

  • Triangulation with data models
  • Reference against proprietary databases
  • Corroboration with industry experts

REPORT WRITING

Qualitative

  • Market drivers
  • Market challenges
  • Market trends
  • Five forces analysis

Quantitative

  • Market size and forecast
  • Market segmentation
  • Geographical insights
  • Competitive landscape

Interested in this report?

Get your sample now to see our research methodology and insights!

Download Now

Frequently Asked Questions

Private Label Food And Beverages market growth will increase by USD 220.3 billion during 2026-2030.

The Private Label Food And Beverages market is expected to grow at a CAGR of 7% during 2026-2030.

Private Label Food And Beverages market is segmented by Distribution channel (Offline, Online) Product (Food, Beverages) Price range (Mid-range, Economy, Premium)

ARYZTA AG, Associated British Foods Plc, B and G Foods Inc., Conagra Brands Inc., Corporativo Bimbo SA de CV, Del Monte Foods Corp, Froneri International Ltd., Groupe Lactalis, Hormel Foods Corp., McCormick and Co. Inc., Nomad Foods Ltd., Post Holdings Inc., Primo Water Corp., Seneca Foods Corp., Sovos Compliance LLC., SunOpta Inc., The Hain Celestial Group, The J.M. Smucker Co., TreeHouse Foods Inc., Unilever PLC are a few of the key vendors in the Private Label Food And Beverages market.

Europe will register the highest growth rate of 39.9% among the other regions. Therefore, the Private Label Food And Beverages market in Europe is expected to garner significant business opportunities for the vendors during the forecast period.

Germany, UK, France, Italy, Spain, The Netherlands, US, Canada, Mexico, China, Japan, India, South Korea, Australia, Indonesia, Saudi Arabia, UAE, South Africa, Israel, Turkey, Brazil, Argentina, Chile

  • Economic volatility and consumer price sensitivity is the driving factor this market.

The Private Label Food And Beverages market vendors should focus on grabbing business opportunities from the Distribution channel segment as it accounted for the largest market share in the base year.
RIA - Research AI Assistant
Ask RIA