Corrugated Box Market Analysis, Size, and Forecast 2026-2030: APAC (China, India, and Japan), Europe (Germany, UK, and France), North America (US, Canada, and Mexico), South America (Brazil, Argentina, and Colombia), Middle East and Africa (Saudi Arabia, UAE, and South Africa), and Rest of World (ROW)

Corrugated Box Market Analysis, Size, and Forecast 2026-2030:
APAC (China, India, and Japan), Europe (Germany, UK, and France), North America (US, Canada, and Mexico), South America (Brazil, Argentina, and Colombia), Middle East and Africa (Saudi Arabia, UAE, and South Africa), and Rest of World (ROW)

Published: Mar 2026 295 Pages SKU: IRTNTR41051

Market Overview at a Glance

$16.02 B
Market Opportunity
4.2%
CAGR 2025 - 2030
60.8%
APAC Growth
$27.87 B
Food and beverage segment 2024

Corrugated Box Market Size 2026-2030

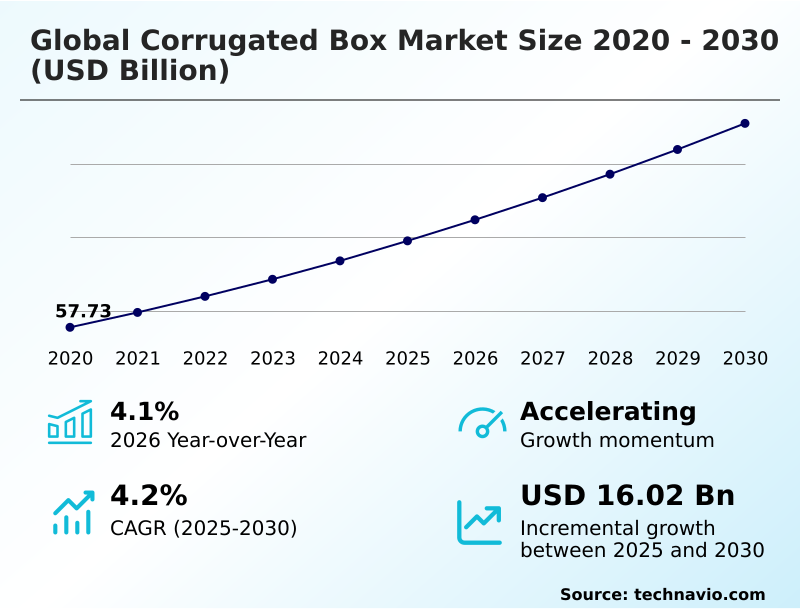
The corrugated box market size is valued to increase by USD 16.02 billion, at a CAGR of 4.2% from 2025 to 2030. Proliferation of global E-commerce and digital retail logistics will drive the corrugated box market.

Major Market Trends & Insights

  • APAC dominated the market and accounted for a 60.8% growth during the forecast period.
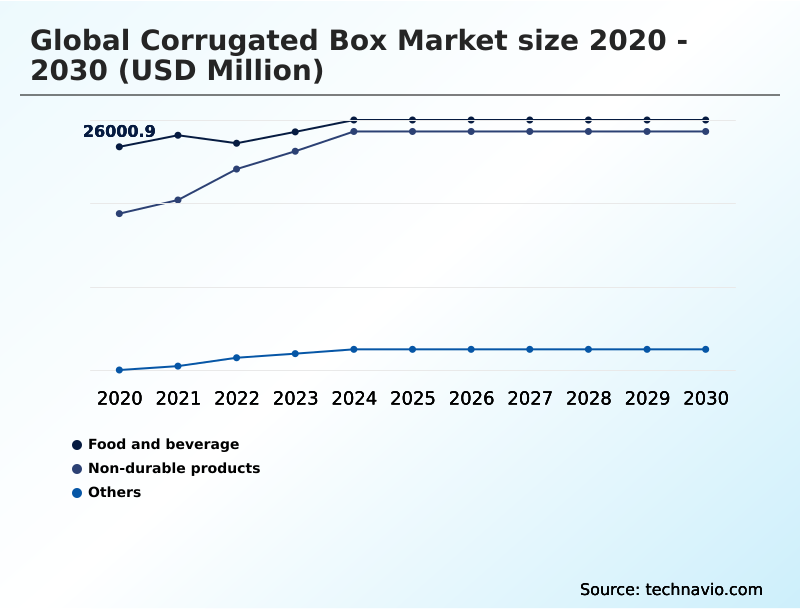
  • By End-user - Food and beverage segment was valued at USD 27.87 billion in 2024
  • By Application - Linerboard segment accounted for the largest market revenue share in 2024

Market Size & Forecast

  • Market Opportunities: USD 27.80 billion
  • Market Future Opportunities: USD 16.02 billion
  • CAGR from 2025 to 2030 : 4.2%

Market Summary

  • The corrugated box market is undergoing a significant transformation, driven by shifts toward circular economy models and advanced logistics. As a cornerstone of the global supply chain, this sector provides the essential medium for transporting everything from consumer electronics to perishable foods.
  • The recyclability of fiber-based materials has made corrugated solutions a preferred alternative to plastic packaging, especially as regulations on single-use materials tighten. A key business scenario involves a large food distributor optimizing its cold chain logistics. By adopting corrugated boxes with advanced moisture-resistant coatings and integrating box-on-demand systems, the company can reduce material waste and achieve right-sizing for its shipments.
  • This not only lowers dimensional weight and freight costs but also improves product protection, reducing spoilage rates. Innovations in linerboard quality and fluting designs allow for material lightweighting without sacrificing stacking strength.
  • Furthermore, the integration of digital printing technologies is transforming the corrugated box from a simple container into a high-value marketing asset, enabling brands to customize packaging and enhance the consumer unboxing experience. This evolution reflects the market's adaptation to the dual demands of logistical efficiency and brand communication.

What will be the Size of the Corrugated Box Market during the forecast period?

Get Key Insights on Market Forecast (PDF) Request Free Sample

How is the Corrugated Box Market Segmented?

The corrugated box industry research report provides comprehensive data (region-wise segment analysis), with forecasts and estimates in "USD million" for the period 2026-2030, as well as historical data from 2020-2024 for the following segments.

  • End-user
    • Food and beverage
    • Non-durable products
    • Others
  • Application
    • Linerboard
    • Corrugating medium
  • Grade type
    • Lightweight grade
    • Medium‑weight grade
    • High‑burst grade
  • Geography
    • APAC
      • China
      • India
      • Japan
    • Europe
      • Germany
      • UK
      • France
    • North America
      • US
      • Canada
      • Mexico
    • South America
      • Brazil
      • Argentina
      • Colombia
    • Middle East and Africa
      • Saudi Arabia
      • UAE
      • South Africa
    • Rest of World (ROW)

By End-user Insights

The food and beverage segment is estimated to witness significant growth during the forecast period.

The food and beverage segment is a primary user of corrugated boxes, functioning as critical secondary packaging. The rise of e-commerce grocery services and the demand for high-graphic corrugated boxes for shelf-ready packaging are key factors.

Advanced moisture-resistant coatings have expanded the use of paper-based packaging into cold chain logistics, where a lightweight grade with a specialized corrugating medium can offer protection without adding significant dimensional weight.

These coatings have improved product integrity during transit by over 15%. This shift enhances the unboxing experience and supports the use of custom shipping boxes.

Innovations in micro-fluting technologies are growing for premium goods, while some bulk liquids utilize a form of triple-wall construction, replacing what was once a medium-weight grade application.

Request Free Sample

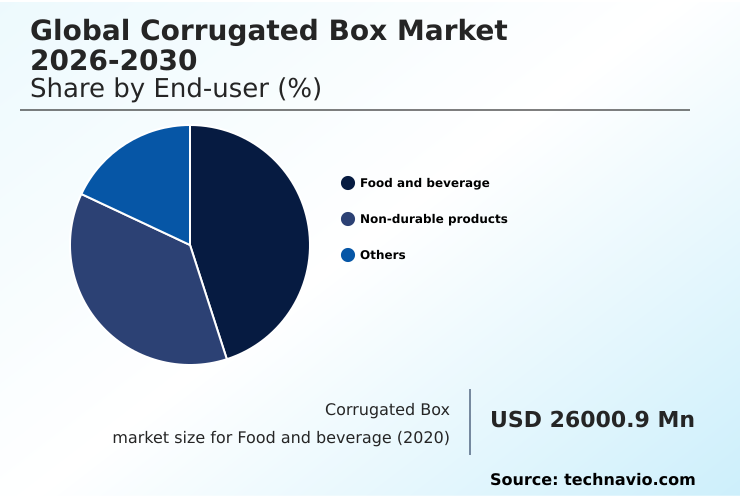
The Food and beverage segment was valued at USD 27.87 billion in 2024 and showed a gradual increase during the forecast period.

Request Free Sample

Regional Analysis

APAC is estimated to contribute 60.8% to the growth of the global market during the forecast period.Technavio’s analysts have elaborately explained the regional trends and drivers that shape the market during the forecast period.

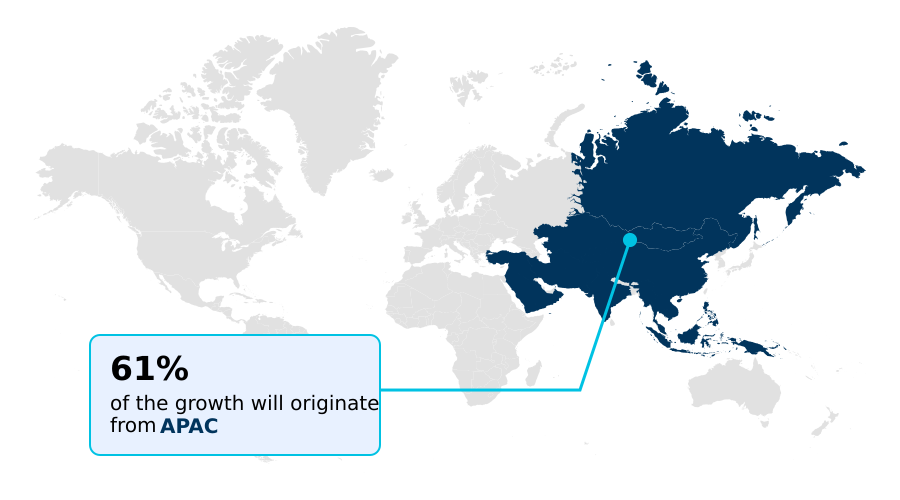
See How Corrugated Box Market Demand is Rising in APAC Request Free Sample

The geographic landscape is dominated by the APAC region, accounting for over 60% of incremental growth due to its massive manufacturing base for industrial packaging and consumer goods packaging.

In contrast, Europe's market, focused on supply chain optimization, is driven by stringent regulations mandating sustainable packaging solutions; its high recycling rates provide a steady stream of material for testliner.

North America emphasizes performance, with a high demand for double-wall corrugated boxes with advanced fluting designs to ensure stacking strength for logistics networks. Innovations in aseptic packaging for food and beverage packaging are prominent in both Europe and North America.

The use of high-quality kraft linerboard is common for exports from all regions, while the push for returnable packaging systems is gaining traction globally.

Market Dynamics

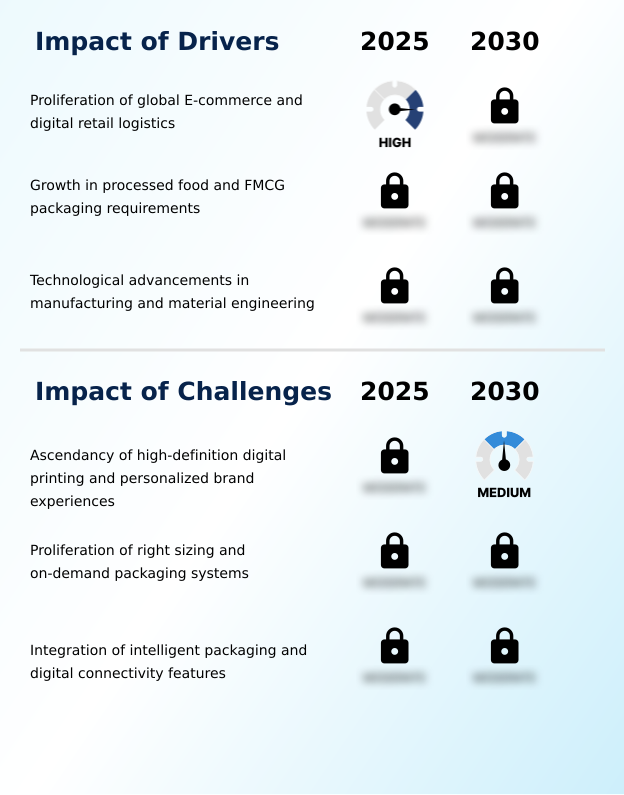
Our researchers analyzed the data with 2025 as the base year, along with the key drivers, trends, and challenges. A holistic analysis of drivers will help companies refine their marketing strategies to gain a competitive advantage.

  • The corrugated box market is advancing beyond standard containers, with innovation centered on specialized applications. The development of high-strength lightweight corrugated paper is critical for air freight and e-commerce, where every gram impacts cost. This pairs with right-sizing technology for packaging optimization, which uses automated fit-to-product packaging systems to minimize waste.
  • For high-value goods, smart packaging for supply chain transparency is becoming standard, using embedded sensors for real-time tracking. Custom corrugated shipping containers design now incorporates advanced coatings for food contact safety and tamper-evident features for pharmaceutical security. The industry is also exploring bio-based resins for enhanced burst strength, improving the performance of multi-wall corrugated for heavy machinery without compromising sustainability.
  • For agricultural exports, moisture-resistant corrugated board for agriculture is essential for corrugated packaging for cold chain integrity. From a material perspective, linerboard quality for high-resolution printing is a key differentiator, as is the corrugating medium for compression strength.
  • The use of lightweight grade corrugated for e-commerce contrasts with medium-weight grade for industrial goods and high-burst grade for hazardous materials, demonstrating the market's segmentation. Across all grades, increasing recycled fiber content in containerboard and finding sustainable alternatives to plastic void-fill are universal goals, pushing the industry toward more advanced circular economy models in paper packaging.
  • Companies adopting these technologies report a significantly higher product-in-transit survival rate compared to those using traditional, non-specialized packaging.

What are the key market drivers leading to the rise in the adoption of Corrugated Box Industry?

  • The proliferation of global e-commerce and the intricate logistics of digital retail are primary drivers propelling market growth.

  • The primary market driver is the relentless growth of e-commerce fulfillment and the direct-to-consumer business model, which demand efficient supply chain optimization.
  • This has accelerated the adoption of on-demand packaging solutions like box-on-demand systems, which utilize right-sizing technology to reduce material use by an average of 30%.
  • The focus on lightweighting, using high-performance liners in paper-based packaging, has lowered shipping costs for 65% of high-volume shippers.
  • Technologically, advancements in die cutting and fiber recovery systems enhance the viability of using secondary fibers from old corrugated containers, making recycled content more cost-effective.
  • These drivers converge to create a market focused on minimizing waste, reducing freight expenses, and maximizing the efficiency of packaging operations from the factory floor to the consumer's doorstep.

What are the market trends shaping the Corrugated Box Industry?

  • The rapid expansion of e-commerce fulfillment is converging with the logistical complexities of omnichannel retail. This creates a significant, ongoing trend within the market.

  • Market trends are driven by digitization and customization. The adoption of digital inkjet printing over traditional flexographic printing allows for cost-effective, short-run production of retail-ready packaging, reducing setup times by up to 90%. This enables brands to create modular designs for seasonal campaigns. Concurrently, smart packaging technology is gaining traction.
  • The integration of quick response codes and radio frequency identification tags is improving traceability in the last-mile delivery stage, with some logistics firms reporting a 15% reduction in lost parcels. For product protection, there is a clear shift away from plastic void-fill materials toward sustainable inserts like molded pulp.
  • These trends are supported by automated packaging systems that create tamper-evident designs and align with emerging digital product passport requirements, transforming the package into a data-rich asset.

What challenges does the Corrugated Box Industry face during its growth?

  • The ascendancy of high-definition digital printing and the demand for personalized brand experiences present a significant challenge, driving capital investment and operational complexity.

  • Significant challenges stem from raw material volatility and regulatory pressures. Fluctuating pulp prices and the consolidation of paper mills create an unpredictable cost environment for virgin kraft paper and containerboard. While recycled fiber technologies offer an alternative, inconsistent quality can affect performance metrics like the edge crush test and burst strength, compromising the reliability of protective packaging.
  • This impacts supply chain resilience, as some manufacturers have reported a 10% failure rate increase when using lower-grade recycled content for heavy-duty corrugated containers. Furthermore, new extended producer responsibility laws in several regions are holding producers financially accountable for packaging waste, adding up to 5% to the cost of goods.
  • This forces a difficult balance between meeting circular economy principles and maintaining profitability, especially when competing with single-use plastics alternatives on price.

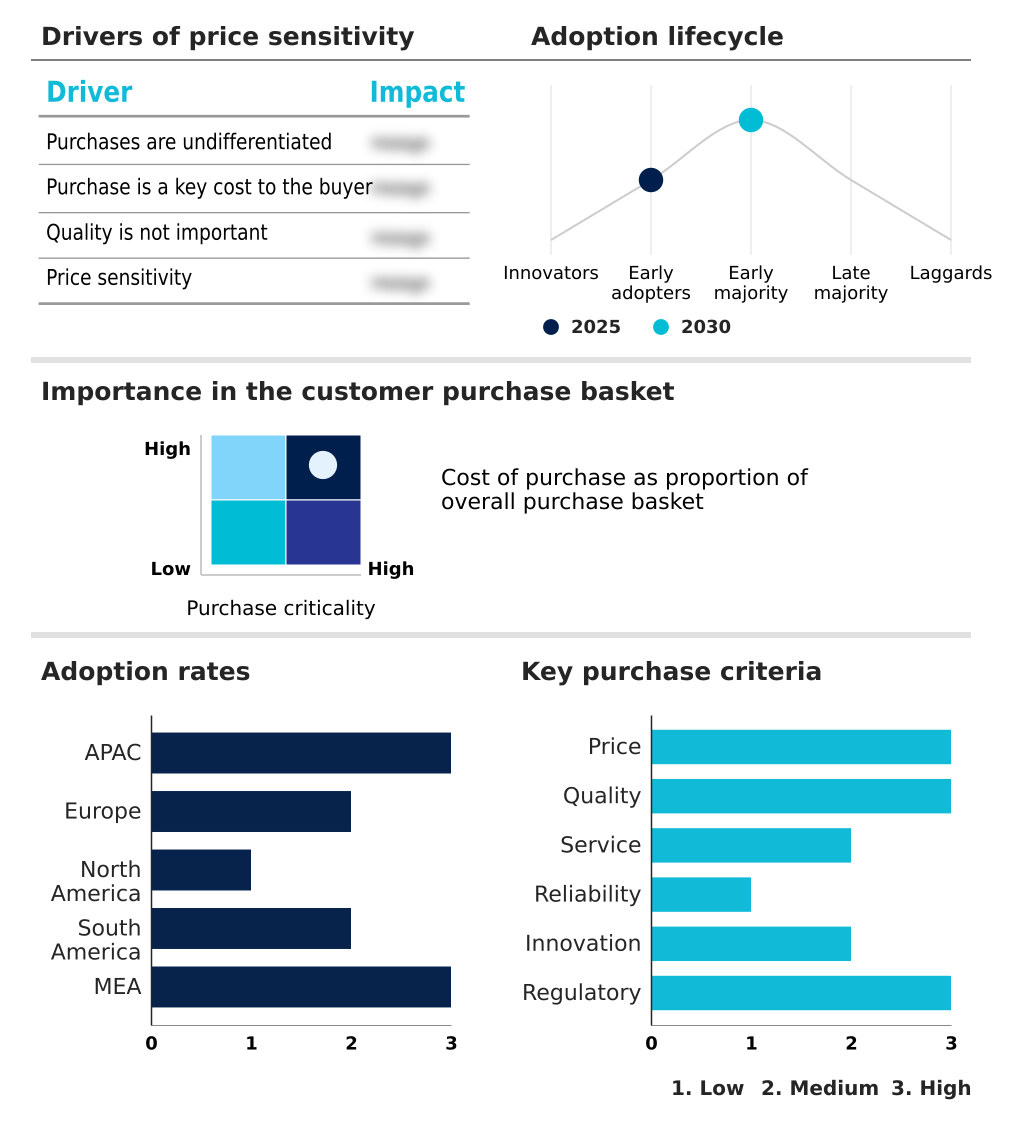
Exclusive Technavio Analysis on Customer Landscape

The corrugated box market forecasting report includes the adoption lifecycle of the market, covering from the innovator’s stage to the laggard’s stage. It focuses on adoption rates in different regions based on penetration. Furthermore, the corrugated box market report also includes key purchase criteria and drivers of price sensitivity to help companies evaluate and develop their market growth analysis strategies.

Customer Landscape of Corrugated Box Industry

Competitive Landscape

Companies are implementing various strategies, such as strategic alliances, corrugated box market forecast, partnerships, mergers and acquisitions, geographical expansion, and product/service launches, to enhance their presence in the industry.

Alliance Packaging - Key offerings focus on integrated, sustainable packaging solutions, including custom corrugated containers, retail-ready displays, and advanced industrial packaging designed for comprehensive supply chain optimization.

The industry research and growth report includes detailed analyses of the competitive landscape of the market and information about key companies, including:

  • Alliance Packaging
  • Bio pappel
  • DS Smith Plc
  • Georgia Pacific LLC
  • Green Bay Packaging Inc.
  • International Paper Co.
  • Klabin S.A.
  • Lee and Man Paper Manufacturing
  • Menasha Corp
  • Mondi Plc
  • Nine Dragons Paper Holdings Ltd.
  • Packaging Corp. of America
  • Pratt Industries Inc.
  • Rengo Co. Ltd.
  • S.A Industrias Celulosa Aragonesa
  • Shanying International Holding
  • Smurfit Westrock plc
  • Stora Enso Oyj
  • THIMM Group GmbH plus Co. KG

Qualitative and quantitative analysis of companies has been conducted to help clients understand the wider business environment as well as the strengths and weaknesses of key industry players. Data is qualitatively analyzed to categorize companies as pure play, category-focused, industry-focused, and diversified; it is quantitatively analyzed to categorize companies as dominant, leading, strong, tentative, and weak.

Recent Development and News in Corrugated box market

  • In January 2025, International Paper Co. completed its acquisition of DS Smith Plc for approximately $7.2 billion, creating a global leader in sustainable packaging with significant operations across North America and Europe.
  • In November 2024, a leading multinational food and beverage corporation launched a sustainable packaging strategy to make its portfolio 100% recyclable or reusable, emphasizing a shift to paper-based and corrugated solutions.
  • In August 2024, a major e-commerce retailer announced a 16% reduction in its global plastic packaging by expanding its use of 100% recycled paper fillers and paper-padded envelopes across its fulfillment network.
  • In May 2025, leading Chinese packaging firms reported a strategic pivot to domestic production of high-strength, lightweight corrugated paper to reduce reliance on raw material imports following stricter environmental protocols.

Dive into Technavio’s robust research methodology, blending expert interviews, extensive data synthesis, and validated models for unparalleled Corrugated Box Market insights. See full methodology.

Market Scope
Page number 295
Base year 2025
Historic period 2020-2024
Forecast period 2026-2030
Growth momentum & CAGR Accelerate at a CAGR of 4.2%
Market growth 2026-2030 USD 16018.2 million
Market structure Fragmented
YoY growth 2025-2026(%) 4.1%
Key countries China, India, Japan, South Korea, Indonesia, Vietnam, Germany, UK, France, Italy, Spain, The Netherlands, US, Canada, Mexico, Brazil, Argentina, Colombia, Saudi Arabia, UAE, South Africa, Egypt and Qatar
Competitive landscape Leading Companies, Market Positioning of Companies, Competitive Strategies, and Industry Risks

Request Free Sample

Research Analyst Overview

  • The corrugated box market's evolution is driven by material science and process innovation. Central to this is the engineering of corrugated fiberboard, where linerboard provides burst strength and the corrugating medium offers cushioning through optimized fluting designs. Manufacturers balance the use of virgin kraft paper, specifically kraft linerboard, with testliner made from old corrugated containers.
  • The push for lightweighting has spurred high-performance liners and micro-fluting technologies, reducing dimensional weight without sacrificing stacking strength. For heavy-duty applications, double-wall corrugated boxes and even triple-wall construction are standard.
  • A key boardroom decision involves balancing the cost of pulp prices from paper mills against investments in recycled fiber technologies and fiber recovery systems to improve the quality of secondary fibers. Operationally, box-on-demand systems and automated packaging systems are improving efficiency in die cutting and assembly of modular designs.
  • Digital inkjet printing and flexographic printing are transforming boxes into marketing tools, while moisture-resistant coatings and bio-based resins enhance physical properties, measured by the edge crush test.
  • This focus on material innovation, such as using molded pulp for inserts instead of void-fill materials, has allowed some firms to improve their product protection efficiency by over 20%, impacting everything from tamper-evident designs in aseptic packaging to the overall integrity of containerboard.

What are the Key Data Covered in this Corrugated Box Market Research and Growth Report?

  • What is the expected growth of the Corrugated Box Market between 2026 and 2030?

    • USD 16.02 billion, at a CAGR of 4.2%

  • What segmentation does the market report cover?

    • The report is segmented by End-user (Food and beverage, Non-durable products, and Others), Application (Linerboard, and Corrugating medium), Grade Type (Lightweight grade, Medium‑weight grade, and High‑burst grade) and Geography (APAC, Europe, North America, South America, Middle East and Africa)

  • Which regions are analyzed in the report?

    • APAC, Europe, North America, South America and Middle East and Africa

  • What are the key growth drivers and market challenges?

    • Proliferation of global E-commerce and digital retail logistics, Ascendancy of high-definition digital printing and personalized brand experiences

  • Who are the major players in the Corrugated Box Market?

    • Alliance Packaging, Bio pappel, DS Smith Plc, Georgia Pacific LLC, Green Bay Packaging Inc., International Paper Co., Klabin S.A., Lee and Man Paper Manufacturing, Menasha Corp, Mondi Plc, Nine Dragons Paper Holdings Ltd., Packaging Corp. of America, Pratt Industries Inc., Rengo Co. Ltd., S.A Industrias Celulosa Aragonesa, Shanying International Holding, Smurfit Westrock plc, Stora Enso Oyj and THIMM Group GmbH plus Co. KG

Market Research Insights

  • Market dynamics are increasingly shaped by the push for greater efficiency and sustainability. The adoption of on-demand packaging solutions, which create custom-sized boxes for each order, has been shown to reduce material consumption by up to 40%. This right-sizing technology directly impacts supply chain optimization, as it can lower dimensional weight shipping costs by an average of 25%.
  • Concurrently, the integration of smart packaging technology, such as RFID tags, is enhancing visibility. This allows companies to track assets through the supply chain with over 99% accuracy, improving inventory management and reducing losses, thereby providing a clear path to enhanced profitability and operational control.

We can help! Our analysts can customize this corrugated box market research report to meet your requirements.

Get in touch

1. Executive Summary

1.1 Market overview

Executive Summary - Chart on Market Overview
Executive Summary - Data Table on Market Overview
Executive Summary - Chart on Global Market Characteristics
Executive Summary - Chart on Market by Geography
Executive Summary - Chart on Market Segmentation by End-user
Executive Summary - Chart on Market Segmentation by Application
Executive Summary - Chart on Market Segmentation by Grade Type
Executive Summary - Chart on Incremental Growth
Executive Summary - Data Table on Incremental Growth
Executive Summary - Chart on Company Market Positioning

2. Technavio Analysis

2.1 Analysis of price sensitivity, lifecycle, customer purchase basket, adoption rates, and purchase criteria

2.2 Criticality of inputs and Factors of differentiation

Chart on Overview on criticality of inputs and factors of differentiation

2.3 Factors of disruption

Chart on Overview on factors of disruption

2.4 Impact of drivers and challenges

Chart on Impact of drivers and challenges in 2025 and 2030

3. Market Landscape

3.1 Market ecosystem

Chart on Parent Market
Data Table on - Parent Market

3.2 Market characteristics

Chart on Market characteristics analysis

3.3 Value chain analysis

Chart on Value chain analysis

4. Market Sizing

4.1 Market definition

Data Table on Offerings of companies included in the market definition

4.2 Market segment analysis

Market segments

4.3 Market size 2025

4.4 Market outlook: Forecast for 2025-2030

Chart on Global - Market size and forecast 2025-2030 ($ million)
Data Table on Global - Market size and forecast 2025-2030 ($ million)
Chart on Global Market: Year-over-year growth 2025-2030 (%)
Data Table on Global Market: Year-over-year growth 2025-2030 (%)

5. Historic Market Size

5.1 Global Corrugated Box Market 2020 - 2024

Historic Market Size - Data Table on Global Corrugated Box Market 2020 - 2024 ($ million)

5.2 End-user segment analysis 2020 - 2024

Historic Market Size - End-user Segment 2020 - 2024 ($ million)

5.3 Application segment analysis 2020 - 2024

Historic Market Size - Application Segment 2020 - 2024 ($ million)

5.4 Grade Type segment analysis 2020 - 2024

Historic Market Size - Grade Type Segment 2020 - 2024 ($ million)

5.5 Geography segment analysis 2020 - 2024

Historic Market Size - Geography Segment 2020 - 2024 ($ million)

5.6 Country segment analysis 2020 - 2024

Historic Market Size - Country Segment 2020 - 2024 ($ million)

6. Qualitative Analysis

6.1 Impact of AI on Global Corrugated Box Market

6.2 Impact of Geopolitical Conflict on Global Corrugated Box Market

7. Five Forces Analysis

7.1 Five forces summary

Five forces analysis - Comparison between 2025 and 2030

7.2 Bargaining power of buyers

Bargaining power of buyers - Impact of key factors 2025 and 2030

7.3 Bargaining power of suppliers

Bargaining power of suppliers - Impact of key factors in 2025 and 2030

7.4 Threat of new entrants

Threat of new entrants - Impact of key factors in 2025 and 2030

7.5 Threat of substitutes

Threat of substitutes - Impact of key factors in 2025 and 2030

7.6 Threat of rivalry

Threat of rivalry - Impact of key factors in 2025 and 2030

7.7 Market condition

Chart on Market condition - Five forces 2025 and 2030

8. Market Segmentation by End-user

8.1 Market segments

Chart on End-user - Market share 2025-2030 (%)
Data Table on End-user - Market share 2025-2030 (%)

8.2 Comparison by End-user

Chart on Comparison by End-user
Data Table on Comparison by End-user

8.3 Food and beverage - Market size and forecast 2025-2030

Chart on Food and beverage - Market size and forecast 2025-2030 ($ million)
Data Table on Food and beverage - Market size and forecast 2025-2030 ($ million)
Chart on Food and beverage - Year-over-year growth 2025-2030 (%)
Data Table on Food and beverage - Year-over-year growth 2025-2030 (%)

8.4 Non-durable products - Market size and forecast 2025-2030

Chart on Non-durable products - Market size and forecast 2025-2030 ($ million)
Data Table on Non-durable products - Market size and forecast 2025-2030 ($ million)
Chart on Non-durable products - Year-over-year growth 2025-2030 (%)
Data Table on Non-durable products - Year-over-year growth 2025-2030 (%)

8.5 Others - Market size and forecast 2025-2030

Chart on Others - Market size and forecast 2025-2030 ($ million)
Data Table on Others - Market size and forecast 2025-2030 ($ million)
Chart on Others - Year-over-year growth 2025-2030 (%)
Data Table on Others - Year-over-year growth 2025-2030 (%)

8.6 Market opportunity by End-user

Market opportunity by End-user ($ million)
Data Table on Market opportunity by End-user ($ million)

9. Market Segmentation by Application

9.1 Market segments

Chart on Application - Market share 2025-2030 (%)
Data Table on Application - Market share 2025-2030 (%)

9.2 Comparison by Application

Chart on Comparison by Application
Data Table on Comparison by Application

9.3 Linerboard - Market size and forecast 2025-2030

Chart on Linerboard - Market size and forecast 2025-2030 ($ million)
Data Table on Linerboard - Market size and forecast 2025-2030 ($ million)
Chart on Linerboard - Year-over-year growth 2025-2030 (%)
Data Table on Linerboard - Year-over-year growth 2025-2030 (%)

9.4 Corrugating medium - Market size and forecast 2025-2030

Chart on Corrugating medium - Market size and forecast 2025-2030 ($ million)
Data Table on Corrugating medium - Market size and forecast 2025-2030 ($ million)
Chart on Corrugating medium - Year-over-year growth 2025-2030 (%)
Data Table on Corrugating medium - Year-over-year growth 2025-2030 (%)

9.5 Market opportunity by Application

Market opportunity by Application ($ million)
Data Table on Market opportunity by Application ($ million)

10. Market Segmentation by Grade Type

10.1 Market segments

Chart on Grade Type - Market share 2025-2030 (%)
Data Table on Grade Type - Market share 2025-2030 (%)

10.2 Comparison by Grade Type

Chart on Comparison by Grade Type
Data Table on Comparison by Grade Type

10.3 Lightweight grade - Market size and forecast 2025-2030

Chart on Lightweight grade - Market size and forecast 2025-2030 ($ million)
Data Table on Lightweight grade - Market size and forecast 2025-2030 ($ million)
Chart on Lightweight grade - Year-over-year growth 2025-2030 (%)
Data Table on Lightweight grade - Year-over-year growth 2025-2030 (%)

10.4 Medium‑weight grade - Market size and forecast 2025-2030

Chart on Medium‑weight grade - Market size and forecast 2025-2030 ($ million)
Data Table on Medium‑weight grade - Market size and forecast 2025-2030 ($ million)
Chart on Medium‑weight grade - Year-over-year growth 2025-2030 (%)
Data Table on Medium‑weight grade - Year-over-year growth 2025-2030 (%)

10.5 High‑burst grade - Market size and forecast 2025-2030

Chart on High‑burst grade - Market size and forecast 2025-2030 ($ million)
Data Table on High‑burst grade - Market size and forecast 2025-2030 ($ million)
Chart on High‑burst grade - Year-over-year growth 2025-2030 (%)
Data Table on High‑burst grade - Year-over-year growth 2025-2030 (%)

10.6 Market opportunity by Grade Type

Market opportunity by Grade Type ($ million)
Data Table on Market opportunity by Grade Type ($ million)

11. Customer Landscape

11.1 Customer landscape overview

Analysis of price sensitivity, lifecycle, customer purchase basket, adoption rates, and purchase criteria

12. Geographic Landscape

12.1 Geographic segmentation

Chart on Market share by geography 2025-2030 (%)
Data Table on Market share by geography 2025-2030 (%)

12.2 Geographic comparison

Chart on Geographic comparison
Data Table on Geographic comparison

12.3 APAC - Market size and forecast 2025-2030

Chart on APAC - Market size and forecast 2025-2030 ($ million)
Data Table on APAC - Market size and forecast 2025-2030 ($ million)
Chart on APAC - Year-over-year growth 2025-2030 (%)
Data Table on APAC - Year-over-year growth 2025-2030 (%)
Chart on Regional Comparison - APAC
Data Table on Regional Comparison - APAC

12.3.1 China - Market size and forecast 2025-2030

Chart on China - Market size and forecast 2025-2030 ($ million)
Data Table on China - Market size and forecast 2025-2030 ($ million)
Chart on China - Year-over-year growth 2025-2030 (%)
Data Table on China - Year-over-year growth 2025-2030 (%)

12.3.2 India - Market size and forecast 2025-2030

Chart on India - Market size and forecast 2025-2030 ($ million)
Data Table on India - Market size and forecast 2025-2030 ($ million)
Chart on India - Year-over-year growth 2025-2030 (%)
Data Table on India - Year-over-year growth 2025-2030 (%)

12.3.3 Japan - Market size and forecast 2025-2030

Chart on Japan - Market size and forecast 2025-2030 ($ million)
Data Table on Japan - Market size and forecast 2025-2030 ($ million)
Chart on Japan - Year-over-year growth 2025-2030 (%)
Data Table on Japan - Year-over-year growth 2025-2030 (%)

12.3.4 South Korea - Market size and forecast 2025-2030

Chart on South Korea - Market size and forecast 2025-2030 ($ million)
Data Table on South Korea - Market size and forecast 2025-2030 ($ million)
Chart on South Korea - Year-over-year growth 2025-2030 (%)
Data Table on South Korea - Year-over-year growth 2025-2030 (%)

12.3.5 Indonesia - Market size and forecast 2025-2030

Chart on Indonesia - Market size and forecast 2025-2030 ($ million)
Data Table on Indonesia - Market size and forecast 2025-2030 ($ million)
Chart on Indonesia - Year-over-year growth 2025-2030 (%)
Data Table on Indonesia - Year-over-year growth 2025-2030 (%)

12.3.6 Vietnam - Market size and forecast 2025-2030

Chart on Vietnam - Market size and forecast 2025-2030 ($ million)
Data Table on Vietnam - Market size and forecast 2025-2030 ($ million)
Chart on Vietnam - Year-over-year growth 2025-2030 (%)
Data Table on Vietnam - Year-over-year growth 2025-2030 (%)

12.4 Europe - Market size and forecast 2025-2030

Chart on Europe - Market size and forecast 2025-2030 ($ million)
Data Table on Europe - Market size and forecast 2025-2030 ($ million)
Chart on Europe - Year-over-year growth 2025-2030 (%)
Data Table on Europe - Year-over-year growth 2025-2030 (%)
Chart on Regional Comparison - Europe
Data Table on Regional Comparison - Europe

12.4.1 Germany - Market size and forecast 2025-2030

Chart on Germany - Market size and forecast 2025-2030 ($ million)
Data Table on Germany - Market size and forecast 2025-2030 ($ million)
Chart on Germany - Year-over-year growth 2025-2030 (%)
Data Table on Germany - Year-over-year growth 2025-2030 (%)

12.4.2 UK - Market size and forecast 2025-2030

Chart on UK - Market size and forecast 2025-2030 ($ million)
Data Table on UK - Market size and forecast 2025-2030 ($ million)
Chart on UK - Year-over-year growth 2025-2030 (%)
Data Table on UK - Year-over-year growth 2025-2030 (%)

12.4.3 France - Market size and forecast 2025-2030

Chart on France - Market size and forecast 2025-2030 ($ million)
Data Table on France - Market size and forecast 2025-2030 ($ million)
Chart on France - Year-over-year growth 2025-2030 (%)
Data Table on France - Year-over-year growth 2025-2030 (%)

12.4.4 Italy - Market size and forecast 2025-2030

Chart on Italy - Market size and forecast 2025-2030 ($ million)
Data Table on Italy - Market size and forecast 2025-2030 ($ million)
Chart on Italy - Year-over-year growth 2025-2030 (%)
Data Table on Italy - Year-over-year growth 2025-2030 (%)

12.4.5 Spain - Market size and forecast 2025-2030

Chart on Spain - Market size and forecast 2025-2030 ($ million)
Data Table on Spain - Market size and forecast 2025-2030 ($ million)
Chart on Spain - Year-over-year growth 2025-2030 (%)
Data Table on Spain - Year-over-year growth 2025-2030 (%)

12.4.6 The Netherlands - Market size and forecast 2025-2030

Chart on The Netherlands - Market size and forecast 2025-2030 ($ million)
Data Table on The Netherlands - Market size and forecast 2025-2030 ($ million)
Chart on The Netherlands - Year-over-year growth 2025-2030 (%)
Data Table on The Netherlands - Year-over-year growth 2025-2030 (%)

12.5 North America - Market size and forecast 2025-2030

Chart on North America - Market size and forecast 2025-2030 ($ million)
Data Table on North America - Market size and forecast 2025-2030 ($ million)
Chart on North America - Year-over-year growth 2025-2030 (%)
Data Table on North America - Year-over-year growth 2025-2030 (%)
Chart on Regional Comparison - North America
Data Table on Regional Comparison - North America

12.5.1 US - Market size and forecast 2025-2030

Chart on US - Market size and forecast 2025-2030 ($ million)
Data Table on US - Market size and forecast 2025-2030 ($ million)
Chart on US - Year-over-year growth 2025-2030 (%)
Data Table on US - Year-over-year growth 2025-2030 (%)

12.5.2 Canada - Market size and forecast 2025-2030

Chart on Canada - Market size and forecast 2025-2030 ($ million)
Data Table on Canada - Market size and forecast 2025-2030 ($ million)
Chart on Canada - Year-over-year growth 2025-2030 (%)
Data Table on Canada - Year-over-year growth 2025-2030 (%)

12.5.3 Mexico - Market size and forecast 2025-2030

Chart on Mexico - Market size and forecast 2025-2030 ($ million)
Data Table on Mexico - Market size and forecast 2025-2030 ($ million)
Chart on Mexico - Year-over-year growth 2025-2030 (%)
Data Table on Mexico - Year-over-year growth 2025-2030 (%)

12.6 South America - Market size and forecast 2025-2030

Chart on South America - Market size and forecast 2025-2030 ($ million)
Data Table on South America - Market size and forecast 2025-2030 ($ million)
Chart on South America - Year-over-year growth 2025-2030 (%)
Data Table on South America - Year-over-year growth 2025-2030 (%)
Chart on Regional Comparison - South America
Data Table on Regional Comparison - South America

12.6.1 Brazil - Market size and forecast 2025-2030

Chart on Brazil - Market size and forecast 2025-2030 ($ million)
Data Table on Brazil - Market size and forecast 2025-2030 ($ million)
Chart on Brazil - Year-over-year growth 2025-2030 (%)
Data Table on Brazil - Year-over-year growth 2025-2030 (%)

12.6.2 Argentina - Market size and forecast 2025-2030

Chart on Argentina - Market size and forecast 2025-2030 ($ million)
Data Table on Argentina - Market size and forecast 2025-2030 ($ million)
Chart on Argentina - Year-over-year growth 2025-2030 (%)
Data Table on Argentina - Year-over-year growth 2025-2030 (%)

12.6.3 Colombia - Market size and forecast 2025-2030

Chart on Colombia - Market size and forecast 2025-2030 ($ million)
Data Table on Colombia - Market size and forecast 2025-2030 ($ million)
Chart on Colombia - Year-over-year growth 2025-2030 (%)
Data Table on Colombia - Year-over-year growth 2025-2030 (%)

12.7 Middle East and Africa - Market size and forecast 2025-2030

Chart on Middle East and Africa - Market size and forecast 2025-2030 ($ million)
Data Table on Middle East and Africa - Market size and forecast 2025-2030 ($ million)
Chart on Middle East and Africa - Year-over-year growth 2025-2030 (%)
Data Table on Middle East and Africa - Year-over-year growth 2025-2030 (%)
Chart on Regional Comparison - Middle East and Africa
Data Table on Regional Comparison - Middle East and Africa

12.7.1 Saudi Arabia - Market size and forecast 2025-2030

Chart on Saudi Arabia - Market size and forecast 2025-2030 ($ million)
Data Table on Saudi Arabia - Market size and forecast 2025-2030 ($ million)
Chart on Saudi Arabia - Year-over-year growth 2025-2030 (%)
Data Table on Saudi Arabia - Year-over-year growth 2025-2030 (%)

12.7.2 UAE - Market size and forecast 2025-2030

Chart on UAE - Market size and forecast 2025-2030 ($ million)
Data Table on UAE - Market size and forecast 2025-2030 ($ million)
Chart on UAE - Year-over-year growth 2025-2030 (%)
Data Table on UAE - Year-over-year growth 2025-2030 (%)

12.7.3 South Africa - Market size and forecast 2025-2030

Chart on South Africa - Market size and forecast 2025-2030 ($ million)
Data Table on South Africa - Market size and forecast 2025-2030 ($ million)
Chart on South Africa - Year-over-year growth 2025-2030 (%)
Data Table on South Africa - Year-over-year growth 2025-2030 (%)

12.7.4 Egypt - Market size and forecast 2025-2030

Chart on Egypt - Market size and forecast 2025-2030 ($ million)
Data Table on Egypt - Market size and forecast 2025-2030 ($ million)
Chart on Egypt - Year-over-year growth 2025-2030 (%)
Data Table on Egypt - Year-over-year growth 2025-2030 (%)

12.7.5 Qatar - Market size and forecast 2025-2030

Chart on Qatar - Market size and forecast 2025-2030 ($ million)
Data Table on Qatar - Market size and forecast 2025-2030 ($ million)
Chart on Qatar - Year-over-year growth 2025-2030 (%)
Data Table on Qatar - Year-over-year growth 2025-2030 (%)

12.8 Market opportunity by geography

Market opportunity by geography ($ million)
Data Tables on Market opportunity by geography ($ million)

13. Drivers, Challenges, and Opportunity

13.1 Market drivers

Proliferation of global E-commerce and digital retail logistics
Growth in processed food and FMCG packaging requirements
Technological advancements in manufacturing and material engineering

13.2 Market challenges

Ascendancy of high-definition digital printing and personalized brand experiences
Proliferation of right sizing and on-demand packaging systems
Integration of intelligent packaging and digital connectivity features

13.3 Impact of drivers and challenges

Impact of drivers and challenges in 2025 and 2030

13.4 Market opportunities

Rapid expansion of e-commerce fulfillment and omnichannel retail logistics
Rigorous sustainability mandates and circular economy transition
Integration of smart technologies and advanced manufacturing automation

14. Competitive Landscape

14.1 Overview

14.2

Overview on criticality of inputs and factors of differentiation

14.3 Landscape disruption

Overview on factors of disruption

14.4 Industry risks

Impact of key risks on business

15. Competitive Analysis

15.1 Companies profiled

Companies covered

15.2 Company ranking index

15.3 Market positioning of companies

Matrix on companies position and classification

15.4 Bio pappel

Bio pappel - Overview
Bio pappel - Product / Service
Bio pappel - Key offerings
SWOT

15.5 DS Smith Plc

DS Smith Plc - Overview
DS Smith Plc - Product / Service
DS Smith Plc - Key news
DS Smith Plc - Key offerings
SWOT

15.6 Georgia Pacific LLC

Georgia Pacific LLC - Overview
Georgia Pacific LLC - Product / Service
Georgia Pacific LLC - Key offerings
SWOT

15.7 Green Bay Packaging Inc.

Green Bay Packaging Inc. - Overview
Green Bay Packaging Inc. - Product / Service
Green Bay Packaging Inc. - Key offerings
SWOT

15.8 International Paper Co.

International Paper Co. - Overview
International Paper Co. - Business segments
International Paper Co. - Key news
International Paper Co. - Key offerings
International Paper Co. - Segment focus
SWOT

15.9 Klabin S.A.

Klabin S.A. - Overview
Klabin S.A. - Business segments
Klabin S.A. - Key offerings
Klabin S.A. - Segment focus
SWOT

15.10 Lee and Man Paper Manufacturing

Lee and Man Paper Manufacturing - Overview
Lee and Man Paper Manufacturing - Business segments
Lee and Man Paper Manufacturing - Key offerings
Lee and Man Paper Manufacturing - Segment focus
SWOT

15.11 Menasha Corp

Menasha Corp - Overview
Menasha Corp - Product / Service
Menasha Corp - Key offerings
SWOT

15.12 Mondi Plc

Mondi Plc - Overview
Mondi Plc - Business segments
Mondi Plc - Key news
Mondi Plc - Key offerings
Mondi Plc - Segment focus
SWOT

15.13 Packaging Corp. of America

Packaging Corp. of America - Overview
Packaging Corp. of America - Business segments
Packaging Corp. of America - Key offerings
Packaging Corp. of America - Segment focus
SWOT

15.14 Pratt Industries Inc.

Pratt Industries Inc. - Overview
Pratt Industries Inc. - Product / Service
Pratt Industries Inc. - Key offerings
SWOT

15.15 Rengo Co. Ltd.

Rengo Co. Ltd. - Overview
Rengo Co. Ltd. - Business segments
Rengo Co. Ltd. - Key offerings
Rengo Co. Ltd. - Segment focus
SWOT

15.16 Shanying International Holding

Shanying International Holding - Overview
Shanying International Holding - Business segments
Shanying International Holding - Key offerings
Shanying International Holding - Segment focus
SWOT

15.17 Smurfit Westrock plc

Smurfit Westrock plc - Overview
Smurfit Westrock plc - Business segments
Smurfit Westrock plc - Key offerings
Smurfit Westrock plc - Segment focus
SWOT

15.18 Stora Enso Oyj

Stora Enso Oyj - Overview
Stora Enso Oyj - Business segments
Stora Enso Oyj - Key offerings
Stora Enso Oyj - Segment focus
SWOT

16. Appendix

16.1 Scope of the report

Market definition
Objectives
Notes and caveats

16.2 Inclusions and exclusions checklist

Inclusions checklist
Exclusions checklist

16.3 Currency conversion rates for US$

16.4 Research methodology

16.5 Data procurement

Information sources

16.6 Data validation

16.7 Validation techniques employed for market sizing

16.8 Data synthesis

16.9 360 degree market analysis

16.10 List of abbreviations

Research Methodology

Technavio presents a detailed picture of the market by way of study, synthesis, and summation of data from multiple sources. The analysts have presented the various facets of the market with a particular focus on identifying the key industry influencers. The data thus presented is comprehensive, reliable, and the result of extensive research, both primary and secondary.

INFORMATION SOURCES

Primary sources

  • Manufacturers and suppliers
  • Channel partners
  • Industry experts
  • Strategic decision makers

Secondary sources

  • Industry journals and periodicals
  • Government data
  • Financial reports of key industry players
  • Historical data
  • Press releases

DATA ANALYSIS

Data Synthesis

  • Collation of data
  • Estimation of key figures
  • Analysis of derived insights

Data Validation

  • Triangulation with data models
  • Reference against proprietary databases
  • Corroboration with industry experts

REPORT WRITING

Qualitative

  • Market drivers
  • Market challenges
  • Market trends
  • Five forces analysis

Quantitative

  • Market size and forecast
  • Market segmentation
  • Geographical insights
  • Competitive landscape

Interested in this report?

Get your sample now to see our research methodology and insights!

Download Now

Frequently Asked Questions

Corrugated Box market growth will increase by USD 16018.2 million during 2026-2030.

The Corrugated Box market is expected to grow at a CAGR of 4.2% during 2026-2030.

Corrugated Box market is segmented by End-user (Food and beverage, Non-durable products, Others) Application (Linerboard, Corrugating medium) Grade type (Lightweight grade, Medium‑weight grade, High‑burst grade)

Alliance Packaging, Bio pappel, DS Smith Plc, Georgia Pacific LLC, Green Bay Packaging Inc., International Paper Co., Klabin S.A., Lee and Man Paper Manufacturing, Menasha Corp, Mondi Plc, Nine Dragons Paper Holdings Ltd., Packaging Corp. of America, Pratt Industries Inc., Rengo Co. Ltd., S.A Industrias Celulosa Aragonesa, Shanying International Holding, Smurfit Westrock plc, Stora Enso Oyj, THIMM Group GmbH plus Co. KG are a few of the key vendors in the Corrugated Box market.

APAC will register the highest growth rate of 60.8% among the other regions. Therefore, the Corrugated Box market in APAC is expected to garner significant business opportunities for the vendors during the forecast period.

China, India, Japan, South Korea, Indonesia, Vietnam, Germany, UK, France, Italy, Spain, The Netherlands, US, Canada, Mexico, Brazil, Argentina, Colombia, Saudi Arabia, UAE, South Africa, Egypt, Qatar

  • Proliferation of global E-commerce and digital retail logistics is the driving factor this market.

The Corrugated Box market vendors should focus on grabbing business opportunities from the End-user segment as it accounted for the largest market share in the base year.
RIA - Research AI Assistant
Ask RIA