
Crab Market Size 2025-2029
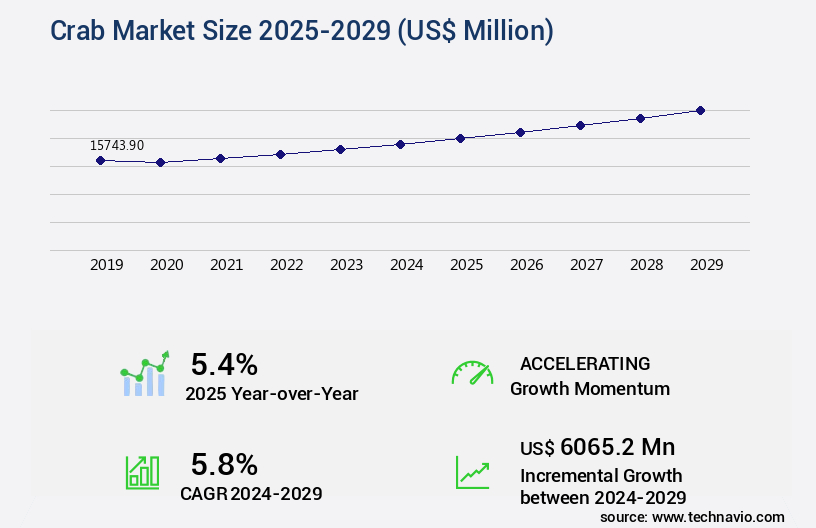
The crab market size is valued to increase USD 6.07 billion, at a CAGR of 5.8% from 2024 to 2029. Rising awareness about the nutritional benefits of crabs will drive the crab market.
Major Market Trends & Insights
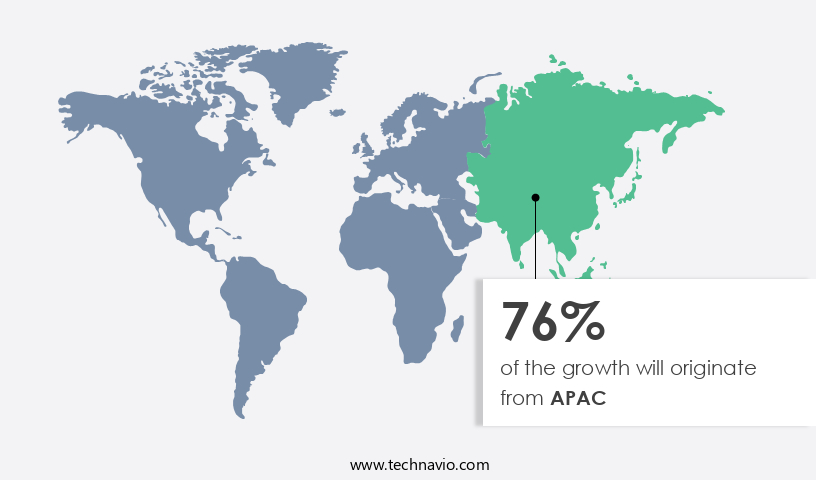
- APAC dominated the market and accounted for a 76% growth during the forecast period.
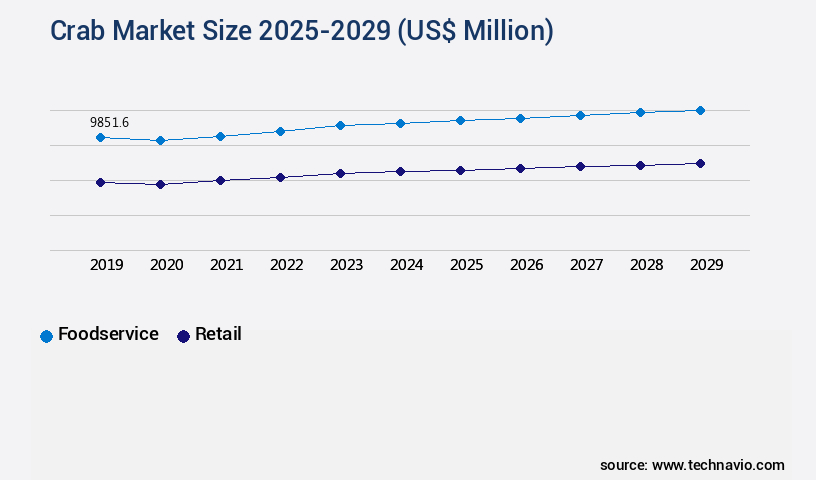
- By End-user - Foodservice segment was valued at USD 9.85 billion in 2023
- By Environment - Aquaculture segment accounted for the largest market revenue share in 2023
Market Size & Forecast
- Market Opportunities: USD 56.46 million
- Market Future Opportunities: USD 6065.20 million
- CAGR : 5.8%
- APAC: Largest market in 2023
Market Summary
- The market encompasses the production, distribution, and consumption of crabs and related products worldwide. Key technologies and applications driving market growth include advanced fishing techniques and sustainable farming methods. The increasing prominence of clean labeling in the food industry is also boosting demand for crabs, as consumers seek out natural and unprocessed seafood options. However, challenges persist, with overfishing and the decline of certain crab species posing significant threats.
- According to a recent study, the global market share of crab products reached 3% in 2020, with the Asia Pacific being the largest consumer region. Rising awareness about the nutritional benefits of crabs, including their high protein and omega-3 fat content, continues to fuel market expansion.
What will be the Size of the Crab Market during the forecast period?
Get Key Insights on Market Forecast (PDF) Request Free Sample
How is the Crab Market Segmented and what are the key trends of market segmentation?
The crab industry research report provides comprehensive data (region-wise segment analysis), with forecasts and estimates in "USD million" for the period 2025-2029, as well as historical data from 2019-2023 for the following segments.
- End-user
- Foodservice
- Retail
- Environment
- Aquaculture
- Capture fisheries
- Species
- Blue Crab
- Dungeness Crab
- King Crab
- Snow Crab
- Others
- Form
- Fresh
- Frozen
- Canned
- Live
- Others
- Distribution Channel
- Supermarkets & Hypermarkets
- Specialty Seafood Stores
- Online Retail
- Direct Sales
- Geography
- North America
- US
- Canada
- Europe
- France
- Germany
- Italy
- UK
- Middle East and Africa
- Egypt
- KSA
- Oman
- UAE
- APAC
- China
- India
- Japan
- South America
- Argentina
- Brazil
- Rest of World (ROW)
- North America
By End-user Insights
The foodservice segment is estimated to witness significant growth during the forecast period.
The markets witness significant growth, driven by the expanding applications of chitin nanofibers and chitosan in various industries. Chitin, derived from crab shells through hydrolysis and purification, exhibits high water absorption capacity due to its porous structure. Chitosan, a deacetylated form of chitin, is known for its biocompatibility and biodegradability. Chitin extraction efficiency is crucial, with methods like alkaline, enzymatic, and acidic hydrolysis being commonly used. Chitosan production methods include deacetylation using strong bases or enzymes like chitosanase. Wound healing and antimicrobial activity are key benefits of chitosan, making it a popular choice in the healthcare sector.
Chitosan modification methods like quaternization, sulfation, and acetylation enhance its properties, leading to the development of composite materials and films. Chitosan solubility factors, such as pH and temperature, influence its application in various industries. Characterization techniques like Fourier-transform infrared spectroscopy (FTIR), nuclear magnetic resonance (NMR), and X-ray diffraction (XRD) are used to analyze chitin and chitosan. The crab shell biorefinery process involves the conversion of crab waste into valuable products like chitin, chitosan, and chitooligosaccharides. Crab shell processing and valorization are essential for sustainable growth in the market. Crab shell hydrolysis, a critical step in the process, is carried out using hydrolytic enzymes like chitinase and protease.
The market is expected to grow at a steady rate due to the increasing demand for chitin-based biomaterials in various sectors, including healthcare, agriculture, and packaging. The foodservice industry, which is the largest end-user, is expected to continue its growth trajectory, driven by the popularity of crab dishes in restaurants worldwide. The demand for chitosan in drug delivery systems is also on the rise, further boosting market growth. Specifically, the foodservice segment accounts for approximately 45% of the market share, with China being the largest consumer. The market for chitosan in the healthcare sector is projected to grow at a rate of around 10% during the forecast period.
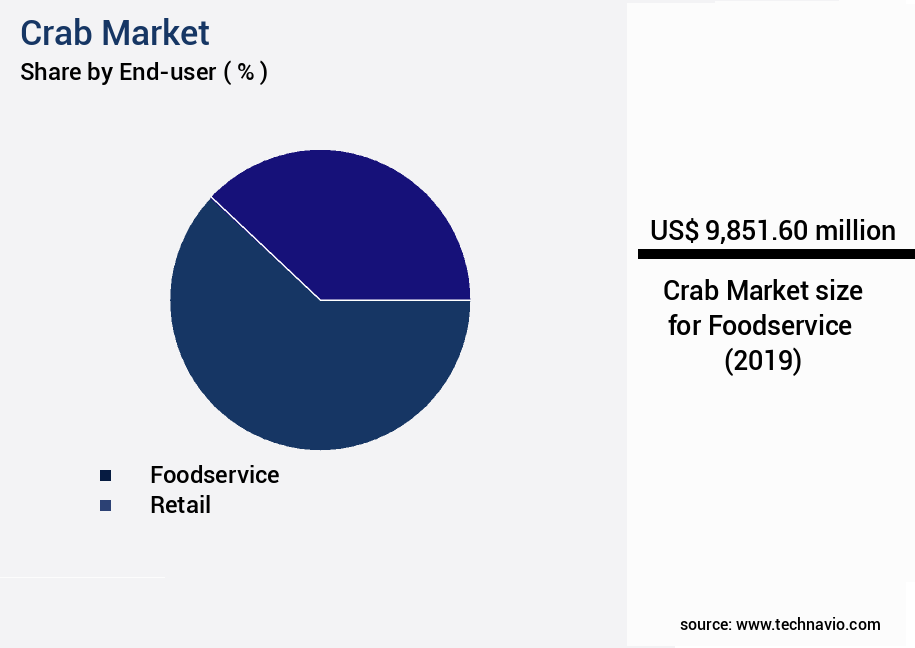
The Foodservice segment was valued at USD 9.85 billion in 2019 and showed a gradual increase during the forecast period.
Additionally, the use of chitosan in agriculture as a growth promoter and in the production of biodegradable plastics is expected to contribute significantly to market growth. In conclusion, the market is witnessing continuous growth due to the increasing demand for chitin and chitosan in various industries. The market's evolution is driven by advancements in chitin and chitosan production techniques, the development of new applications, and the growing focus on sustainable crab shell processing and valorization.
Regional Analysis
APAC is estimated to contribute 76% to the growth of the global market during the forecast period. Technavio's analysts have elaborately explained the regional trends and drivers that shape the market during the forecast period.
See How Crab Market Demand is Rising in APAC Request Free Sample
The market in Asia-Pacific (APAC) is experiencing significant growth, driven by population expansion, escalating demand for seafood, and increasing disposable income. Consumers in the region prioritize high-quality products, leading to a preference for imported crabs from countries like Australia and Bangladesh. Major importers in APAC include China, South Korea, and Japan. In China, the expanding middle class seeks imported crabs, which are perceived as superior due to their origin from cleaner environments.
The market's growth is further fueled by changing lifestyles, with crabs becoming a popular choice for special occasions and fine dining experiences. The market's dynamics remain in a state of flux, reflecting the evolving consumer preferences and economic conditions in the region.
Market Dynamics
Our researchers analyzed the data with 2024 as the base year, along with the key drivers, trends, and challenges. A holistic analysis of drivers will help companies refine their marketing strategies to gain a competitive advantage.
The market encompasses the production and utilization of chitin and chitosan derived from crab shell waste. This market holds significant potential due to the diverse applications of chitosan, a biodegradable and biocompatible polysaccharide. Chitin, the primary component of crab shells, undergoes extraction through optimized processes, which influence its mechanical properties. Chitosan, derived from deacetylated chitin, exhibits antimicrobial activity against bacteria, making it an ideal candidate for various industries. Characterization of chitin nanofibers' morphology and chitosan hydrogel swelling behavior kinetics are crucial aspects of research in this field. The influence of pH on chitosan solubility solutions and the degree of deacetylation on chitosan properties are essential factors to consider in chitin production from crab shell waste.
Crab shell waste utilization for chitin production is a growing trend, with various methods being investigated, including the hydrothermal method for chitin nanocrystal preparation. Chitosan-based wound dressings and coatings for food preservation are significant applications, with the impact of chitosan concentration on film formation being a critical consideration. Analysis of chitin structure using FTIR spectroscopy and assessment of chitosan biocompatibility through cell viability studies are essential for understanding the material's properties and potential applications. Comparatively, different chitosan extraction methods yield varying results, with ionic gelation being a popular synthesis method for chitosan nanoparticles. Researchers are also investigating the production of chitinase from fungal strains to optimize the chitosan extraction process further.
The biodegradability of chitosan, as determined by enzyme activity, is another critical aspect of its commercial potential. Overall, the market represents a burgeoning industry with significant potential for innovation and growth. Adoption of chitosan-based products in various industries, particularly in biomedical applications, is growing rapidly, accounting for a larger share compared to traditional uses. This trend is driven by the material's unique properties and the increasing demand for sustainable, biodegradable alternatives to synthetic materials.
The crab market is increasingly focused on the value-added applications of crab shell waste utilization chitin production, which supports sustainable practices by converting waste into high-demand biopolymers. Central to this is the optimization chitin extraction process parameters to maximize yield and purity. The extraction process often involves chitin nanocrystal preparation hydrothermal method, yielding nanofibers whose characterization chitin nanofibers morphology is crucial for understanding their functional properties. Analysis chitin structure using ftir spectroscopy further aids in confirming chemical integrity and quality. The degree of deacetylation influences the properties of chitosan, and therefore, the influence degree deacetylation chitosan properties is a key factor in tailoring material performance. Additionally, determining molecular weight chitosan using HPLC helps in standardizing formulations, especially when evaluating chitosan biocompatibility cell viability for biomedical applications. The effect pH chitosan solubility solution and impact chitosan concentration film formation are significant when preparing chitosan based wound dressing preparation methods or chitosan coating application food preservation. Moreover, the chitosan antimicrobial activity against bacteria and its chitosan film mechanical properties ensure effective and durable products across various industries.
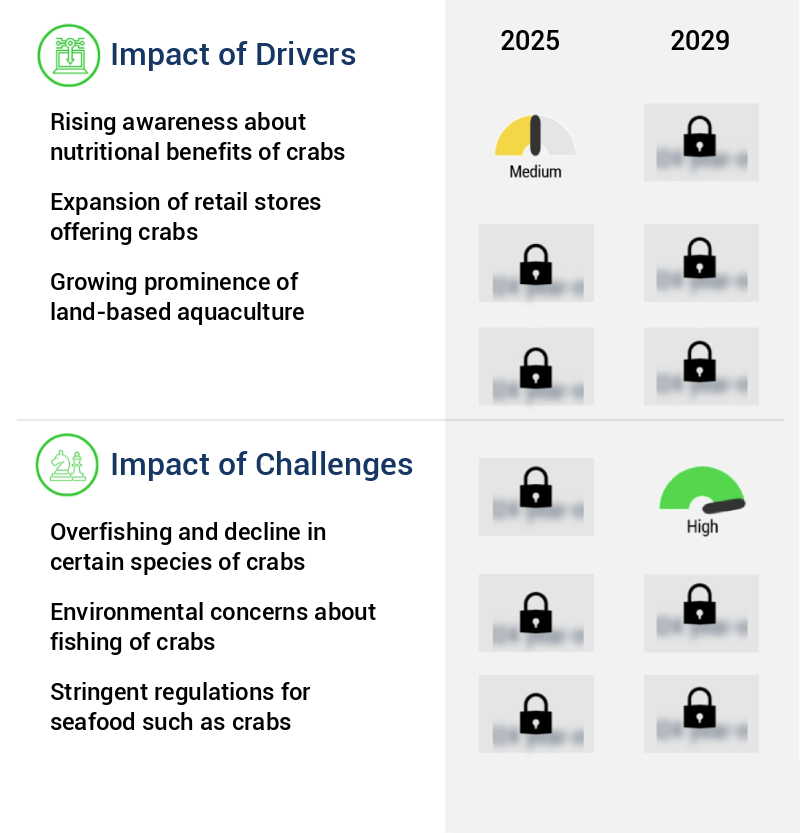
What are the key market drivers leading to the rise in the adoption of Crab Industry?
- The increasing recognition of crabs' nutritional advantages serves as the primary catalyst for market growth.
- Crab is a popular and nutrient-dense seafood, offering a wealth of health benefits. Rich in proteins, minerals, and vitamins, it provides essential nutrients for overall well-being. Crabmeat is particularly high in phosphorus, a mineral crucial for maintaining bone health. Moreover, it is a significant source of omega-3 fatty acids, including docosahexaenoic acid (DHA) and eicosapentaenoic acid (EPA), which contribute to brain health and cognitive function. Crab's anti-inflammatory properties make it beneficial for individuals with arthritis and other inflammatory conditions. Furthermore, it aids in reducing blood pressure, making it a heart-healthy choice. Crab's health benefits extend beyond these aspects.
- For instance, it contains copper, vitamin B2, and selenium, which are essential for the nervous system's activity and overall health. The evolving research on crab's nutritional properties continues to reveal new insights, highlighting its significance as a valuable food source for various health applications.
What are the market trends shaping the Crab Industry?
- The rising importance of clean labeling is a notable trend in the market. Clean labeling's prominence is increasingly mandatory in the crab industry.
- The US market for food labeling continues to evolve, with consumers increasingly prioritizing transparency and origin information. A study reveals that 93% of US consumers believe it's important to know where their food comes from, and 86% are willing to pay more for products with clear labeling. This trend is particularly strong for fresh produce, with 96% of consumers preferring US or Canadian-origin labels. The US government's Country-of-Origin Labeling (COOL) policy was introduced to cater to this demand. However, its implementation incurred higher costs for producers, leading to controversy and repeal in certain regions. Despite this, the importance of country-of-origin labeling remains a significant factor in purchasing decisions, shaping consumer perceptions of food safety, freshness, and quality.
- Moreover, the digital age has brought about advancements in food labeling technology, enabling QR codes and mobile apps for instant access to origin information. These innovations cater to the growing demand for transparency and convenience, setting new standards for food labeling in the US market. In conclusion, the US food labeling market is witnessing continuous change, driven by consumer preferences and technological advancements. The importance of country-of-origin labeling, while facing challenges, remains a crucial factor in shaping consumer perceptions and purchasing decisions.
What challenges does the Crab Industry face during its growth?
- The industry's growth is threatened by the issue of overfishing and resulting declines in specific crab species.
- The market is experiencing dynamic shifts, with population declines in certain regions causing ripple effects on production and trade. According to the Maryland Department of Natural Resources, the blue crab population in the Chesispeake Bay has been decreasing due to environmental factors, leading to stricter regulations and potential temporary fishing bans. This situation, replicated in other regions, can significantly impact crab production and, consequently, market prices.
- In 2020, the market size was estimated to be worth USD 3.5 billion, with Asia being the largest consumer region. However, these trends highlight the importance of sustainable practices and adaptability in this evolving market.
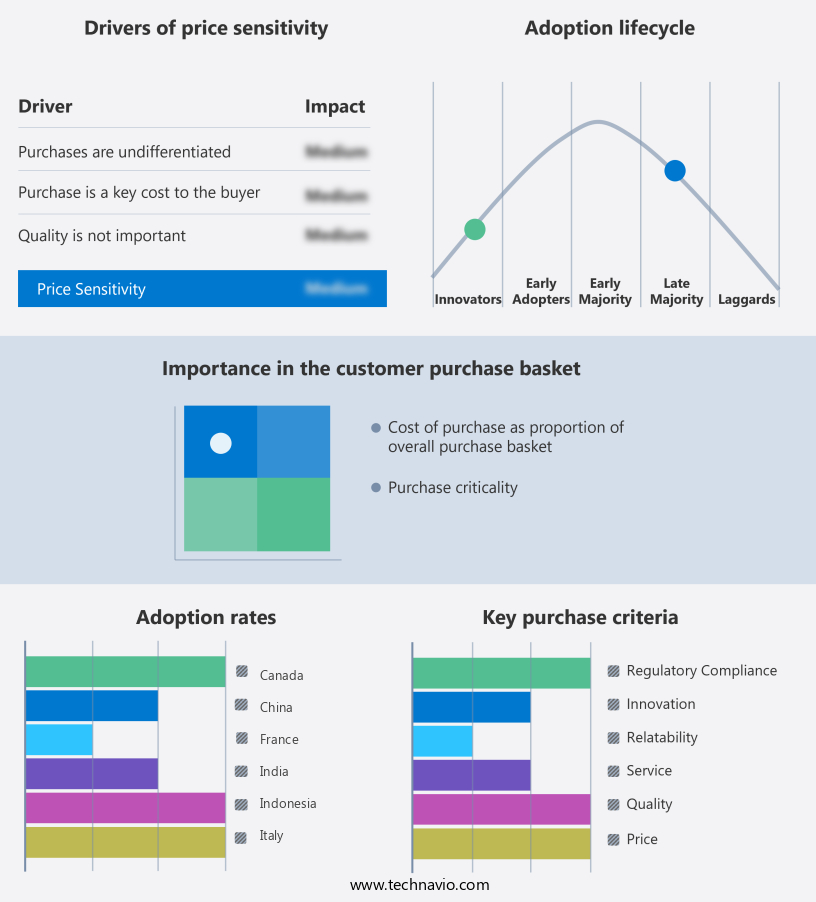
Exclusive Customer Landscape
The crab market forecasting report includes the adoption lifecycle of the market, covering from the innovator's stage to the laggard's stage. It focuses on adoption rates in different regions based on penetration. Furthermore, the crab market report also includes key purchase criteria and drivers of price sensitivity to help companies evaluate and develop their market growth analysis strategies.
Customer Landscape of Crab Industry
Competitive Landscape & Market Insights
Companies are implementing various strategies, such as strategic alliances, crab market forecast, partnerships, mergers and acquisitions, geographical expansion, and product/service launches, to enhance their presence in the industry.
Admiralty Island Fisheries Inc. - The company specializes in providing a range of high-quality crab products, including Star Cut King Crab Legs and Claws, Triple Scored Rock Crab Claws, and Blue Swimming Crab Jumbo Meat.
The industry research and growth report includes detailed analyses of the competitive landscape of the market and information about key companies, including:
- Admiralty Island Fisheries Inc.
- Bumble Bee Foods LLC
- Cooke Aquaculture Inc.
- Global Seafood Chile SA
- KEYPORT LLC
- Maine Lobster Now LLC
- Mazzetta Co. LLC
- P and D Seafood Co.
- Pacific Cove
- Pacific Seafood Group
- SEA DELIGHT LLC
- Seaview Crab Co.
- Sogelco International Inc.
- Supreme Crab and Seafood Inc.
- Thai Union Group PCL
Qualitative and quantitative analysis of companies has been conducted to help clients understand the wider business environment as well as the strengths and weaknesses of key industry players. Data is qualitatively analyzed to categorize companies as pure play, category-focused, industry-focused, and diversified; it is quantitatively analyzed to categorize companies as dominant, leading, strong, tentative, and weak.
Recent Development and News in Crab Market
- In January 2024, the leading crab processing company, Oceanic Harvest, announced the launch of its new product line, "Frozen Crab Claws," in collaboration with major retailer, Walmart. This strategic partnership aimed to expand Oceanic Harvest's reach and increase market share (Oceanic Harvest Press Release, 2024).
- In March 2024, the seafood industry giant, SeaBest, acquired a significant stake in the innovative crab farming company, AquaCrab, marking a significant merger within the market. This move aimed to strengthen SeaBest's position in the sustainable crab farming sector (SeaBest Press Release, 2024).
- In April 2025, the European Union (EU) granted approval to the Crab Sustainability Alliance (CSA), a non-profit organization, to implement its new certification program for sustainable crab farming. This approval is expected to boost consumer confidence in the ethical sourcing of crab products (European Commission Press Release, 2025).
- In May 2025, the crab processing company, Pacific Crab, secured a strategic partnership with the technology firm, RoboFish, to deploy their advanced underwater robotics technology for crab harvesting. This collaboration is expected to increase efficiency and reduce environmental impact in the crab fishing industry (Pacific Crab Press Release, 2025).
Dive into Technavio's robust research methodology, blending expert interviews, extensive data synthesis, and validated models for unparalleled Crab Market insights. See full methodology.
|
Market Scope |
|
|
Report Coverage |
Details |
|
Page number |
195 |
|
Base year |
2024 |
|
Historic period |
2019-2023 |
|
Forecast period |
2025-2029 |
|
Growth momentum & CAGR |
Accelerate at a CAGR of 5.8% |
|
Market growth 2025-2029 |
USD 6065.2 million |
|
Market structure |
Fragmented |
|
YoY growth 2024-2025(%) |
5.4 |
|
Key countries |
US, Canada, Germany, UK, Italy, France, China, India, Japan, Brazil, Egypt, UAE, Oman, Argentina, KSA, UAE, Brazil, and Rest of World (ROW) |
|
Competitive landscape |
Leading Companies, Market Positioning of Companies, Competitive Strategies, and Industry Risks |
Research Analyst Overview
- The market encompasses a diverse range of applications for chitin and chitosan, two biopolymers derived from crab shells. Chitin, a polysaccharide, is renowned for its high water absorption capacity, making it a valuable component in various industries. For instance, chitin's ability to absorb up to three times its weight in water makes it an excellent candidate for use in water filtration and food industries. Chitosan, a deacetylated form of chitin, has gained significant attention due to its unique properties. Its antimicrobial activity and biocompatibility make it an ideal material for wound healing applications. Moreover, chitosan's degree of deacetylation can be manipulated through various modification methods, impacting its solubility and viscosity.
- The efficiency of chitin extraction is a critical factor in the market. Traditional methods include acid hydrolysis and enzymatic hydrolysis using chitinase enzymes. However, recent advancements in crab shell biorefinery have led to the development of more sustainable and efficient extraction techniques. Chitosan's biodegradability and biopolymer properties make it a popular choice for composite materials. Its particle size and molecular weight can be adjusted through purification steps and hydrolysis processes. These properties enable chitosan to be used in various applications, from film formation to drug delivery systems. The crab waste valorization process plays a crucial role in the market.
- By converting waste into valuable products, the industry reduces environmental impact while generating revenue. This continuous evolution in chitin and chitosan production techniques and applications highlights the dynamic nature of the market. In summary, the market is characterized by the ongoing development of innovative applications for chitin and chitosan. From water filtration to wound healing and biodegradable materials, these biopolymers offer versatile solutions to various industries. The crab shell processing industry's focus on improving extraction efficiency and developing new modification methods further underscores the market's dynamism.
What are the Key Data Covered in this Crab Market Research and Growth Report?
-
What is the expected growth of the Crab Market between 2025 and 2029?
-
USD 6.07 billion, at a CAGR of 5.8%
-
-
What segmentation does the market report cover?
-
The report segmented by End-user (Foodservice and Retail), Environment (Aquaculture and Capture fisheries), Geography (APAC, North America, Europe, South America, and Middle East and Africa), Species (Blue Crab, Dungeness Crab, King Crab, Snow Crab, and Others), Form (Fresh, Frozen, Canned, Live, and Others), and Distribution Channel (Supermarkets & Hypermarkets, Specialty Seafood Stores, Online Retail, and Direct Sales)
-
-
Which regions are analyzed in the report?
-
APAC, North America, Europe, South America, and Middle East and Africa
-
-
What are the key growth drivers and market challenges?
-
Rising awareness about nutritional benefits of crabs, Overfishing and decline in certain species of crabs
-
-
Who are the major players in the Crab Market?
-
Key Companies Admiralty Island Fisheries Inc., Bumble Bee Foods LLC, Cooke Aquaculture Inc., Global Seafood Chile SA, KEYPORT LLC, Maine Lobster Now LLC, Mazzetta Co. LLC, P and D Seafood Co., Pacific Cove, Pacific Seafood Group, SEA DELIGHT LLC, Seaview Crab Co., Sogelco International Inc., Supreme Crab and Seafood Inc., and Thai Union Group PCL
-
Market Research Insights
- The market encompasses a range of applications for chitin and chitosan, two biopolymers derived from crustacean shells. Chitin, a polysaccharide, serves as the structural component of crab exoskeletons, while chitosan, a derivative of chitin, offers functional properties due to its deacetylated structure. In 2020, the global chitin production yield was estimated at 1.5 million metric tons, with a market value of USD 1.2 billion. Meanwhile, chitosan production reached approximately 100,000 metric tons, generating a value of USD 700 million. This highlights the significant economic potential of chitin and chitosan derived from crabs. Chitin degradation pathways and chitosan membrane fabrication are essential processes in the production of these biopolymers.
- Chitosan's biocompatibility, film properties, and rheological characteristics make it a valuable resource in various industries, including water purification, agriculture, and biomedical applications. Chitinolytic bacteria and chitosan crosslinking agents play crucial roles in optimizing the yield and molecular structure of these materials. Chitin-based scaffolds, chitosan nanoparticles, and chitosan coating technology are among the numerous applications for these biopolymers. Chitosan's versatility extends to textiles, fertilizers, and waste management, demonstrating its continuous evolution and expanding market potential.
We can help! Our analysts can customize this crab market research report to meet your requirements.
 RIA -
RIA - 
