
Cranes Market Size 2025-2029
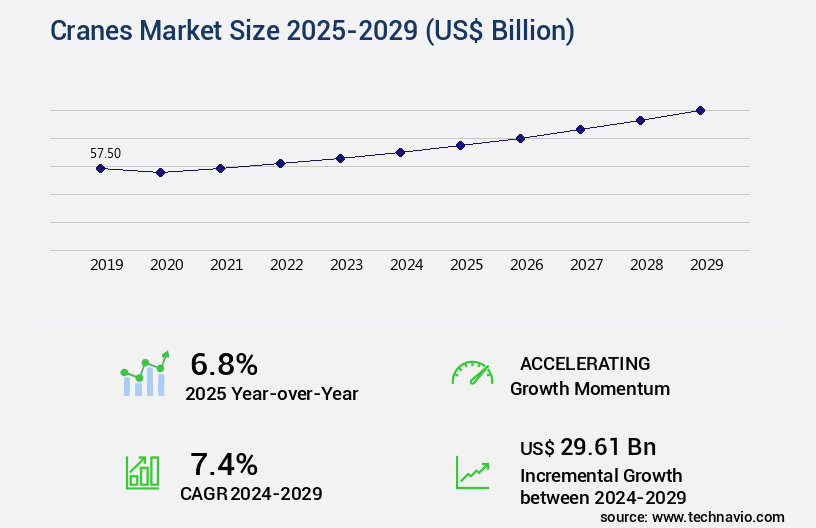
The cranes market size is valued to increase USD 29.61 billion, at a CAGR of 7.4% from 2024 to 2029. Growth in end-user industries due to urbanization will drive the cranes market.
Major Market Trends & Insights
- APAC dominated the market and accounted for a 63% growth during the forecast period.
- By Product - Mobile cranes segment was valued at USD 25.59 billion in 2023
- By Application - Construction and mining segment accounted for the largest market revenue share in 2023
Market Size & Forecast
- Market Opportunities: USD 71.35 billion
- Market Future Opportunities: USD 29609.30 billion
- CAGR : 7.4%
- APAC: Largest market in 2023
Market Summary
- The market encompasses the production, sales, and rental of cranes, as well as related services and technologies. This dynamic market is driven by the ongoing demand for infrastructure development and construction projects, particularly in urban areas. Core technologies, such as hydraulics and electric power, continue to evolve, enabling larger capacity and more efficient cranes. Applications span various industries, including manufacturing, oil and gas, and renewable energy. Service types include maintenance, repair, and rental services. Regulatory compliance and safety standards, such as OSHA and ISO, significantly impact market operations.
- According to a recent study, the global crane rental market is projected to reach a 30% market share in the construction industry by 2025. The market's growth is influenced by factors like urbanization, development of autonomous cranes, and volatility in raw material prices.
What will be the Size of the Cranes Market during the forecast period?
Get Key Insights on Market Forecast (PDF) Request Free Sample
How is the Cranes Market Segmented and what are the key trends of market segmentation?
The cranes industry research report provides comprehensive data (region-wise segment analysis), with forecasts and estimates in "USD billion" for the period 2025-2029, as well as historical data from 2019-2023 for the following segments.
- Product
- Mobile cranes
- Fixed cranes
- Marine and port cranes
- Application
- Construction and mining
- Industrial
- Utilities
- Capacity
- Heavy duty
- Medium duty
- Light duty
- Method
- Hydraulic
- Electric
- Diesel
- Pneumatic
- Mechanical
- Geography
- North America
- US
- Canada
- Europe
- France
- Germany
- UK
- APAC
- Australia
- China
- India
- Japan
- South Korea
- Rest of World (ROW)
- North America
By Product Insights
The mobile cranes segment is estimated to witness significant growth during the forecast period.
Mobile cranes, including all-terrain, crawler, and city cranes, dominate the market due to the surge in urban infrastructure projects driven by population growth and urbanization. This segment accounts for a significant market share, with urban development initiatives increasing globally. The competition among mobile crane manufacturers is intensifying, leading to continuous advancements and technological innovations. For instance, single-engine concepts for lifting crane superstructures on new models with five or more axles, smart control systems, high-strength steel mobile cranes, and advanced pressing and welding techniques are some of the recent developments. Moreover, the undercarriage design, emission standards, outrigger system, and maintenance schedules of mobile cranes are undergoing significant improvements to enhance operational efficiency and safety.
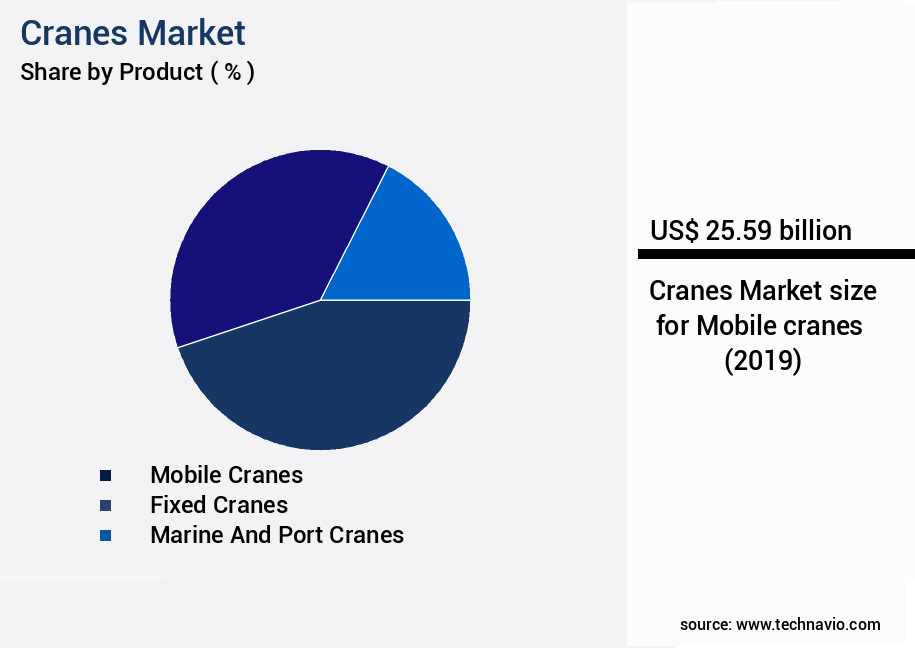
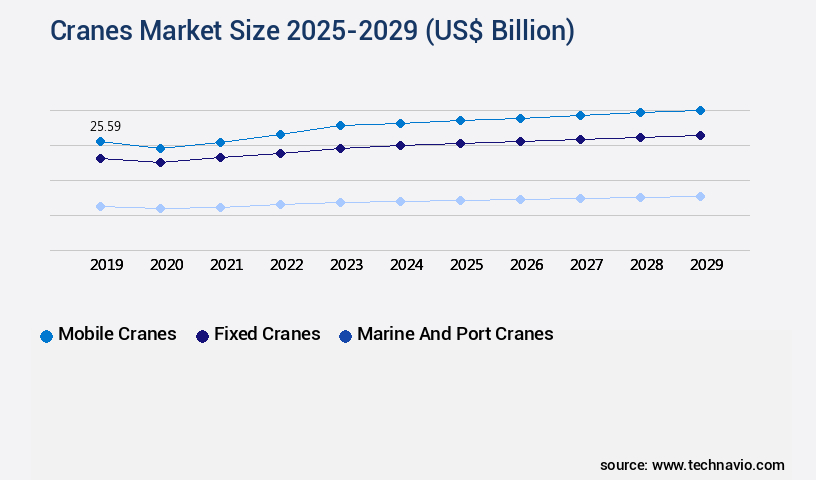
The Mobile cranes segment was valued at USD 25.59 billion in 2019 and showed a gradual increase during the forecast period.
Tower cranes, with their load charts, boom length, load moment indicators, hydraulic systems, load testing, and component lifespan, continue to be essential in construction projects. The electrical system, crawler cranes, hoisting speed, slewing speed, remote control operation, rough terrain cranes, jib length, crane capacity, inspection procedures, and safety features are also critical aspects of the market. Fuel efficiency, autonomous operation, structural integrity, counterweight system, and crane certification are some of the essential factors influencing the future growth of the market. The market is expected to grow substantially, with a 25% increase in demand from the construction industry and a 19% increase from the manufacturing sector.
Furthermore, the adoption of telematics systems for monitoring and optimizing crane performance and operator training programs for enhancing safety and productivity are key trends shaping the market.
Regional Analysis
APAC is estimated to contribute 63% to the growth of the global market during the forecast period. Technavio's analysts have elaborately explained the regional trends and drivers that shape the market during the forecast period.

See How Cranes Market Demand is Rising in APAC Request Free Sample
The market in Asia Pacific (APAC) is experiencing substantial expansion, primarily driven by the construction and industrial sectors. The construction sector holds a substantial market share, with countries such as China, India, Indonesia, Thailand, Vietnam, and Japan being major contributors. The utilities sector is also witnessing increased demand for cranes due to technological innovations. In particular, the use of cranes in setting up wind turbines is on the rise in countries like China, India, and Korea.
With a focus on infrastructure development and modernization, the market is expected to witness significant growth during the forecast period. The construction industry's continuous demand for cranes underpins the market's dynamism.
Market Dynamics
Our researchers analyzed the data with 2024 as the base year, along with the key drivers, trends, and challenges. A holistic analysis of drivers will help companies refine their marketing strategies to gain a competitive advantage.
The market encompasses a diverse range of products and services, from crane structural analysis software and hydraulic system maintenance procedures to load moment indicator calibration techniques and telematics data analysis for crane optimization. This market is characterized by a growing emphasis on preventative maintenance crane schedules and crane safety training program requirements, as well as the impact of wind speed on crane stability and the effects of ground conditions on crane setup. Crane component lifecycle management and heavy lift crane operational guidelines are also crucial aspects of the market, with optimization of crane lifting cycles and crane design for extreme weather conditions being key areas of focus.
Advanced crane control systems, remote monitoring of crane operations, and autonomous crane operation software are transforming the industry, enabling significant improvements in crane efficiency and safety. Crane operator certification standards are becoming increasingly stringent, reflecting the importance of skilled labor in ensuring optimal crane performance. The market is also witnessing a surge in the implementation of crane safety systems and analysis of crane failure data to minimize downtime and enhance overall productivity. Notably, the adoption of crane design for specific applications is a significant trend, with players focusing on customized solutions to cater to diverse industry needs. For instance, the construction sector demands cranes with high load capacities and excellent maneuverability, while the oil and gas industry requires cranes that can operate in extreme temperatures and harsh environments.
In contrast, the marine sector necessitates cranes that can withstand corrosive conditions and operate in confined spaces. A notable observation in the market is the disparity in investment levels between regions, with more than 60% of the global spending on cranes originating from developed economies. This trend is driven by the high capital-intensive nature of the industry and the prevalence of large-scale infrastructure projects in these regions. However, emerging economies are expected to witness robust growth, driven by the increasing demand for infrastructure development and industrialization. In conclusion, the market is a dynamic and evolving landscape, driven by advancements in technology, stringent safety regulations, and the growing demand for customized solutions.
Players in the market are focusing on optimizing crane performance, reducing fuel consumption, and improving safety and efficiency through the implementation of advanced technologies and best practices.
What are the key market drivers leading to the rise in the adoption of Cranes Industry?
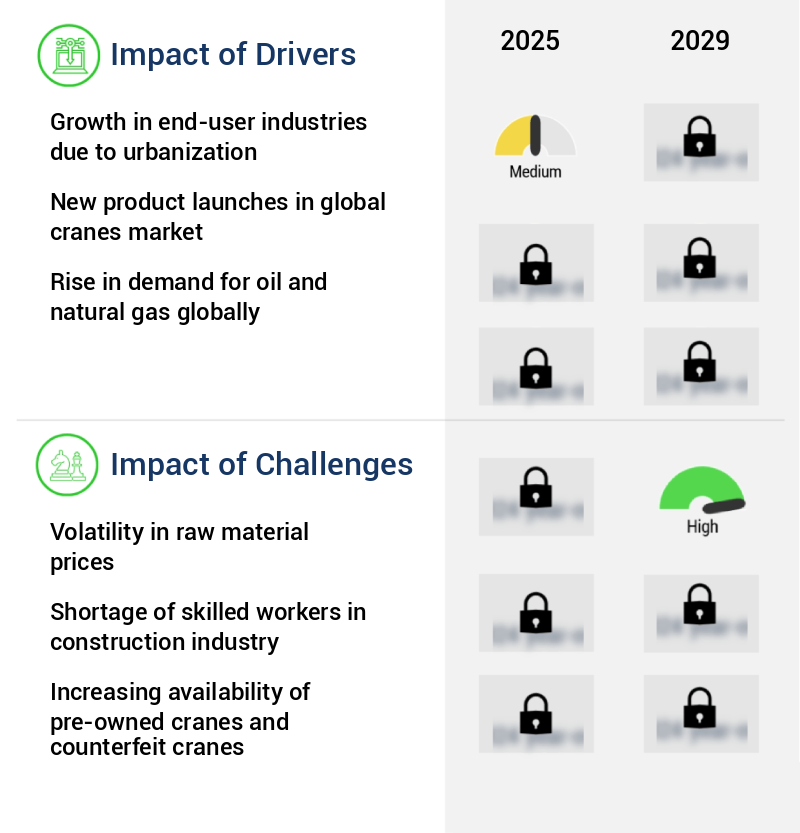
- Urbanization's impact on end-user industries is the primary catalyst for market growth. This trend is driven by the increasing population and economic development in urban areas, leading to a surge in demand for goods and services across various industries.
- The ongoing urbanization trend is driving growth in various sectors, including manufacturing, transportation and logistics, and utilities. This development is fueling the increasing demand for cranes in these industries. The number of megacities, defined as urban areas with over 10 million residents, is projected to expand substantially, particularly in developing countries like China, India, and South Africa, by the forecast period. Urban population growth is expected to surge, with estimates suggesting an additional 1 billion people will reside in urban areas by 2030.
- This expansion will necessitate substantial infrastructure development, further increasing the demand for cranes to support construction projects and maintain existing infrastructure. Cranes play a crucial role in various applications, such as lifting heavy materials and constructing high-rise buildings, making them indispensable in urbanization efforts.
What are the market trends shaping the Cranes Industry?
- The development of autonomous cranes represents a significant market trend in the construction industry. Autonomous crane technology is gaining increasing attention and adoption.
- Modern cranes integrate artificial intelligence (AI) to enhance their functionality and efficiency. AI enables cranes to operate autonomously, executing repetitive tasks without human intervention. Sensors installed in these cranes receive and transmit data, which AI algorithms analyze to make informed decisions. For instance, AI can prevent collisions by stopping crane movements when necessary. Furthermore, AI optimizes load handling, maximizing crane utilization rates and streamlining workflow processes.
- This results in faster project completion times and reduced labor costs. AI's predictive analytics capabilities enable cranes to learn from historical data, continuously improving performance and adapting to changing conditions. In essence, AI-driven cranes represent a significant leap forward in construction technology, offering numerous benefits for businesses in various sectors.
What challenges does the Cranes Industry face during its growth?
- The volatility in raw material prices poses a significant challenge to the industry's growth trajectory, requiring professionals to closely monitor and adapt to market fluctuations in order to mitigate potential risks and maximize profitability.
- Crane production costs are significantly influenced by the prices of major raw materials, including steel, hardened steel, and aluminum. In late 2023, iron ore was valued at approximately 111.84 USD per dry metric ton unit (dmtu). Raw material price fluctuations impact crane manufacturing costs, with suppliers raising prices to maintain profitability. Macroeconomic factors, such as inflation, labor costs, and regulatory policy changes, contribute to these price shifts.
- For instance, iron ore's price increase compels suppliers to pass on the added cost to downstream industries. This dynamic market environment underscores the importance of staying informed about raw material price trends to effectively manage crane production costs.
Exclusive Customer Landscape
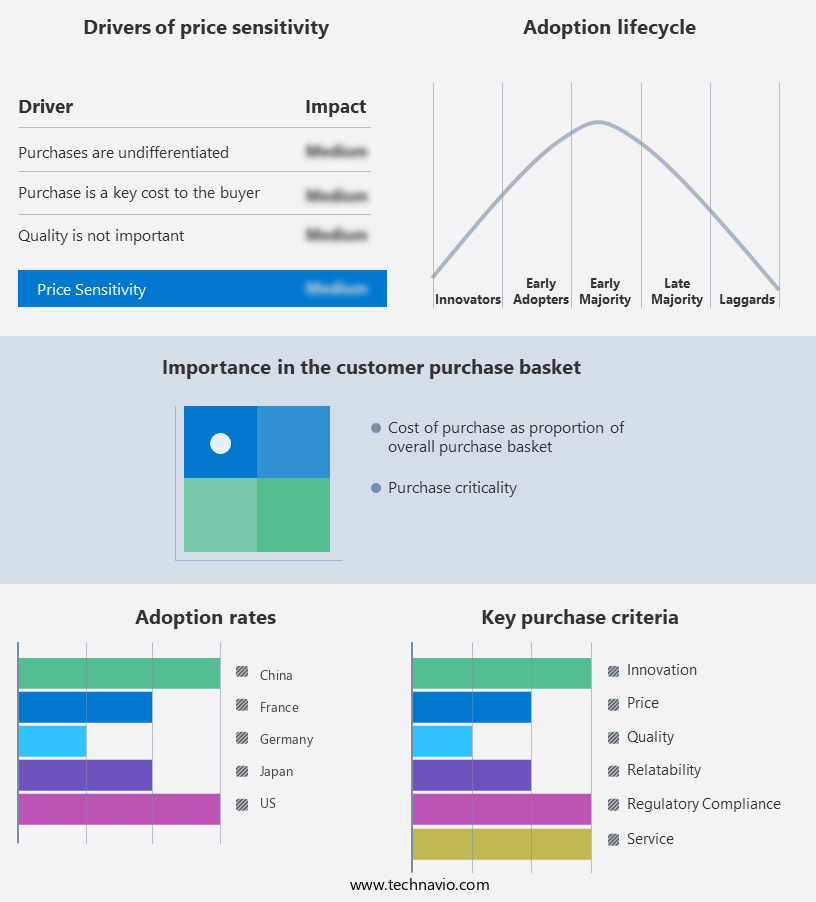
The cranes market forecasting report includes the adoption lifecycle of the market, covering from the innovator's stage to the laggard's stage. It focuses on adoption rates in different regions based on penetration. Furthermore, the cranes market report also includes key purchase criteria and drivers of price sensitivity to help companies evaluate and develop their market growth analysis strategies.
Customer Landscape of Cranes Industry
Competitive Landscape & Market Insights
Companies are implementing various strategies, such as strategic alliances, cranes market forecast, partnerships, mergers and acquisitions, geographical expansion, and product/service launches, to enhance their presence in the industry.
Altec Inc. - The company specializes in providing a range of industrial crane solutions, including Gantry, Floor Mounted Jib, and Articulating Jib Cranes, catering to diverse lifting needs with a focus on efficiency and safety.
The industry research and growth report includes detailed analyses of the competitive landscape of the market and information about key companies, including:
- Altec Inc.
- Columbus McKinnon Corp.
- Ebara Corp.
- Fassi Gru S.p.A.
- FURUKAWA Co. Ltd.
- KATO WORKS CO. LTD.
- Kobe Steel Ltd.
- Konecranes
- Liebherr International AG
- Manitex International Inc.
- PALFINGER AG
- Sany Group
- SENNEBOGEN Maschinenfabrik GmbH
- Shanghai Zhenhua Heavy Industries Co. Ltd.
- Sumitomo Heavy Industries Ltd.
- Tadano Ltd.
- Terex Corp.
- The Manitowoc Co. Inc.
- Xuzhou Construction Machinery Group Co. Ltd.
- Zoomlion Heavy Industry Science and Technology Co. Ltd.
Qualitative and quantitative analysis of companies has been conducted to help clients understand the wider business environment as well as the strengths and weaknesses of key industry players. Data is qualitatively analyzed to categorize companies as pure play, category-focused, industry-focused, and diversified; it is quantitatively analyzed to categorize companies as dominant, leading, strong, tentative, and weak.
Recent Development and News in Cranes Market
- In January 2024, Terex Corporation, a leading crane manufacturer, announced the launch of its new all-terrain crane model, Terex ATF 80-3.1, with a maximum capacity of 80 tons. This new product entry expanded Terex's product portfolio and catered to the growing demand for heavy-duty cranes in infrastructure projects (Terex Corporation Press Release, 2024).
- In March 2024, Liebherr-Werk Ehingen GmbH, a German crane manufacturer, and Siemens AG, a global technology powerhouse, signed a strategic partnership agreement. The collaboration aimed to integrate Industry 4.0 technologies into Liebherr's cranes, enhancing their operational efficiency and performance (Liebherr Press Release, 2024).
- In July 2024, Manitowoc Company, Inc. completed the acquisition of National Crane, a leading all-terrain and rough-terrain crane manufacturer. This acquisition expanded Manitowoc's product offerings and strengthened its market position in the crane industry (Manitowoc Company Press Release, 2024).
- In May 2025, the European Union passed the new Cranes Regulation (EU) 2025/123, which sets stricter safety standards for cranes and lifting equipment. The regulation, effective from 2026, aims to reduce accidents and improve overall safety in the crane industry (European Parliament and Council of the European Union Press Release, 2025).
Dive into Technavio's robust research methodology, blending expert interviews, extensive data synthesis, and validated models for unparalleled Cranes Market insights. See full methodology.
|
Market Scope |
|
|
Report Coverage |
Details |
|
Page number |
246 |
|
Base year |
2024 |
|
Historic period |
2019-2023 |
|
Forecast period |
2025-2029 |
|
Growth momentum & CAGR |
Accelerate at a CAGR of 7.4% |
|
Market growth 2025-2029 |
USD 29.61 billion |
|
Market structure |
Fragmented |
|
YoY growth 2024-2025(%) |
6.8 |
|
Key countries |
China, US, Japan, India, South Korea, Germany, UK, Australia, France, and Canada |
|
Competitive landscape |
Leading Companies, Market Positioning of Companies, Competitive Strategies, and Industry Risks |
Research Analyst Overview
- In the dynamic and evolving world of construction equipment, the crane market continues to unfold with significant advancements and shifting trends. Two key aspects driving this industry's progress are undercarriage design and emission standards. Undercarriage designs have seen substantial innovation, with manufacturers focusing on enhancing durability and reducing weight for improved operational efficiency. For instance, some cranes feature flexible undercarriages that adapt to various terrains, ensuring stability and reducing the risk of damage. Emission standards have emerged as a significant factor in the crane market, with regulatory bodies mandating stricter guidelines to minimize environmental impact.
- As a result, crane manufacturers have responded by developing advanced emission control systems for their hydraulic and electrical systems. Tower cranes, a staple in the construction industry, have undergone significant transformations. Load charts and boom length have been optimized to increase load capacity and lifting height, while load moment indicators and stability analysis tools have been integrated to ensure safety and precision. Maintenance schedules and inspection procedures have become increasingly crucial in the crane market. Regular maintenance of components, such as the counterweight system and hoisting and slewing mechanisms, is essential for ensuring structural integrity and longevity.
- Operational efficiency is another area of focus, with advancements in remote control operation, autonomous operation, and telematics systems enabling real-time monitoring and optimization of crane performance. Cranes come in various types, including crawler cranes, mobile cranes, rough terrain cranes, overhead cranes, and heavy lift cranes, each catering to unique applications and requirements. The competition among these types is fierce, with manufacturers continually striving to improve performance, safety features, and fuel efficiency. In summary, the crane market is characterized by continuous innovation and adaptation to meet the evolving needs of the construction industry.
- From undercarriage design to emission standards, operational efficiency to safety features, the industry remains a dynamic and exciting space to watch.
What are the Key Data Covered in this Cranes Market Research and Growth Report?
-
What is the expected growth of the Cranes Market between 2025 and 2029?
-
USD 29.61 billion, at a CAGR of 7.4%
-
-
What segmentation does the market report cover?
-
The report segmented by Product (Mobile cranes, Fixed cranes, and Marine and port cranes), Application (Construction and mining, Industrial, and Utilities), Capacity (Heavy duty, Medium duty, and Light duty), Method (Hydraulic, Electric, Diesel, Pneumatic, and Mechanical), and Geography (APAC, Europe, North America, South America, and Middle East and Africa)
-
-
Which regions are analyzed in the report?
-
APAC, Europe, North America, South America, and Middle East and Africa
-
-
What are the key growth drivers and market challenges?
-
Growth in end-user industries due to urbanization, Volatility in raw material prices
-
-
Who are the major players in the Cranes Market?
-
Key Companies Altec Inc., Columbus McKinnon Corp., Ebara Corp., Fassi Gru S.p.A., FURUKAWA Co. Ltd., KATO WORKS CO. LTD., Kobe Steel Ltd., Konecranes, Liebherr International AG, Manitex International Inc., PALFINGER AG, Sany Group, SENNEBOGEN Maschinenfabrik GmbH, Shanghai Zhenhua Heavy Industries Co. Ltd., Sumitomo Heavy Industries Ltd., Tadano Ltd., Terex Corp., The Manitowoc Co. Inc., Xuzhou Construction Machinery Group Co. Ltd., and Zoomlion Heavy Industry Science and Technology Co. Ltd.
-
Market Research Insights
- The market encompasses a diverse range of lifting solutions, with key components including wire rope, hook block assemblies, and engine power. Two significant trends shaping the market are regulatory compliance and technological advancements. According to industry data, regulatory compliance costs are projected to account for 15% of the total crane market expenditure by 2025. Meanwhile, the integration of advanced technologies, such as wind speed sensors, load monitoring systems, and anti-collision systems, is driving up engine power requirements. For instance, modern cranes with advanced safety features may require engines with a power output of up to 1,500 horsepower. Another critical aspect is operator fatigue management, which is addressed through features like swing radius adjustment and cab design.
- The market's continuous evolution is further reflected in the increasing importance of cable management, ground pressure control, and hydraulic pressure systems. Lifting capacity, which is a crucial performance metric, is influenced by factors like jib design, luffing system, and pulley system, with capacities ranging from 20 to over 1,000 tons. Regular maintenance, including lubrication intervals and component wear monitoring, is essential to ensure optimal performance and safety.
We can help! Our analysts can customize this cranes market research report to meet your requirements.
 RIA -
RIA - 
