
Load Monitoring Systems Market Size 2026-2030
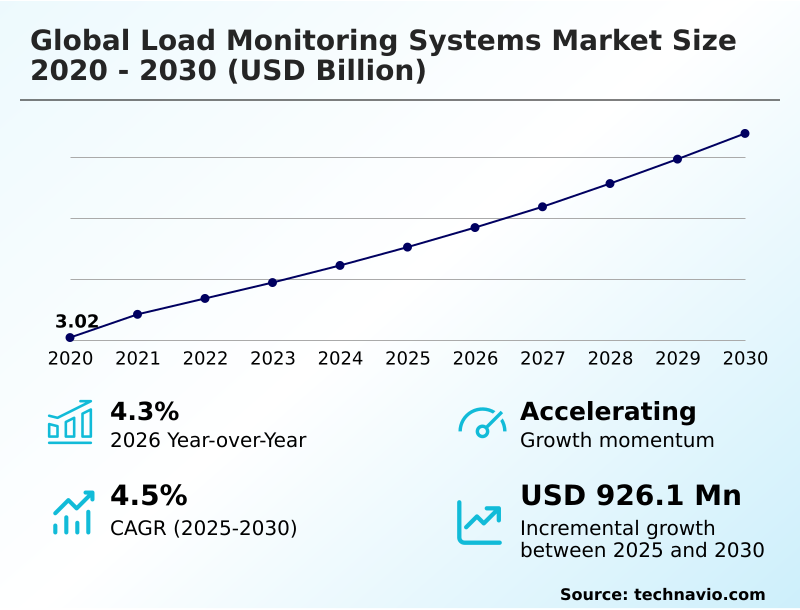
The load monitoring systems market size is valued to increase by USD 926.1 million, at a CAGR of 4.5% from 2025 to 2030. Increasing emphasis on safety standards across various industries will drive the load monitoring systems market.
Major Market Trends & Insights
- Europe dominated the market and accounted for a 37.5% growth during the forecast period.
- By Product - Load cell segment was valued at USD 1.87 billion in 2024
- By Technology - Analog segment accounted for the largest market revenue share in 2024
Market Size & Forecast
- Market Opportunities: USD 1.67 billion
- Market Future Opportunities: USD 926.1 million
- CAGR from 2025 to 2030 : 4.5%
Market Summary
- The Load Monitoring Systems Market is characterized by a strong emphasis on operational safety and efficiency, propelled by stringent regulatory frameworks across industries like construction, manufacturing, and logistics. This demand is met by continuous technological advancements, particularly the shift toward digital sensor technology and integrated weighing solutions that provide real-time data.
- The adoption of wireless load cell and IoT-enabled systems represents a significant trend, enabling remote monitoring and predictive maintenance, which are critical for minimizing downtime. For instance, in a large-scale port operation, integrating a wireless tension link system into crane safety systems allows for real-time load data analytics, preventing overloads and optimizing container handling schedules.
- However, market expansion faces headwinds from the high initial capital investment required for advanced data acquisition systems and the complexities of integrating them into legacy infrastructure. Furthermore, concerns about quantifying the return on investment and ongoing calibration services can slow adoption, particularly for small and medium-sized enterprises.
- The industry is navigating these challenges by focusing on modular designs and value-based solutions that demonstrate clear operational benefits, such as enhanced asset integrity monitoring and improved safety compliance.
What will be the Size of the Load Monitoring Systems Market during the forecast period?
Get Key Insights on Market Forecast (PDF) Request Free Sample
How is the Load Monitoring Systems Market Segmented?
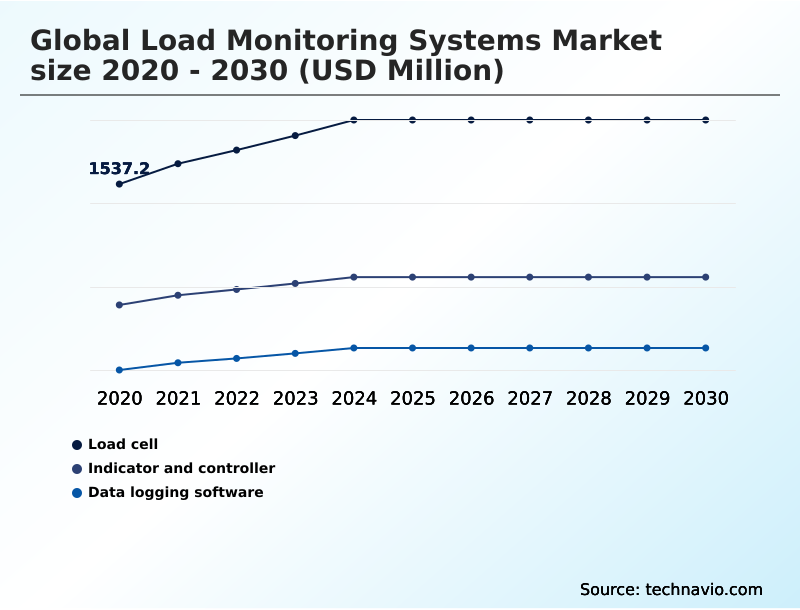
The load monitoring systems industry research report provides comprehensive data (region-wise segment analysis), with forecasts and estimates in "USD million" for the period 2026-2030, as well as historical data from 2020-2024 for the following segments.
- Product
- Load cell
- Indicator and controller
- Data logging software
- Technology
- Analog
- Digital
- End-user
- Material handling and logistics
- Energy and utilities
- Aerospace and defense
- Marine and offshore
- Construction and infrastructure
- Geography
- Europe
- Germany
- UK
- France
- North America
- US
- Canada
- Mexico
- APAC
- China
- India
- Japan
- South America
- Brazil
- Argentina
- Middle East and Africa
- Saudi Arabia
- UAE
- South Africa
- Rest of World (ROW)
- Europe
By Product Insights
The load cell segment is estimated to witness significant growth during the forecast period.
The load cell segment is fundamental to the market, providing the core sensor technology for precise force measurement. These components, including the primary strain gauge sensor and more specialized piezoelectric sensors, are crucial for a range of weighing solutions.
Applications span from silo weighing systems to complex process control weighing, where a high-precision load cell is essential for quality assurance.
Devices such as the load pin, force transducer, and torque transducer are integrated into systems for comprehensive asset integrity monitoring. Innovations are enabling a multi-axis sensor to capture complex force vectors, essential for advanced structural load testing.
In critical manufacturing applications, deploying a superior load cell has been shown to reduce measurement errors by up to 15%, enhancing operational integrity.
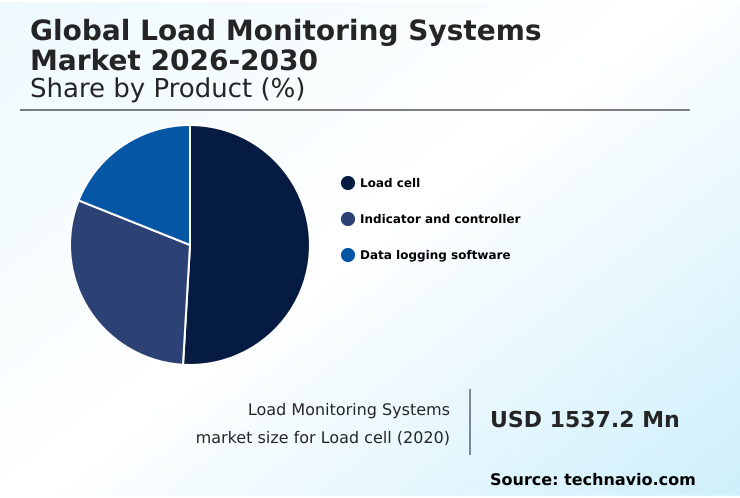
The Load cell segment was valued at USD 1.87 billion in 2024 and showed a gradual increase during the forecast period.
Regional Analysis
Europe is estimated to contribute 37.5% to the growth of the global market during the forecast period.Technavio’s analysts have elaborately explained the regional trends and drivers that shape the market during the forecast period.
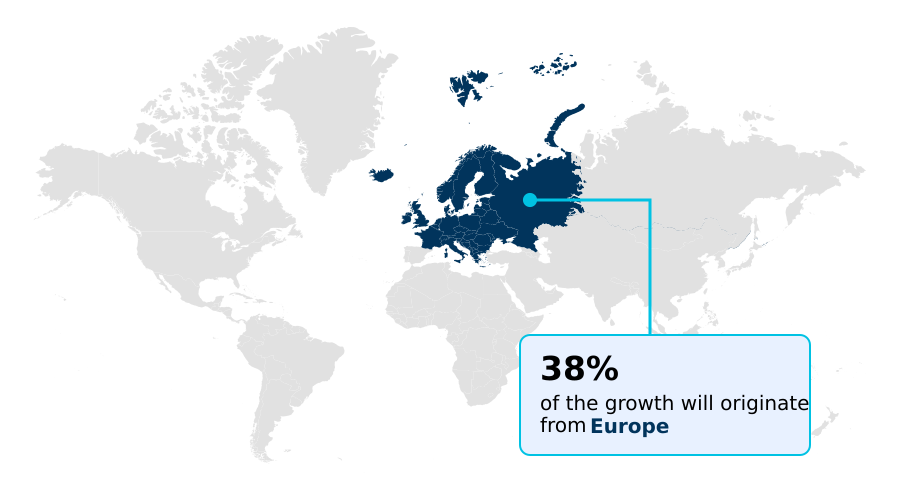
See How Load Monitoring Systems Market Demand is Rising in Europe Request Free Sample
The geographic landscape is defined by regional specializations in application and technology adoption. In developed regions, the focus is on advanced structural health monitoring and dynamic load measurement, where telemetry load monitoring systems reduce inspection costs by up to 40%.
The demand for high-capacity load cells is prominent in heavy lift monitoring for energy and infrastructure projects.
In emerging economies, growth is driven by the need for reliable vehicle weighing solutions and onboard weighing systems to support logistics, where accurate measurements can improve freight efficiency by 15%.
Across all regions, the use of specialized components like the tension link and compression load cell is expanding, addressing specific industrial needs from mooring line tension management to hygienic weighing solutions in regulated sectors.
Market Dynamics
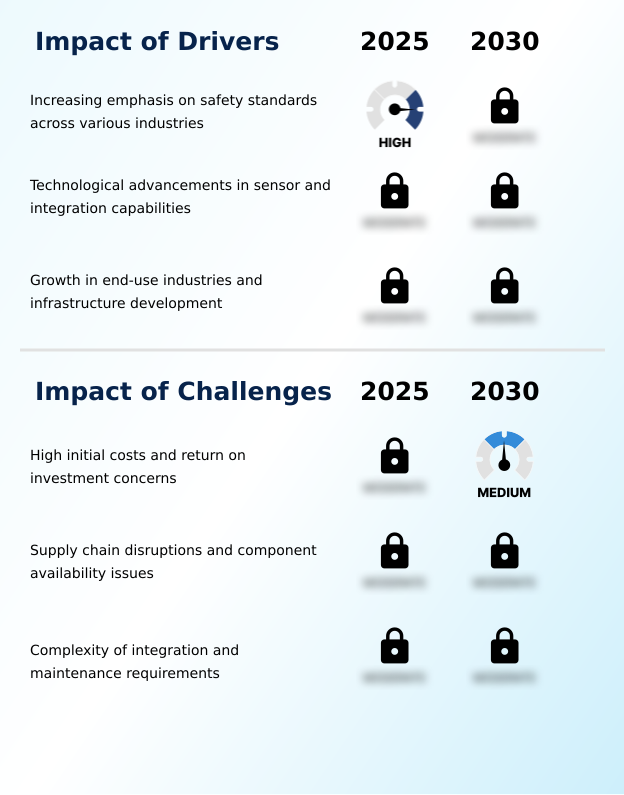
Our researchers analyzed the data with 2025 as the base year, along with the key drivers, trends, and challenges. A holistic analysis of drivers will help companies refine their marketing strategies to gain a competitive advantage.
- The practical application of advanced systems is becoming highly specialized, addressing nuanced industrial challenges. For example, implementing a wireless load cell for crane safety is now a standard practice in construction and port operations to prevent accidents. In processing industries, the use of a digital load cell for tank weighing ensures precise inventory management and batch control.
- The aerospace sector depends on a multi-axis sensor for aerospace testing to validate structural integrity under complex stress conditions. Similarly, a load pin for offshore mooring applications is critical for ensuring the stability of maritime assets. A key theme is the shift toward proactive asset management, where predictive maintenance for industrial machinery, informed by continuous load data, is essential.
- Businesses frequently ask how to integrate load monitoring systems with existing enterprise software, a challenge addressed by modern systems with open APIs. For logistics, an iot-enabled load cell for logistics provides end-to-end cargo visibility. The demand for a high-precision load cell for laboratories supports research and development, while load monitoring for renewable energy projects ensures the durability of wind turbines.
- Heavy lift load monitoring solutions are indispensable for major infrastructure projects. The debate over analog versus digital load cell accuracy continues, with digital systems showing a 25% lower signal-to-noise ratio in high-interference environments. Load monitoring systems for construction safety are mandated by regulations in many regions.
- The availability of load cell calibration and repair services is a key factor in long-term operational planning. Furthermore, remote monitoring of structural loads is vital for aging infrastructure.
- Other key applications include force measurement for manufacturing testing, improving onboard vehicle weighing system accuracy, developing custom load cells for research applications, and using load monitoring software with cloud integration for accessible data. Real-time data analytics for load cells and strain gauge sensors for structural health complete the modern monitoring ecosystem.
What are the key market drivers leading to the rise in the adoption of Load Monitoring Systems Industry?
- The market's growth is significantly driven by an increasing emphasis on safety standards and regulatory compliance across a multitude of industries.
- A primary market driver is the intensified focus on lifting equipment safety and overload protection, mandated by stringent industry regulations. The need for certified weighing equipment in crane safety systems and other critical applications makes precise load measurement essential.
- This is fueling demand for reliable force sensor and strain gauge-based sensors. While the traditional analog load cell remains relevant in some contexts, the push for auditable safety records is accelerating the adoption of systems that support automated weighing processes.
- These systems are integral to industrial force measurement and structural and mechanical load monitoring. For instance, implementing automated process weighing applications has been shown to increase compliance with safety standards by 35%, while also improving throughput.
- This regulatory pressure ensures that robust machine safety systems are no longer optional but a fundamental requirement for operational licensure in many sectors.
What are the market trends shaping the Load Monitoring Systems Industry?
- A key market trend is the accelerating adoption of wireless and IoT-enabled load monitoring solutions. This shift facilitates remote data access and enhances integration with digital industrial ecosystems.
- Market trends are defined by the convergence of connectivity and data intelligence. The adoption of the wireless load cell and IoT-enabled load cell is accelerating, facilitating real-time monitoring and remote monitoring of assets, which has been shown to improve operational response times by up to 25%.
- This shift is complemented by the move toward the digital load cell, which offers superior signal integrity and pairs seamlessly with advanced data logging software. These platforms enable sophisticated load data analytics and form the basis for predictive maintenance strategies.
- As a result, companies are leveraging wireless monitoring solutions and modern digital sensor technology, integrated with industrial automation platforms, to gain deeper insights. This transition enables more dynamic and proactive management of industrial assets, with real-time data analytics reducing diagnostic errors by 18%.
What challenges does the Load Monitoring Systems Industry face during its growth?
- A key challenge impeding market growth is the high initial cost of advanced systems and the associated concerns regarding return on investment.
- Key market challenges revolve around system complexity and total cost of ownership. Integrating a new data acquisition system often requires custom force sensors and specialized hardware like a weighing indicator or signal conditioner, which can be difficult in environments with legacy equipment.
- The need for frequent load cell calibration and ongoing calibration services adds to operational expenditures, with some firms reporting that maintenance accounts for up to 20% of the system's lifetime cost. Machinery load assessment in a load cell for harsh environments requires robust components, such as a load shackle designed for continuous signal monitoring.
- Deploying these systems, from bolt-on strain sensing for tension monitoring to comprehensive industrial weighing solutions, demands significant upfront investment and technical expertise, creating barriers to adoption for smaller enterprises.
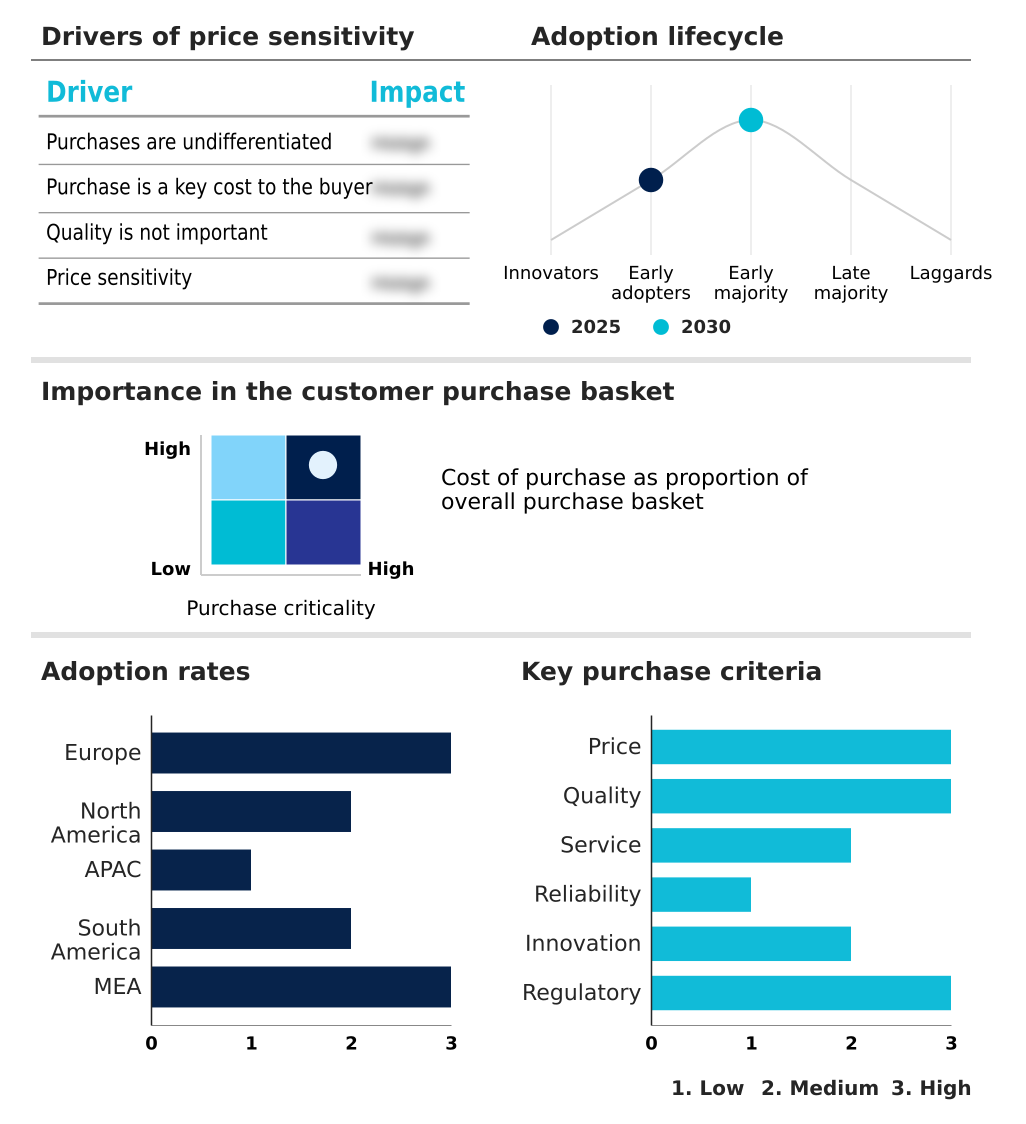
Exclusive Technavio Analysis on Customer Landscape
The load monitoring systems market forecasting report includes the adoption lifecycle of the market, covering from the innovator’s stage to the laggard’s stage. It focuses on adoption rates in different regions based on penetration. Furthermore, the load monitoring systems market report also includes key purchase criteria and drivers of price sensitivity to help companies evaluate and develop their market growth analysis strategies.
Customer Landscape of Load Monitoring Systems Industry
Competitive Landscape
Companies are implementing various strategies, such as strategic alliances, load monitoring systems market forecast, partnerships, mergers and acquisitions, geographical expansion, and product/service launches, to enhance their presence in the industry.
Applied Measurements Ltd. - Offers integrated load monitoring systems bundling calibrated instrumentation with force sensors for immediate out-of-the-box deployment in industrial applications.
The industry research and growth report includes detailed analyses of the competitive landscape of the market and information about key companies, including:
- Applied Measurements Ltd.
- Datum Electronics Ltd.
- Dynamic Load Monitor UK Ltd.
- Eilersen Electric Digital AS
- Flintec Group AB
- Interface Inc.
- JCM Load Monitoring Ltd.
- Kistler Group
- LCM Systems Ltd.
- Load Monitoring Systems
- Mettler Toledo Inc.
- Precia SA
- Rice Lake weighing systems
- Spectris plc
- Strainsert Co.
- Thames Side Sensors Ltd.
- Vishay Precision Group Inc.
- WIKA
- Wirop Industrial Co. Ltd.
- Zemic Europe BV
Qualitative and quantitative analysis of companies has been conducted to help clients understand the wider business environment as well as the strengths and weaknesses of key industry players. Data is qualitatively analyzed to categorize companies as pure play, category-focused, industry-focused, and diversified; it is quantitatively analyzed to categorize companies as dominant, leading, strong, tentative, and weak.
Recent Development and News in Load monitoring systems market
- In August 2024, Mettler Toledo launched its XPR Essential Laboratory Balances, enhancing weighing accuracy for laboratory and industrial applications and supporting growth in research-driven sectors.
- In October 2024, Vishay Precision Group introduced the G6 multifunctional instrument under its BLH Nobel brand, enhancing its portfolio with advanced features for multifunctional applications, improving accuracy and versatility in load monitoring.
- In February 2025, Flintec introduced the PC4 single-point load cell, designed to enhance precision in industrial weighing with improved environmental sealing and overload protection, aligning with demands for hygienic and accurate solutions.
- In March 2025, Flintec launched the SSB7 high-performance load cell, specifically designed for onboard vehicle weighing applications, offering improved durability and accuracy to address needs in transportation and logistics.
Dive into Technavio’s robust research methodology, blending expert interviews, extensive data synthesis, and validated models for unparalleled Load Monitoring Systems Market insights. See full methodology.
| Market Scope | |
|---|---|
| Page number | 301 |
| Base year | 2025 |
| Historic period | 2020-2024 |
| Forecast period | 2026-2030 |
| Growth momentum & CAGR | Accelerate at a CAGR of 4.5% |
| Market growth 2026-2030 | USD 926.1 million |
| Market structure | Fragmented |
| YoY growth 2025-2026(%) | 4.3% |
| Key countries | Germany, UK, France, Italy, Spain, The Netherlands, US, Canada, Mexico, China, India, Japan, South Korea, Australia, Indonesia, Brazil, Argentina, Chile, Saudi Arabia, UAE, South Africa, Qatar and Egypt |
| Competitive landscape | Leading Companies, Market Positioning of Companies, Competitive Strategies, and Industry Risks |
Research Analyst Overview
- The Load Monitoring Systems Market is advancing beyond simple load measurement, evolving into an integrated ecosystem for asset integrity and operational intelligence. The core of this evolution lies in sophisticated components like the strain gauge sensor, force sensor, and specialized load pin and load shackle designs.
- This technological shift impacts boardroom strategy, particularly in budgeting for predictive maintenance programs, which rely on data from these systems. The move from a basic analog load cell to an intelligent, networked digital load cell, often a wireless load cell or IoT-enabled load cell, is central.
- These systems provide real-time monitoring and support comprehensive weighing solutions for industrial weighing and onboard weighing. Key offerings now include not just the compression load cell or tension link but also the surrounding data acquisition system, signal conditioner, and data logging software. Boardroom decisions now factor in the total cost of ownership, which includes ongoing calibration services.
- Implementing robust tension monitoring and overload protection has demonstrated a reduction in critical equipment failures by over 30%, directly influencing insurance premiums and operational risk profiles. This makes dynamic load measurement and high-capacity load cells critical investments for process control weighing and structural health monitoring.
What are the Key Data Covered in this Load Monitoring Systems Market Research and Growth Report?
-
What is the expected growth of the Load Monitoring Systems Market between 2026 and 2030?
-
USD 926.1 million, at a CAGR of 4.5%
-
-
What segmentation does the market report cover?
-
The report is segmented by Product (Load cell, Indicator and controller, and Data logging software), Technology (Analog, and Digital), End-user (Material handling and logistics, Energy and utilities, Aerospace and defense, Marine and offshore, and Construction and infrastructure) and Geography (Europe, North America, APAC, South America, Middle East and Africa)
-
-
Which regions are analyzed in the report?
-
Europe, North America, APAC, South America and Middle East and Africa
-
-
What are the key growth drivers and market challenges?
-
Increasing emphasis on safety standards across various industries, High initial costs and return on investment concerns
-
-
Who are the major players in the Load Monitoring Systems Market?
-
Applied Measurements Ltd., Datum Electronics Ltd., Dynamic Load Monitor UK Ltd., Eilersen Electric Digital AS, Flintec Group AB, Interface Inc., JCM Load Monitoring Ltd., Kistler Group, LCM Systems Ltd., Load Monitoring Systems, Mettler Toledo Inc., Precia SA, Rice Lake weighing systems, Spectris plc, Strainsert Co., Thames Side Sensors Ltd., Vishay Precision Group Inc., WIKA, Wirop Industrial Co. Ltd. and Zemic Europe BV
-
Market Research Insights
- Market dynamics are increasingly shaped by the push for digital transformation, with the adoption of digital sensor technology improving measurement accuracy by over 20% compared to legacy analog systems. Industrial automation platforms are leveraging this precision for enhanced process control.
- The integration of real-time data analytics enables proactive machinery load assessment, with some firms reporting a 15% reduction in unscheduled downtime. Applications for hygienic weighing solutions are expanding, driven by regulatory demands in the food and pharmaceutical sectors.
- Furthermore, the deployment of certified weighing equipment is now a prerequisite for many industrial force measurement tasks, tightening compliance and elevating the importance of reliable, high-performance systems for maintaining operational integrity and safety.
We can help! Our analysts can customize this load monitoring systems market research report to meet your requirements.
 RIA -
RIA - 
