Crawler Camera System Market Analysis North America, APAC, Europe, Middle East and Africa, South America - US, China, Russia, India, UK - Size and Forecast 2024-2028

Crawler Camera System Market Analysis North America, APAC, Europe, Middle East and Africa, South America - US, China, Russia, India, UK - Size and Forecast 2024-2028

Published: Aug 2024 153 Pages SKU: IRTNTR75188

Market Overview at a Glance

$5.47 B
Market Opportunity
21.04%
CAGR
17.11
YoY growth 2023-2024(%)

Crawler Camera System Market Size 2024-2028

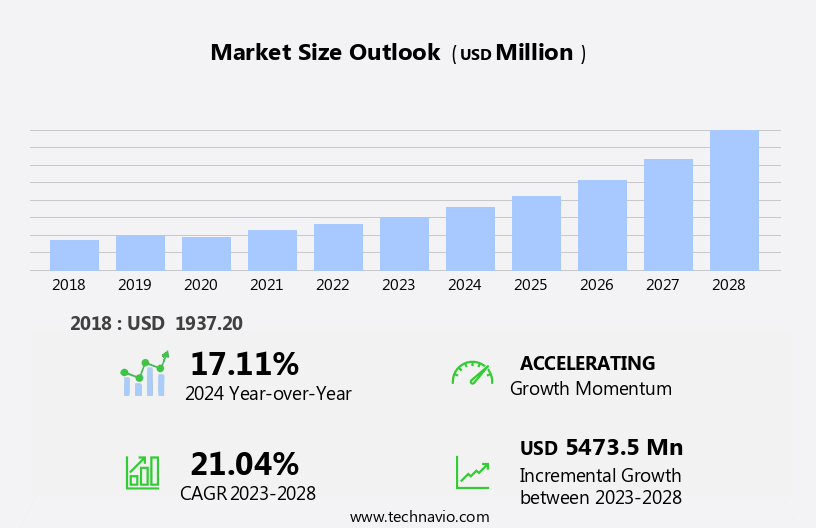
The crawler camera system market size is forecast to increase by USD 5.47 billion at a CAGR of 21.04% between 2023 and 2028.

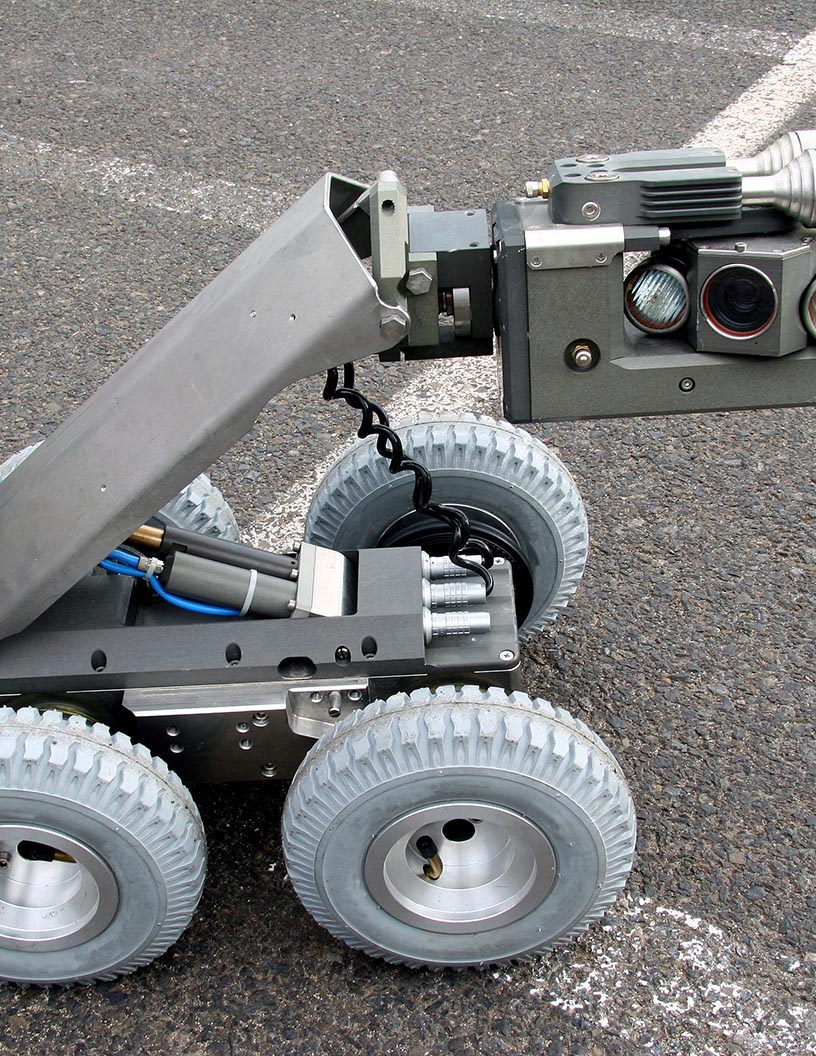
  • The infrastructure inspection camera market is experiencing significant growth, fueled by increasing urbanization and the resulting demand for efficient infrastructure maintenance. Technological advancements in security cameras and manufacturing have yielded more durable and resilient systems, mitigating the vulnerability of traditional cameras. 
  • These advancements, coupled with the need for proactive maintenance in sectors like transportation, utilities, and construction, are driving market expansion and creating new applications. While challenges such as high implementation costs and the need for robust data solutions persist, continued innovation and investment promise a bright future for the market.

What will be the Size of the Crawler Camera System Market During the Forecast Period?

Crawler Camera System Market Size

 Request Free Sample

  • The market is experiencing significant growth due to the increasing demand for sophisticated inspection tools in various industries, particularly in subsea activities and pipeline assessment. Pipeline inspection technology, including crawler camera systems, plays a crucial role in ensuring the optimal condition of pipelines by providing real-time footage of pipeline interiors. Cutting-edge industrial sensors, such as laser profiling and ultrasonic thickness gauges, enable precise measurements and detection of pipeline conditions. Governmental regulations mandating regular visual inspections of pipelines and sewer lines further fuel market expansion. Crawler camera systems are essential for inspecting clogged municipal sewer systems and residential household pipes, ensuring the prevention of unplanned downtime and potential hazards.
  • Innovative product launches featuring advanced software solutions, such as asset management software, are transforming the market by enabling long-term planning and efficient asset management. The integration of cutting-edge technologies, like artificial intelligence and machine learning, enhances the capabilities of crawler camera systems, providing valuable insights for decision-making in hazardous spaces with dimensional restraint. Software selection is a critical factor In the adoption of crawler camera systems, as it facilitates the efficient analysis of data collected during inspections, enabling preventive measures to be taken in a timely manner. Overall, the market is poised for continued growth as the demand for reliable and efficient pipeline inspection solutions increases.

How is this Crawler Camera System Industry segmented and which is the largest segment?

The crawler camera system industry research report provides comprehensive data (region-wise segment analysis), with forecasts and estimates in "USD billion" for the period 2024-2028, as well as historical data from 2018-2022 for the following segments.
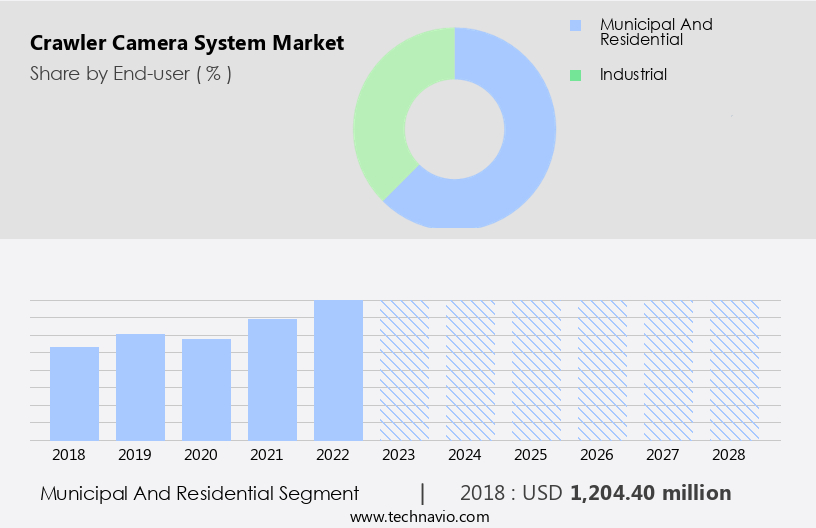
  • End-user
    • Municipal and residential
    • Industrial
  • Application
    • Pipeline inspection
    • Drain inspection
    • Tank and cavity inspection
  • Geography
    • North America
      • US
    • APAC
      • China
      • India
    • Europe
      • UK
    • Middle East and Africa
    • South America

By End-user Insights

  • The municipal and residential segment is estimated to witness significant growth during the forecast period.

The municipal and residential sectors are experiencing significant growth due to increasing urbanization and the subsequent rise in human activities. By 2050, over two-thirds of the global population is projected to live in urban areas, leading to increased generation of municipal solid waste (MSW). Crawler camera systems have gained increasing demand in response to this trend, as they play a crucial role in smart waste management. These systems incorporate cutting-edge sensors, such as laser profiling and ultrasonic thickness gauges, for pipeline inspection technology. They enable real-time video streaming and remote control, ensuring operational efficiency and cost savings. Additionally, they are essential for inspecting sewer lines in hazardous spaces, preventing unplanned downtime and ensuring regulatory compliance.

Crawler Camera System Market Size

Get a glance at the  Crawler Camera System Industry report of share of various segments Request Free Sample

The Municipal and residential segment was valued at USD 1.2 billion in 2018 and showed a gradual increase during the forecast period.

Regional Analysis

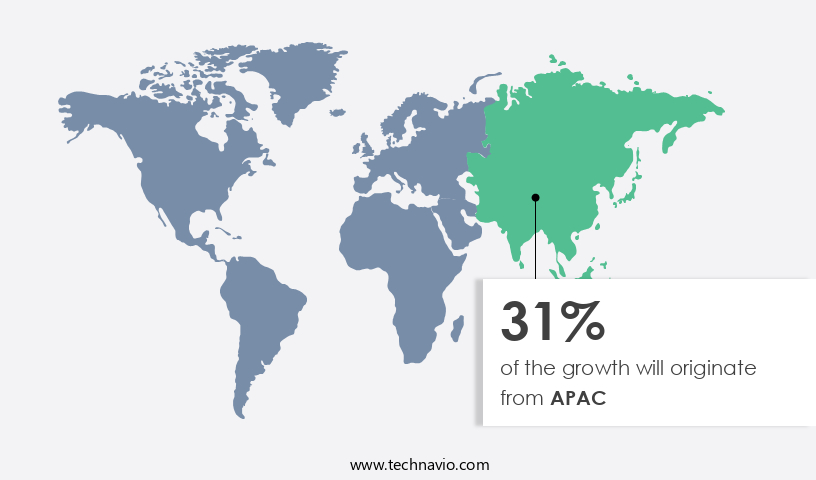
  • APAC is estimated to contribute 31% to the growth of the global market during the forecast period.

Technavio's analysts have elaborately explained the regional trends and drivers that shape the market during the forecast period.

Crawler Camera System Market Share by Geography

For more insights on the market share of various regions, Request Free Sample

The market in North America, with the US being a significant contributor, experiences substantial growth due to the widespread adoption of process automation technologies in various industries. Industries such as petrochemicals, oil and gas, food and beverages, automobiles, healthcare services, electrical and electronics, and others, utilize crawler camera systems for inspecting industrial pipes. In 2022, the US ranked 9th globally in robot density factor, with manufacturing industries employing over 250 robots per 10,000 employees, according to the International Robotics Federation. This trend is driven by the increasing demand for sophisticated inspection tools, including crawler camera systems, for subsea activities, pipeline inspection, and asset management.

Governmental regulations mandate regular visual inspections of pipelines for safety and operational efficiency. Crawler camera systems, equipped with cutting-edge sensors like laser profiling and ultrasonic thickness gauges, provide real-time footage for preventive measures and long-term planning. Asset management software, customized constructions, training, spares, and financial incentives further support the market's growth. Additionally, crawler camera systems are increasingly used in sewer lines for clogged municipal systems, residential households, and hazardous spaces, where human intervention is challenging or impossible due to dimensional restraint. Innovative product launches and operational expenses are essential factors influencing market growth.

Market Dynamics

Our  researchers analyzed the data with 2023 as the base year, along with the key drivers, trends, and challenges. A holistic analysis of drivers will help companies refine their marketing strategies to gain a competitive advantage.

What are the key market drivers leading to the rise In the adoption of Crawler Camera System Industry?

Increasing urbanization is the key driver of the market.

  • The pipeline assessment market is experiencing significant growth due to the increasing demand for sophisticated inspection tools in subsea activities. Pipeline inspection technology, including crawler camera systems equipped with cutting-edge sensors such as laser profiling and ultrasonic thickness gauges, plays a crucial role in evaluating pipeline conditions for long-term planning and plant asset management. Governmental regulations mandate regular inspections to ensure safety and prevent unplanned downtime. Crawler camera systems enable real-time video streaming and remote control, providing operational efficiency and cost savings. Robotic maneuverability allows for access to hazardous spaces and dimensional restraint, making them essential for pipeline inspections. Financial incentives and training programs encourage the adoption of cutting-edge technologies, leading to innovative product launches and improvements in pipeline inspection.
  • Asset management software is increasingly being used to analyze data collected during inspections, enabling preventive measures and reducing operational expenses. Crawler camera systems are not only used in pipeline inspections but also in sewer lines to assess conditions in clogged municipal sewer systems and residential households. With the increasing focus on infrastructure development, the demand for crawler camera systems is expected to continue growing.

What are the market trends shaping the Crawler Camera System Industry?

Technological advancements is the upcoming market trend.

  • The market is experiencing significant growth due to the increasing demand for pipeline assessment in subsea activities. Sophisticated inspection tools, such as cutting-edge sensors like laser profiling and ultrasonic thickness gauges, are being utilized to evaluate pipeline conditions. Governmental regulations mandating regular pipeline inspections are driving market expansion. Advanced technologies, including real-time video streaming, remote control, and robotic maneuverability, are enhancing pipeline inspection technology. Operational expenses are being reduced through preventive measures, such as asset management software, which facilitates long-term planning and customized constructions. Innovative product launches, such as AI-powered crawler camera systems, are revolutionizing the market. These systems enable real-time footage analysis, providing early detection of issues and minimizing unplanned downtime.
  • Furthermore, the integration of AI and IoT in crawler camera systems is enabling advanced visual inspections and prescriptive repair solutions. The use of AI and IoT empowers inspection robots to detect defects and issues through visual inspection and acoustic inspection. For example, AI-enabled sensors in inspection robots can detect changes in noise, vibration, or harshness (NVH), which can indicate potential issues. Training and spares are essential components of the market, ensuring the efficient operation of crawler camera systems. Financial incentives, such as tax credits and grants, are also driving market growth. The market is expected to continue expanding due to the increasing importance of asset management and the integration of cutting-edge technologies.
  • However, dimensional restraint and the challenges of inspecting clogged sewer lines in municipal sewer systems and residential household pipelines present obstacles to market growth. Despite these challenges, the market is expected to continue growing due to the increasing demand for reliable and efficient pipeline inspection solutions.

What challenges does the Crawler Camera System Industry face during its growth?

Camera design vulnerable to damage is a key challenge affecting the industry growth.

  • The pipeline assessment market relies heavily on sophisticated inspection tools such as crawler camera systems to ensure the optimal condition of subsea pipelines. These cutting-edge technologies enable real-time video streaming and remote control, enhancing operational efficiency and reducing unplanned downtime. However, the design of crawler camera systems poses challenges. The cameras are often bulky to protect against shock and water exposure, which can increase operational expenses and limit maneuverability. Furthermore, the need for training, spares, and customized constructions adds to the overall cost. Governmental regulations mandate regular pipeline inspections using advanced technologies like laser profiling, ultrasonic thickness gauges, and visual inspections.
  • These preventive measures ensure pipeline conditions remain compliant with safety standards, minimizing hazards and potential financial penalties. Innovative product launches In the pipeline inspection technology sector focus on addressing these challenges. Developments include smaller, more durable cameras, improved software selection for asset management, and real-time footage analysis for predictive maintenance. These advancements are crucial for long-term planning and effective asset management. Crawler camera systems are not only used for pipeline inspections but also in various industries, including municipal sewer systems, residential households, and hazardous spaces. The systems' ability to navigate through clogged sewer lines and inspect hard-to-reach areas makes them indispensable.
  • Despite their importance, the design constraints, such as dimensional restraint, can hinder their adoption. In conclusion, the pipeline assessment market is driven by the need for advanced inspection tools to maintain pipeline conditions and comply with regulations. The challenges associated with crawler camera systems, including their bulky design and operational expenses, are being addressed through innovative product launches and software solutions. The market's growth is essential for ensuring the safety and efficiency of various industries' infrastructure.

Exclusive Customer Landscape

The crawler camera system market forecasting report includes the adoption lifecycle of the market, covering from the innovator's stage to the laggard's stage. It focuses on adoption rates in different regions based on penetration. Furthermore, the crawler camera system market report also includes key purchase criteria and drivers of price sensitivity to help companies evaluate and develop their market growth analysis strategies.

Crawler Camera System Market Share by Geography

 Customer Landscape

Key Companies & Market Insights

Companies are implementing various strategies, such as strategic alliances, crawler camera system market forecast, partnerships, mergers and acquisitions, geographical expansion, and product/service launches, to enhance their presence In the industry.

AM Industrial Ltd. - The company specializes in providing crawler camera system solutions, including the AMI SP150, SP300 Mainline Crawler, and AMI SP75 models. These systems enable effective inspection and maintenance of infrastructure, particularly in challenging environments.

The industry research and growth report includes detailed analyses of the competitive landscape of the market and information about key companies, including:

  • AM Industrial Ltd.
  • Deep Trekker Inc.
  • Eddyfi Technologies
  • Envirosight LLC
  • Halma Plc
  • IDEX Corp.
  • Insight Vision
  • INSPECTOR SYSTEMS GmbH
  • Kummert GmbH
  • Medical Intubation Technology Corp.
  • Pro Engineers
  • Ratech Electronics Ltd.
  • Rausch GmbH
  • RIEZLER Inspektionssysteme GmbH and Co. KG
  • Scanprobe Techniques Ltd.
  • Shenzhen SROD Industrial Group Co. Ltd.
  • Spectis Robotics Ltd.
  • SPX Technologies Inc.
  • The Toro Co.
  • Toradex AG

Qualitative and quantitative analysis of companies has been conducted to help clients understand the wider business environment as well as the strengths and weaknesses of key industry players. Data is qualitatively analyzed to categorize companies as pure play, category-focused, industry-focused, and diversified; it is quantitatively analyzed to categorize companies as dominant, leading, strong, tentative, and weak.

Research Analyst Overview

The market encompasses sophisticated inspection tools designed for pipeline assessment in various industries. These systems play a crucial role in subsea activities, enabling visual inspections of pipeline conditions to ensure the integrity and longevity of infrastructure. The pipeline inspection technology market is driven by the need for long-term planning and asset management in sectors where operational expenses are significant. Cutting-edge sensors, such as laser profiling and ultrasonic thickness gauges, are integral components of crawler camera systems. These technologies enable real-time footage collection and analysis, providing valuable insights into pipeline conditions. The ability to stream video footage in real-time and remotely control these systems offers operational efficiencies and cost savings.

Robotic maneuverability is a key feature of crawler camera systems, enabling access to hazardous spaces and areas with dimensional restraint. This capability is essential in industries where unplanned downtime can lead to substantial financial losses. Governmental regulations and the need for preventive measures further fuel the demand for these systems. Asset management software integration is also becoming increasingly important, allowing for efficient data management and analysis. Innovative product launches continue to shape the market, with new technologies and features being introduced regularly. These advancements include customized constructions, improved training programs, and the availability of spares. Crawler camera systems are not limited to pipeline applications; they are also used in sewer lines to address issues such as clogging in municipal sewer systems and residential households.

The versatility of these systems makes them a valuable investment for organizations seeking to maintain and optimize their infrastructure. The adoption of crawler camera systems is influenced by several factors, including operational expenses, financial incentives, and the availability of skilled personnel. As the market continues to evolve, it is essential for organizations to stay informed about the latest trends and technologies to make informed decisions regarding their asset management strategies.

Market Scope

Report Coverage

Details

Page number

153

Base year

2023

Historic period

2018-2022

Forecast period

2024-2028

Growth momentum & CAGR

Accelerate at a CAGR of 21.04%

Market growth 2024-2028

USD 5.47 billion

Market structure

Fragmented

YoY growth 2023-2024(%)

17.11

Key countries

US, China, Russia, India, and UK

Competitive landscape

Leading Companies, Market Positioning of Companies, Competitive Strategies, and Industry Risks

Request Free Sample

What are the Key Data Covered in this Crawler Camera System Market Research and Growth Report?

  • CAGR of the Crawler Camera System industry during the forecast period
  • Detailed information on factors that will drive the growth and forecasting between 2024 and 2028
  • Precise estimation of the size of the market and its contribution of the industry in focus to the parent market
  • Accurate predictions about upcoming growth and trends and changes in consumer behaviour
  • Growth of the market across North America, APAC, Europe, Middle East and Africa, and South America
  • Thorough analysis of the market's competitive landscape and detailed information about companies
  • Comprehensive analysis of factors that will challenge the crawler camera system market growth of industry companies

We can help! Our analysts can customize this crawler camera system market research report to meet your requirements.

Get in touch

1 Executive Summary

  • 1.1 Market overview
    • Executive Summary - Chart on Market Overview
    • Executive Summary - Data Table on Market Overview
    • Executive Summary - Chart on Global Market Characteristics
    • Executive Summary - Chart on Market by Geography
    • Executive Summary - Chart on Market Segmentation by End-user
    • Executive Summary - Chart on Market Segmentation by Application
    • Executive Summary - Chart on Incremental Growth
    • Executive Summary - Data Table on Incremental Growth
    • Executive Summary - Chart on Company Market Positioning

2 Market Landscape

  • 2.1 Market ecosystem
    • Parent Market
    • Data Table on - Parent Market
  • 2.2 Market characteristics
    • Market characteristics analysis
  • 2.3 Value chain analysis
    • Value Chain Analysis

3 Market Sizing

  • 3.1 Market definition
    • Offerings of companies included in the market definition
  • 3.2 Market segment analysis
    • Market segments
  • 3.3 Market size 2023
    • 3.4 Market outlook: Forecast for 2023-2028
      • Chart on Global - Market size and forecast 2023-2028 ($ million)
      • Data Table on Global - Market size and forecast 2023-2028 ($ million)
      • Chart on Global Market: Year-over-year growth 2023-2028 (%)
      • Data Table on Global Market: Year-over-year growth 2023-2028 (%)

    4 Historic Market Size

    • 4.1 Global Crawler Camera System Market 2018 - 2022
      • Historic Market Size - Data Table on Global Crawler Camera System Market 2018 - 2022 ($ million)
    • 4.2 End-user segment analysis 2018 - 2022
      • Historic Market Size - End-user Segment 2018 - 2022 ($ million)
    • 4.3 Application segment analysis 2018 - 2022
      • Historic Market Size - Application Segment 2018 - 2022 ($ million)
    • 4.4 Geography segment analysis 2018 - 2022
      • Historic Market Size - Geography Segment 2018 - 2022 ($ million)
    • 4.5 Country segment analysis 2018 - 2022
      • Historic Market Size - Country Segment 2018 - 2022 ($ million)

    5 Five Forces Analysis

    • 5.1 Five forces summary
      • Five forces analysis - Comparison between 2023 and 2028
    • 5.2 Bargaining power of buyers
      • Bargaining power of buyers - Impact of key factors 2023 and 2028
    • 5.3 Bargaining power of suppliers
      • Bargaining power of suppliers - Impact of key factors in 2023 and 2028
    • 5.4 Threat of new entrants
      • Threat of new entrants - Impact of key factors in 2023 and 2028
    • 5.5 Threat of substitutes
      • Threat of substitutes - Impact of key factors in 2023 and 2028
    • 5.6 Threat of rivalry
      • Threat of rivalry - Impact of key factors in 2023 and 2028
    • 5.7 Market condition
      • Chart on Market condition - Five forces 2023 and 2028

    6 Market Segmentation by End-user

    • 6.1 Market segments
      • Chart on End-user - Market share 2023-2028 (%)
      • Data Table on End-user - Market share 2023-2028 (%)
    • 6.2 Comparison by End-user
      • Chart on Comparison by End-user
      • Data Table on Comparison by End-user
    • 6.3 Municipal and residential - Market size and forecast 2023-2028
      • Chart on Municipal and residential - Market size and forecast 2023-2028 ($ million)
      • Data Table on Municipal and residential - Market size and forecast 2023-2028 ($ million)
      • Chart on Municipal and residential - Year-over-year growth 2023-2028 (%)
      • Data Table on Municipal and residential - Year-over-year growth 2023-2028 (%)
    • 6.4 Industrial - Market size and forecast 2023-2028
      • Chart on Industrial - Market size and forecast 2023-2028 ($ million)
      • Data Table on Industrial - Market size and forecast 2023-2028 ($ million)
      • Chart on Industrial - Year-over-year growth 2023-2028 (%)
      • Data Table on Industrial - Year-over-year growth 2023-2028 (%)
    • 6.5 Market opportunity by End-user
      • Market opportunity by End-user ($ million)
      • Data Table on Market opportunity by End-user ($ million)

    7 Market Segmentation by Application

    • 7.1 Market segments
      • Chart on Application - Market share 2023-2028 (%)
      • Data Table on Application - Market share 2023-2028 (%)
    • 7.2 Comparison by Application
      • Chart on Comparison by Application
      • Data Table on Comparison by Application
    • 7.3 Pipeline inspection - Market size and forecast 2023-2028
      • Chart on Pipeline inspection - Market size and forecast 2023-2028 ($ million)
      • Data Table on Pipeline inspection - Market size and forecast 2023-2028 ($ million)
      • Chart on Pipeline inspection - Year-over-year growth 2023-2028 (%)
      • Data Table on Pipeline inspection - Year-over-year growth 2023-2028 (%)
    • 7.4 Drain inspection - Market size and forecast 2023-2028
      • Chart on Drain inspection - Market size and forecast 2023-2028 ($ million)
      • Data Table on Drain inspection - Market size and forecast 2023-2028 ($ million)
      • Chart on Drain inspection - Year-over-year growth 2023-2028 (%)
      • Data Table on Drain inspection - Year-over-year growth 2023-2028 (%)
    • 7.5 Tank and cavity inspection - Market size and forecast 2023-2028
      • Chart on Tank and cavity inspection - Market size and forecast 2023-2028 ($ million)
      • Data Table on Tank and cavity inspection - Market size and forecast 2023-2028 ($ million)
      • Chart on Tank and cavity inspection - Year-over-year growth 2023-2028 (%)
      • Data Table on Tank and cavity inspection - Year-over-year growth 2023-2028 (%)
    • 7.6 Market opportunity by Application
      • Market opportunity by Application ($ million)
      • Data Table on Market opportunity by Application ($ million)

    8 Customer Landscape

    • 8.1 Customer landscape overview
      • Analysis of price sensitivity, lifecycle, customer purchase basket, adoption rates, and purchase criteria

    9 Geographic Landscape

    • 9.1 Geographic segmentation
      • Chart on Market share by geography 2023-2028 (%)
      • Data Table on Market share by geography 2023-2028 (%)
    • 9.2 Geographic comparison
      • Chart on Geographic comparison
      • Data Table on Geographic comparison
    • 9.3 North America - Market size and forecast 2023-2028
      • Chart on North America - Market size and forecast 2023-2028 ($ million)
      • Data Table on North America - Market size and forecast 2023-2028 ($ million)
      • Chart on North America - Year-over-year growth 2023-2028 (%)
      • Data Table on North America - Year-over-year growth 2023-2028 (%)
    • 9.4 APAC - Market size and forecast 2023-2028
      • Chart on APAC - Market size and forecast 2023-2028 ($ million)
      • Data Table on APAC - Market size and forecast 2023-2028 ($ million)
      • Chart on APAC - Year-over-year growth 2023-2028 (%)
      • Data Table on APAC - Year-over-year growth 2023-2028 (%)
    • 9.5 Europe - Market size and forecast 2023-2028
      • Chart on Europe - Market size and forecast 2023-2028 ($ million)
      • Data Table on Europe - Market size and forecast 2023-2028 ($ million)
      • Chart on Europe - Year-over-year growth 2023-2028 (%)
      • Data Table on Europe - Year-over-year growth 2023-2028 (%)
    • 9.6 Middle East and Africa - Market size and forecast 2023-2028
      • Chart on Middle East and Africa - Market size and forecast 2023-2028 ($ million)
      • Data Table on Middle East and Africa - Market size and forecast 2023-2028 ($ million)
      • Chart on Middle East and Africa - Year-over-year growth 2023-2028 (%)
      • Data Table on Middle East and Africa - Year-over-year growth 2023-2028 (%)
    • 9.7 South America - Market size and forecast 2023-2028
      • Chart on South America - Market size and forecast 2023-2028 ($ million)
      • Data Table on South America - Market size and forecast 2023-2028 ($ million)
      • Chart on South America - Year-over-year growth 2023-2028 (%)
      • Data Table on South America - Year-over-year growth 2023-2028 (%)
    • 9.8 US - Market size and forecast 2023-2028
      • Chart on US - Market size and forecast 2023-2028 ($ million)
      • Data Table on US - Market size and forecast 2023-2028 ($ million)
      • Chart on US - Year-over-year growth 2023-2028 (%)
      • Data Table on US - Year-over-year growth 2023-2028 (%)
    • 9.9 China - Market size and forecast 2023-2028
      • Chart on China - Market size and forecast 2023-2028 ($ million)
      • Data Table on China - Market size and forecast 2023-2028 ($ million)
      • Chart on China - Year-over-year growth 2023-2028 (%)
      • Data Table on China - Year-over-year growth 2023-2028 (%)
    • 9.10 Russia - Market size and forecast 2023-2028
      • Chart on Russia - Market size and forecast 2023-2028 ($ million)
      • Data Table on Russia - Market size and forecast 2023-2028 ($ million)
      • Chart on Russia - Year-over-year growth 2023-2028 (%)
      • Data Table on Russia - Year-over-year growth 2023-2028 (%)
    • 9.11 India - Market size and forecast 2023-2028
      • Chart on India - Market size and forecast 2023-2028 ($ million)
      • Data Table on India - Market size and forecast 2023-2028 ($ million)
      • Chart on India - Year-over-year growth 2023-2028 (%)
      • Data Table on India - Year-over-year growth 2023-2028 (%)
    • 9.12 UK - Market size and forecast 2023-2028
      • Chart on UK - Market size and forecast 2023-2028 ($ million)
      • Data Table on UK - Market size and forecast 2023-2028 ($ million)
      • Chart on UK - Year-over-year growth 2023-2028 (%)
      • Data Table on UK - Year-over-year growth 2023-2028 (%)
    • 9.13 Market opportunity by geography
      • Market opportunity by geography ($ million)
      • Data Tables on Market opportunity by geography ($ million)

    10 Drivers, Challenges, and Opportunity/Restraints

    • 10.1 Market drivers
      • 10.2 Market challenges
        • 10.3 Impact of drivers and challenges
          • Impact of drivers and challenges in 2023 and 2028
        • 10.4 Market opportunities/restraints

          11 Competitive Landscape

          • 11.1 Overview
            • 11.2 Competitive Landscape
              • Overview on criticality of inputs and factors of differentiation
            • 11.3 Landscape disruption
              • Overview on factors of disruption
            • 11.4 Industry risks
              • Impact of key risks on business

            12 Competitive Analysis

            • 12.1 Companies profiled
              • Companies covered
            • 12.2 Market positioning of companies
              • Matrix on companies position and classification
            • 12.3 AM Industrial Ltd.
              • AM Industrial Ltd. - Overview
              • AM Industrial Ltd. - Product / Service
              • AM Industrial Ltd. - Key offerings
            • 12.4 Deep Trekker Inc.
              • Deep Trekker Inc. - Overview
              • Deep Trekker Inc. - Product / Service
              • Deep Trekker Inc. - Key offerings
            • 12.5 Eddyfi Technologies
              • Eddyfi Technologies - Overview
              • Eddyfi Technologies - Product / Service
              • Eddyfi Technologies - Key offerings
            • 12.6 Envirosight LLC
              • Envirosight LLC - Overview
              • Envirosight LLC - Product / Service
              • Envirosight LLC - Key offerings
            • 12.7 Halma Plc
              • Halma Plc - Overview
              • Halma Plc - Business segments
              • Halma Plc - Key news
              • Halma Plc - Key offerings
              • Halma Plc - Segment focus
            • 12.8 IDEX Corp.
              • IDEX Corp. - Overview
              • IDEX Corp. - Business segments
              • IDEX Corp. - Key news
              • IDEX Corp. - Key offerings
              • IDEX Corp. - Segment focus
            • 12.9 Insight Vision
              • Insight Vision - Overview
              • Insight Vision - Product / Service
              • Insight Vision - Key offerings
            • 12.10 INSPECTOR SYSTEMS GmbH
              • INSPECTOR SYSTEMS GmbH - Overview
              • INSPECTOR SYSTEMS GmbH - Product / Service
              • INSPECTOR SYSTEMS GmbH - Key offerings
            • 12.11 Kummert GmbH
              • Kummert GmbH - Overview
              • Kummert GmbH - Product / Service
              • Kummert GmbH - Key offerings
            • 12.12 Ratech Electronics Ltd.
              • Ratech Electronics Ltd. - Overview
              • Ratech Electronics Ltd. - Product / Service
              • Ratech Electronics Ltd. - Key offerings
            • 12.13 Rausch GmbH
              • Rausch GmbH - Overview
              • Rausch GmbH - Product / Service
              • Rausch GmbH - Key offerings
            • 12.14 RIEZLER Inspektionssysteme GmbH and Co. KG
              • RIEZLER Inspektionssysteme GmbH and Co. KG - Overview
              • RIEZLER Inspektionssysteme GmbH and Co. KG - Product / Service
              • RIEZLER Inspektionssysteme GmbH and Co. KG - Key offerings
            • 12.15 Scanprobe Techniques Ltd.
              • Scanprobe Techniques Ltd. - Overview
              • Scanprobe Techniques Ltd. - Product / Service
              • Scanprobe Techniques Ltd. - Key offerings
            • 12.16 SPX Technologies Inc.
              • SPX Technologies Inc. - Overview
              • SPX Technologies Inc. - Business segments
              • SPX Technologies Inc. - Key news
              • SPX Technologies Inc. - Key offerings
              • SPX Technologies Inc. - Segment focus
            • 12.17 The Toro Co.
              • The Toro Co. - Overview
              • The Toro Co. - Business segments
              • The Toro Co. - Key news
              • The Toro Co. - Key offerings
              • The Toro Co. - Segment focus

            13 Appendix

            • 13.1 Scope of the report
              • 13.2 Inclusions and exclusions checklist
                • Inclusions checklist
                • Exclusions checklist
              • 13.3 Currency conversion rates for US$
                • Currency conversion rates for US$
              • 13.4 Research methodology
                • Research methodology
              • 13.5 Data procurement
                • Information sources
              • 13.6 Data validation
                • Data validation
              • 13.7 Validation techniques employed for market sizing
                • Validation techniques employed for market sizing
              • 13.8 Data synthesis
                • Data synthesis
              • 13.9 360 degree market analysis
                • 360 degree market analysis
              • 13.10 List of abbreviations
                • List of abbreviations

              Research Methodology

              Technavio presents a detailed picture of the market by way of study, synthesis, and summation of data from multiple sources. The analysts have presented the various facets of the market with a particular focus on identifying the key industry influencers. The data thus presented is comprehensive, reliable, and the result of extensive research, both primary and secondary.

              INFORMATION SOURCES

              Primary sources

              • Manufacturers and suppliers
              • Channel partners
              • Industry experts
              • Strategic decision makers

              Secondary sources

              • Industry journals and periodicals
              • Government data
              • Financial reports of key industry players
              • Historical data
              • Press releases

              DATA ANALYSIS

              Data Synthesis

              • Collation of data
              • Estimation of key figures
              • Analysis of derived insights

              Data Validation

              • Triangulation with data models
              • Reference against proprietary databases
              • Corroboration with industry experts

              REPORT WRITING

              Qualitative

              • Market drivers
              • Market challenges
              • Market trends
              • Five forces analysis

              Quantitative

              • Market size and forecast
              • Market segmentation
              • Geographical insights
              • Competitive landscape

              Interested in this report?

              Get your sample now to see our research methodology and insights!

              Download Now

              Frequently Asked Questions

              Crawler Camera System market growth will increase by $ 5473.5 mn during 2024-2028.

              The Crawler Camera System market is expected to grow at a CAGR of 21.04% during 2024-2028.

              Crawler Camera System market is segmented by End-user( Municipal and residential, Industrial, Industrial) Application( Pipeline inspection, Drain inspection, Tank and cavity inspection)

              AM Industrial Ltd., Deep Trekker Inc., Eddyfi Technologies, Envirosight LLC, Halma Plc, IDEX Corp., Insight Vision, INSPECTOR SYSTEMS GmbH, Kummert GmbH, Medical Intubation Technology Corp., Pro Engineers, Ratech Electronics Ltd., Rausch GmbH, RIEZLER Inspektionssysteme GmbH and Co. KG, Scanprobe Techniques Ltd., Shenzhen SROD Industrial Group Co. Ltd., Spectis Robotics Ltd., SPX Technologies Inc., The Toro Co., Toradex AG are a few of the key vendors in the Crawler Camera System market.

              APAC will register the highest growth rate of 31% among the other regions. Therefore, the Crawler Camera System market in APAC is expected to garner significant business opportunities for the vendors during the forecast period.

              US, China, Russia, India, UK

              • Increasing urbanizationThere has been an increase in urbanization worldwide owing to the growth in the global population is the driving factor this market.
              • improved standards of living is the driving factor this market.
              • and availability of better facilities and infrastructure in urban areas compared with rural areas. According to the World Bank is the driving factor this market.
              • the share of the urban population increased from 52% in 2012 to 57% in 2022. More than two-thirds of the global population is expected to reside in urban areas by 2050. This growth in urban population is driven by emerging economies such as China is the driving factor this market.
              • India is the driving factor this market.
              • and Nigeria due to their rapid economic development. The need for basic facilities such as residential infrastructure increases with the growth in the urban population. Hence is the driving factor this market.
              • the increase in urbanization results in an increase in the amount of municipal solid waste (MSW) generated. For instance is the driving factor this market.
              • the rising global urban population is expected to produce three times more solid waste in 2100 compared with 2013. The global annual solid waste generation is expected to increase by more than two-thirds in 2050 compared with 2016. With the increase in MSW is the driving factor this market.
              • the demand for robot pipeline inspection is expected to grow. This is likely to drive the demand for a crawler camera system for inspection is the driving factor this market.
              • which in turn is expected to drive the growth of the market in focus during the forecast period. is the driving factor this market.

              The Crawler Camera System market vendors should focus on grabbing business opportunities from the Municipal and residential segment as it accounted for the largest market share in the base year.