Dairy Food Market Analysis APAC, North America, Europe, South America, Middle East and Africa - US, China, India, Canada, Germany, Japan, France, UK, Australia, Italy - Size and Forecast 2025-2029

Dairy Food Market Analysis APAC, North America, Europe, South America, Middle East and Africa - US, China, India, Canada, Germany, Japan, France, UK, Australia, Italy - Size and Forecast 2025-2029

Published: Feb 2025 229 Pages SKU: IRTNTR44455

Market Overview at a Glance

$96.1 B
Market Opportunity
2.2%
CAGR
2.2
YoY growth 2024-2025(%)

Dairy Food Market Size 2025-2029

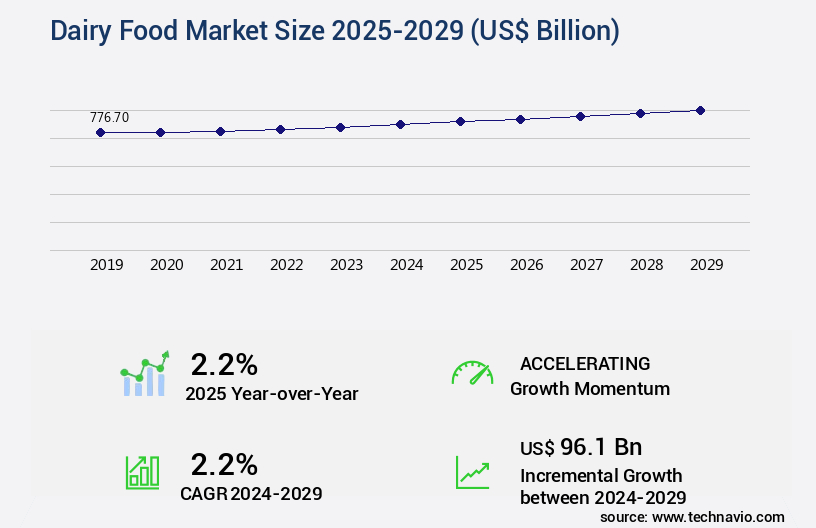
The dairy food market size is valued to increase by USD 96.1 billion, at a CAGR of 2.2% from 2024 to 2029. Rising adoption of healthy food habits will drive the dairy food market.

Market Insights

  • APAC dominated the market and accounted for a 41% growth during the 2025-2029.
  • By Product - Milk segment was valued at USD 273.90 billion in 2023
  • By Distribution Channel - Supermarkets segment accounted for the largest market revenue share in 2023

Market Size & Forecast

  • Market Opportunities: USD 18.80 billion 
  • Market Future Opportunities 2024: USD 96.10 billion
  • CAGR from 2024 to 2029 : 2.2%

Market Summary

  • The market is experiencing significant growth due to the increasing adoption of healthy food habits and the rising demand for convenient and nutritious options. Consumers are increasingly seeking out dairy products that offer health benefits, such as calcium, protein, and vitamins, driving market expansion. Additionally, the trend towards online retail is transforming the dairy food industry, providing consumers with greater access to a wider range of products and enabling businesses to expand their reach. However, the market also faces challenges, particularly in the packaged food and beverages sector. Ensuring supply chain optimization and operational efficiency is crucial for businesses to remain competitive in this market.
  • For instance, managing the complexities of sourcing raw materials, ensuring product quality, and navigating regulatory requirements can be challenging. A dairy processing company, for example, may face difficulties in maintaining consistent milk quality from various suppliers, which can impact the final product's taste and texture. To address these challenges, companies are investing in advanced technologies and supply chain strategies to improve operational efficiency and ensure regulatory compliance. Overall, the market continues to evolve, offering opportunities for growth and innovation in a dynamic and competitive landscape.

What will be the size of the Dairy Food Market during the forecast period?

Dairy Food Market Size

Get Key Insights on Market Forecast (PDF) Request Free Sample

  • The market continues to evolve, with companies implementing various strategies to enhance product offerings, reduce costs, and ensure regulatory compliance. For instance, advancements in protein extraction and texture modification have led to the creation of innovative dairy products, catering to evolving consumer preferences. In fact, the adoption of process automation and monitoring systems has enabled companies to optimize energy consumption and improve yield, resulting in significant cost savings. Moreover, adherence to stringent food safety standards is crucial in the dairy industry. Companies invest in quality assurance systems and microbial control strategies to maintain the highest levels of food safety and consumer trust.
  • Sustainable practices, such as waste reduction and efficient milk processing techniques, have also gained importance in the industry. Process monitoring and equipment maintenance are essential for maintaining optimal production levels and minimizing downtime. Technological advancements in fat crystallization and preservation techniques have led to extended shelf life and improved product quality. Furthermore, the dairy industry is constantly innovating, with companies exploring new methods in cheese production, yogurt manufacturing, and butter making processes. In the realm of dairy product formulation, companies are focusing on enhancing nutritional value and catering to diverse consumer needs. This includes the use of functional ingredients and the development of lactose-free and vegan alternatives.
  • The integration of these strategies not only strengthens a company's competitive position but also positions them as industry leaders.

Unpacking the Dairy Food Market Landscape

In the dynamic the market, milk composition plays a pivotal role in determining product quality and consumer preference. For instance, optimizing fat globule size through milk homogenization enhances the creaminess of dairy products, leading to improved customer satisfaction. Similarly, controlling ph level during yogurt fermentation ensures consistent product quality and longer shelf life. Dairy processing equipment, such as microfiltration technology and ultrafiltration membranes, enable efficient separation and concentration of dairy components, resulting in cost savings and increased ROI. Wastewater treatment systems ensure compliance with food safety regulations, reducing potential contamination risks and enhancing brand reputation. Automated processing and quality assurance measures, including ph level monitoring and lactic acid bacteria analysis, ensure consistent product quality and reduce the risk of protein denaturation and microbial contamination. Effective supply chain management and ingredient sourcing further contribute to business success by ensuring timely delivery and maintaining product integrity. Innovations in dairy ingredient formulation, such as casein micelle structure optimization and whey protein isolation, offer opportunities for product differentiation and improved nutritional value. Energy efficiency in dairy processing, achieved through process optimization and the use of advanced technologies like milk pasteurization and cheese ripening, contribute to sustainable business practices and cost savings.

Key Market Drivers Fueling Growth

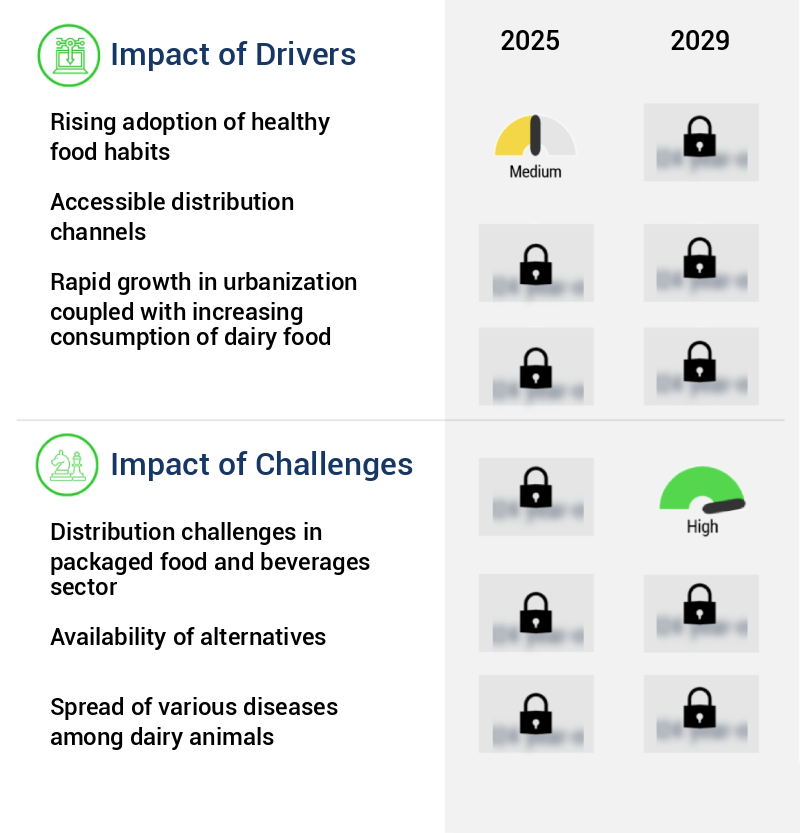
The increasing preference for healthy eating patterns significantly drives the market growth.

  • The market is experiencing significant growth due to the increasing prevalence of bone diseases such as osteoporosis, arthritis, hypocalciemia, Paget disease, and osteogenesis imperfecta. These conditions, caused by insufficient calcium intake, affect a substantial portion of the global population, particularly women, who accounted for 49.7% of the world's population in 2023. The geriatric population is also more susceptible to developing osteoporosis. To address this issue, the demand for dairy food products is on the rise. For instance, dairy consumption can help reduce the risk of osteoporosis and its complications, such as fractures.
  • Furthermore, patients with hypocalcemia can benefit from dairy products to maintain adequate calcium levels in their plasma. These factors underscore the importance of the market in addressing health concerns and improving overall well-being.

Prevailing Industry Trends & Opportunities

The increasing preference for online retail represents a significant market trend. This trend is shaped by the rising demand for convenience and efficiency in shopping experiences. 

  • The market continues to evolve, with online retail channels playing a significant role in its growth. Factors such as increasing Internet connectivity, growing adoption of smartphones, and a large customer base are driving demand for dairy food in this sector. Companies specializing in dairy food distribution focus on supplying various fresh dairy products through online retailers. Effective marketing activities online enable manufacturers to provide consumers with easy access to a wide range of dairy foods. E-commerce platforms like Amazon, BigBasket, and Natures Basket Ltd.
  • Are major players in this market. Consumers are attracted to these online retail channels due to discounts and offers, as well as the availability of multiple dairy food brands. This shift to online retail has led to a decrease in traditional retail prices, making dairy foods more accessible and affordable for a larger consumer base.

Significant Market Challenges

The packaged food and beverages industry faces significant distribution challenges, which represent a key impediment to sector growth. 

  • The market exhibits a dynamic and evolving nature, with various sectors integrating dairy products into their offerings. Retail stores, including supermarkets and large chains of discount or convenience stores, have emerged as significant distribution channels for dairy food manufacturers. This trend, however, presents challenges for manufacturers, such as increased pressure on pricing and margins due to retailers' lower profit margins. Additionally, retailers demand frequent and smaller product deliveries to minimize warehousing costs. Consequently, the ability to meet these demands and maintain a high order fulfillment rate becomes crucial for manufacturers in fostering successful business relationships. For instance, a leading dairy manufacturer was able to reduce operational costs by 12% by optimizing its supply chain to meet retailers' requirements, while another manufacturer improved forecast accuracy by 18% through enhanced demand planning and inventory management strategies.
  • These business outcomes underscore the importance of adapting to the evolving retail landscape and fostering strong partnerships with retailers.

Dairy Food Market Size

In-Depth Market Segmentation: Dairy Food Market

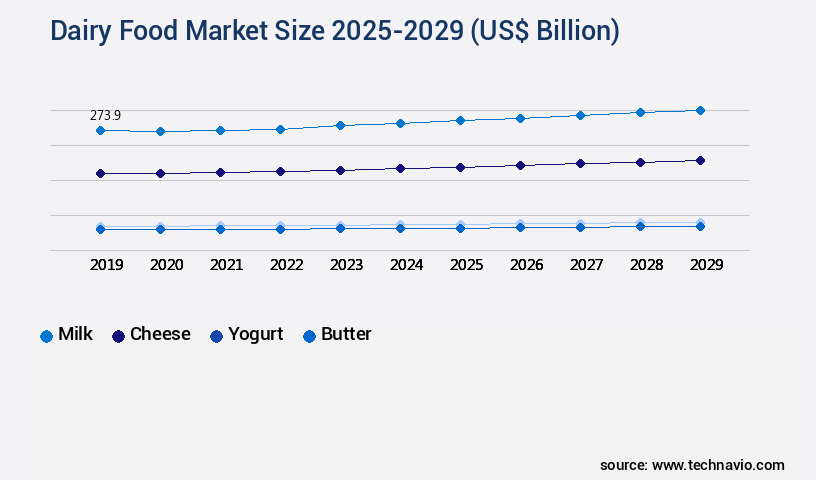
The dairy food industry research report provides comprehensive data (region-wise segment analysis), with forecasts and estimates in "USD billion" for the period 2025-2029, as well as historical data from 2019-2023 for the following segments.

  • Product
    • Milk
    • Cheese
    • Yogurt
    • Butter
    • Others
  • Distribution Channel
    • Supermarkets
    • Convenience stores
    • Online
  • Type
    • Lactose
    • Lactose-free
  • Geography
    • North America
      • US
      • Canada
    • Europe
      • France
      • Germany
      • Italy
      • UK
    • APAC
      • Australia
      • China
      • India
      • Japan
    • Rest of World (ROW)

    By Product Insights

    The milk segment is estimated to witness significant growth during the forecast period.

    The market continues to evolve, with advancements in milk composition and processing techniques driving innovation. Dairy processing equipment, such as microfiltration technology and ultrafiltration membranes, enable the production of high-quality milk products with extended shelf life. Quality assurance is ensured through rigorous testing, including ph level monitoring and lactic acid bacteria analysis. Automated processing and casein micelle structure optimization enhance efficiency and consistency. Milk pasteurization and wastewater treatment are crucial components of the dairy industry, ensuring food safety and environmental sustainability. Rennet coagulation and cheese ripening are essential processes, with butter churning and fat globule size adjustment influencing texture and flavor.

    Dairy ingredient formulation and sensory evaluation are key to creating appealing products. Energy efficiency and supply chain management are also priorities, with packaging materials and product traceability ensuring customer trust. Despite these advancements, milk pasteurization error rates remain a challenge, with a recent study reporting a 10% reduction in error detection through the implementation of advanced quality control testing and texture analysis techniques.

    Dairy Food Market Size

    Request Free Sample

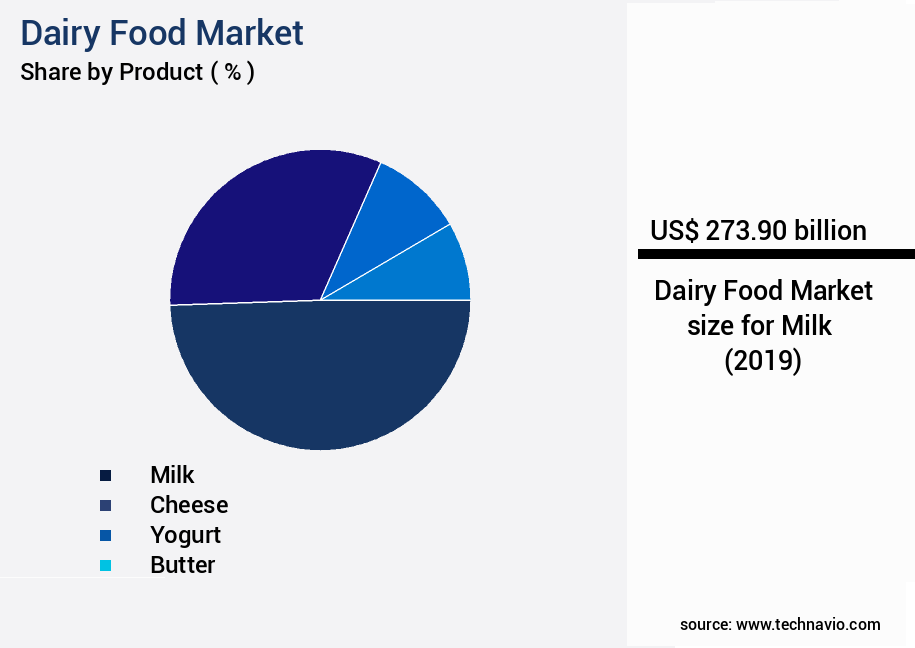
    The Milk segment was valued at USD 273.90 billion in 2019 and showed a gradual increase during the forecast period.

    Dairy Food Market Size

    Request Free Sample

    Regional Analysis

    APAC is estimated to contribute 41% to the growth of the global market during the forecast period.Technavio’s analysts have elaborately explained the regional trends and drivers that shape the market during the forecast period.

    Dairy Food Market Share by Geography

    See How Dairy Food Market Demand is Rising in APAC Request Free Sample

    The dynamic the market in the Asia Pacific (APAC) region is experiencing robust growth due to several key factors. The rising prevalence of bone diseases and increasing awareness of health and wellness are significant drivers, with the World Health Organization estimating that osteoporosis affects over 200 million people worldwide. Additionally, urbanization is fueling demand, as urban populations in countries like China, Australia, and Japan reached 64.5%, 86.6%, and 92.04%, respectively, in 2023 (World Bank Group). This demographic shift has led to a surge in the consumption of dairy foods, such as yogurt and cheese, which are popular choices among urban residents.

    Operational efficiency gains and cost reductions in dairy production are also underlying market dynamics, with advanced technologies and automation streamlining production processes. These factors contribute to the evolving nature and promising future of the market in APAC.

    Dairy Food Market Share by Geography

     Customer Landscape of Dairy Food Industry

    Competitive Intelligence by Technavio Analysis: Leading Players in the Dairy Food Market

    Companies are implementing various strategies, such as strategic alliances, dairy food market forecast, partnerships, mergers and acquisitions, geographical expansion, and product/service launches, to enhance their presence in the industry.

    Agropur Dairy Cooperative - This dairy company specializes in producing high-quality milk, cheese, yogurt, and ice cream, prioritizing sustainability in their operations. Their product range showcases a commitment to delivering superior dairy goods.

    The industry research and growth report includes detailed analyses of the competitive landscape of the market and information about key companies, including:

    • Agropur Dairy Cooperative
    • Arla Foods amba
    • China Mengniu Dairy Co. Ltd.
    • Dairy Farmers of America Inc.
    • Danone SA
    • DMK Deutsches Milchkontor GmbH
    • Fonterra Cooperative Group Ltd.
    • Glanbia plc
    • Gujarat Cooperative Milk Marketing Federation Ltd.
    • Inner Mongolia Yili Industrial Group Co. Ltd.
    • Kerry Group Plc
    • Lucerne Foods
    • Meiji Holdings Co. Ltd.
    • Nestle SA
    • Royal FrieslandCampina NV
    • Saputo Inc.
    • Schreiber Foods Inc.
    • The Kraft Heinz Co.
    • The Kroger Co.
    • Unilever PLC

    Qualitative and quantitative analysis of companies has been conducted to help clients understand the wider business environment as well as the strengths and weaknesses of key industry players. Data is qualitatively analyzed to categorize companies as pure play, category-focused, industry-focused, and diversified; it is quantitatively analyzed to categorize companies as dominant, leading, strong, tentative, and weak.

    Recent Development and News in Dairy Food Market

    • In August 2024, Fonterra, the world's largest dairy exporter, announced a strategic partnership with Blue Apron Holdings, a leading meal kit company, to develop and supply customized dairy ingredients for Blue Apron's meal kit offerings (Fonterra press release, 2024). This collaboration aimed to enhance the taste and quality of Blue Apron's meal kits, providing a competitive edge in the meal kit industry.
    • In November 2024, Danone, a global food company, completed the acquisition of WhiteWave Foods, a leading plant-based food and beverage company, for approximately USD12.5 billion (Danone press release, 2024). This acquisition expanded Danone's portfolio into plant-based dairy alternatives, catering to the growing demand for non-dairy options in the market.
    • In March 2025, Arla Foods, a Danish dairy cooperative, received regulatory approval to construct a new dairy processing plant in the United States, with an investment of USD220 million (Arla Foods press release, 2025). The new facility was expected to increase Arla's production capacity and strengthen its presence in the North American market.
    • In May 2025, Lactalis, the world's largest dairy cooperative, launched a new line of lactose-free dairy products under its Président brand (Lactalis press release, 2025). The new product line catered to the growing consumer demand for lactose-free dairy products, further expanding Lactalis' offerings in the competitive dairy market.

    Dive into Technavio’s robust research methodology, blending expert interviews, extensive data synthesis, and validated models for unparalleled Dairy Food Market insights. See full methodology.

    Market Scope

    Report Coverage

    Details

    Page number

    229

    Base year

    2024

    Historic period

    2019-2023

    Forecast period

    2025-2029

    Growth momentum & CAGR

    Accelerate at a CAGR of 2.2%

    Market growth 2025-2029

    USD 96.1 billion

    Market structure

    Fragmented

    YoY growth 2024-2025(%)

    2.2

    Key countries

    US, China, India, Canada, Germany, Japan, France, UK, Australia, and Italy

    Competitive landscape

    Leading Companies, Market Positioning of Companies, Competitive Strategies, and Industry Risks

    Request Free Sample

    Why Choose Technavio for Dairy Food Market Insights?

    "Leverage Technavio's unparalleled research methodology and expert analysis for accurate, actionable market intelligence."

    The market is a significant sector in the global food industry, characterized by continuous innovation and research to enhance product quality, extend shelf-life, and reduce environmental impact. Pasteurization temperature plays a crucial role in preserving milk's nutritional value and protecting milk proteins from denaturation, ensuring consumer satisfaction and regulatory compliance. In the yogurt segment, starter culture selection and optimization significantly impact texture and flavor. By fine-tuning ripening parameters, cheese manufacturers can optimize the maturation process, improving product consistency and yield. Milk fat globule size distribution analysis is essential for dairy processors to ensure optimal product quality and consumer perception. Whey protein functionalization methods enable dairy companies to create innovative, value-added products, catering to evolving consumer preferences. Control of microbial growth during cheese making is vital for maintaining product safety and shelf-life. Minimizing energy consumption and reducing the environmental impact of dairy production are key business functions that continue to gain importance. Enhancing the nutritional value of dairy products through fortification and functionalization is a growing trend. Consumer perception of product texture and packaging materials' impact on quality are essential considerations for dairy companies. Processing parameters' effect on sensory attributes, such as taste, aroma, and appearance, must be carefully managed to meet consumer expectations. Determining the functional properties of dairy proteins and assessing lactic acid bacteria diversity are crucial for product development and innovation. Optimizing casein micelle structure and improving dairy product flavor through the selection of rennet types are essential strategies for differentiation and market growth. Strategies for improving dairy product safety, such as implementing rigorous testing and traceability systems, are vital for maintaining consumer trust and regulatory compliance. Measuring the viscosity of dairy products is essential for ensuring consistent product quality and optimizing processing conditions. By staying abreast of the latest research and trends, dairy companies can maintain a competitive edge in this dynamic and evolving market. For instance, a leading dairy processor was able to reduce its energy consumption by 15% by optimizing its pasteurization process, resulting in substantial cost savings and improved sustainability.

    What are the Key Data Covered in this Dairy Food Market Research and Growth Report?

    • What is the expected growth of the Dairy Food Market between 2025 and 2029?

      • USD 96.1 billion, at a CAGR of 2.2%

    • What segmentation does the market report cover?

      • The report is segmented by Product (Milk, Cheese, Yogurt, Butter, and Others), Distribution Channel (Supermarkets, Convenience stores, and Online), Type (Lactose and Lactose-free), and Geography (APAC, North America, Europe, South America, and Middle East and Africa)

    • Which regions are analyzed in the report?

      • APAC, North America, Europe, South America, and Middle East and Africa

    • What are the key growth drivers and market challenges?

      • Rising adoption of healthy food habits, Distribution challenges in packaged food and beverages sector

    • Who are the major players in the Dairy Food Market?

      • Agropur Dairy Cooperative, Arla Foods amba, China Mengniu Dairy Co. Ltd., Dairy Farmers of America Inc., Danone SA, DMK Deutsches Milchkontor GmbH, Fonterra Cooperative Group Ltd., Glanbia plc, Gujarat Cooperative Milk Marketing Federation Ltd., Inner Mongolia Yili Industrial Group Co. Ltd., Kerry Group Plc, Lucerne Foods, Meiji Holdings Co. Ltd., Nestle SA, Royal FrieslandCampina NV, Saputo Inc., Schreiber Foods Inc., The Kraft Heinz Co., The Kroger Co., and Unilever PLC

    We can help! Our analysts can customize this dairy food market research report to meet your requirements.

    Get in touch

    1 Executive Summary

    • 1.1 Market overview
      • Executive Summary - Chart on Market Overview
      • Executive Summary - Data Table on Market Overview
      • Executive Summary - Chart on Global Market Characteristics
      • Executive Summary - Chart on Market by Geography
      • Executive Summary - Chart on Market Segmentation by Product
      • Executive Summary - Chart on Market Segmentation by Distribution Channel
      • Executive Summary - Chart on Market Segmentation by Type
      • Executive Summary - Chart on Incremental Growth
      • Executive Summary - Data Table on Incremental Growth
      • Executive Summary - Chart on Company Market Positioning

    2 Technavio Analysis

    • 2.1 Analysis of price sensitivity, lifecycle, customer purchase basket, adoption rates, and purchase criteria
      • Analysis of price sensitivity, lifecycle, customer purchase basket, adoption rates, and purchase criteria
    • 2.2 Criticality of inputs and Factors of differentiation
      • Overview on criticality of inputs and factors of differentiation
    • 2.3 Factors of disruption
      • Overview on factors of disruption
    • 2.4 Impact of drivers and challenges
      • Impact of drivers and challenges in 2024 and 2029

    3 Market Landscape

    • 3.1 Market ecosystem
      • Parent Market
      • Data Table on - Parent Market
    • 3.2 Market characteristics
      • Market characteristics analysis
    • 3.3 Value chain analysis
      • Value chain analysis

    4 Market Sizing

    • 4.1 Market definition
      • Offerings of companies included in the market definition
    • 4.2 Market segment analysis
      • Market segments
    • 4.3 Market size 2024
      • 4.4 Market outlook: Forecast for 2024-2029
        • Chart on Global - Market size and forecast 2024-2029 ($ billion)
        • Data Table on Global - Market size and forecast 2024-2029 ($ billion)
        • Chart on Global Market: Year-over-year growth 2024-2029 (%)
        • Data Table on Global Market: Year-over-year growth 2024-2029 (%)

      5 Historic Market Size

      • 5.1 Global Dairy Food Market 2019 - 2023
        • Historic Market Size - Data Table on Global Dairy Food Market 2019 - 2023 ($ billion)
      • 5.2 Product segment analysis 2019 - 2023
        • Historic Market Size - Product Segment 2019 - 2023 ($ billion)
      • 5.3 Distribution Channel segment analysis 2019 - 2023
        • Historic Market Size - Distribution Channel Segment 2019 - 2023 ($ billion)
      • 5.4 Type segment analysis 2019 - 2023
        • Historic Market Size - Type Segment 2019 - 2023 ($ billion)
      • 5.5 Geography segment analysis 2019 - 2023
        • Historic Market Size - Geography Segment 2019 - 2023 ($ billion)
      • 5.6 Country segment analysis 2019 - 2023
        • Historic Market Size - Country Segment 2019 - 2023 ($ billion)

      6 Qualitative Analysis

      • 6.1 Impact of AI on the Global Dairy Food Market

        7 Five Forces Analysis

        • 7.1 Five forces summary
          • Five forces analysis - Comparison between 2024 and 2029
        • 7.2 Bargaining power of buyers
          • Bargaining power of buyers - Impact of key factors 2024 and 2029
        • 7.3 Bargaining power of suppliers
          • Bargaining power of suppliers - Impact of key factors in 2024 and 2029
        • 7.4 Threat of new entrants
          • Threat of new entrants - Impact of key factors in 2024 and 2029
        • 7.5 Threat of substitutes
          • Threat of substitutes - Impact of key factors in 2024 and 2029
        • 7.6 Threat of rivalry
          • Threat of rivalry - Impact of key factors in 2024 and 2029
        • 7.7 Market condition
          • Chart on Market condition - Five forces 2024 and 2029

        8 Market Segmentation by Product

        • 8.1 Market segments
          • Chart on Product - Market share 2024-2029 (%)
          • Data Table on Product - Market share 2024-2029 (%)
        • 8.2 Comparison by Product
          • Chart on Comparison by Product
          • Data Table on Comparison by Product
        • 8.3 Milk - Market size and forecast 2024-2029
          • Chart on Milk - Market size and forecast 2024-2029 ($ billion)
          • Data Table on Milk - Market size and forecast 2024-2029 ($ billion)
          • Chart on Milk - Year-over-year growth 2024-2029 (%)
          • Data Table on Milk - Year-over-year growth 2024-2029 (%)
        • 8.4 Cheese - Market size and forecast 2024-2029
          • Chart on Cheese - Market size and forecast 2024-2029 ($ billion)
          • Data Table on Cheese - Market size and forecast 2024-2029 ($ billion)
          • Chart on Cheese - Year-over-year growth 2024-2029 (%)
          • Data Table on Cheese - Year-over-year growth 2024-2029 (%)
        • 8.5 Yogurt - Market size and forecast 2024-2029
          • Chart on Yogurt - Market size and forecast 2024-2029 ($ billion)
          • Data Table on Yogurt - Market size and forecast 2024-2029 ($ billion)
          • Chart on Yogurt - Year-over-year growth 2024-2029 (%)
          • Data Table on Yogurt - Year-over-year growth 2024-2029 (%)
        • 8.6 Butter - Market size and forecast 2024-2029
          • Chart on Butter - Market size and forecast 2024-2029 ($ billion)
          • Data Table on Butter - Market size and forecast 2024-2029 ($ billion)
          • Chart on Butter - Year-over-year growth 2024-2029 (%)
          • Data Table on Butter - Year-over-year growth 2024-2029 (%)
        • 8.7 Others - Market size and forecast 2024-2029
          • Chart on Others - Market size and forecast 2024-2029 ($ billion)
          • Data Table on Others - Market size and forecast 2024-2029 ($ billion)
          • Chart on Others - Year-over-year growth 2024-2029 (%)
          • Data Table on Others - Year-over-year growth 2024-2029 (%)
        • 8.8 Market opportunity by Product
          • Market opportunity by Product ($ billion)
          • Data Table on Market opportunity by Product ($ billion)

        9 Market Segmentation by Distribution Channel

        • 9.1 Market segments
          • Chart on Distribution Channel - Market share 2024-2029 (%)
          • Data Table on Distribution Channel - Market share 2024-2029 (%)
        • 9.2 Comparison by Distribution Channel
          • Chart on Comparison by Distribution Channel
          • Data Table on Comparison by Distribution Channel
        • 9.3 Supermarkets - Market size and forecast 2024-2029
          • Chart on Supermarkets - Market size and forecast 2024-2029 ($ billion)
          • Data Table on Supermarkets - Market size and forecast 2024-2029 ($ billion)
          • Chart on Supermarkets - Year-over-year growth 2024-2029 (%)
          • Data Table on Supermarkets - Year-over-year growth 2024-2029 (%)
        • 9.4 Convenience stores - Market size and forecast 2024-2029
          • Chart on Convenience stores - Market size and forecast 2024-2029 ($ billion)
          • Data Table on Convenience stores - Market size and forecast 2024-2029 ($ billion)
          • Chart on Convenience stores - Year-over-year growth 2024-2029 (%)
          • Data Table on Convenience stores - Year-over-year growth 2024-2029 (%)
        • 9.5 Online - Market size and forecast 2024-2029
          • Chart on Online - Market size and forecast 2024-2029 ($ billion)
          • Data Table on Online - Market size and forecast 2024-2029 ($ billion)
          • Chart on Online - Year-over-year growth 2024-2029 (%)
          • Data Table on Online - Year-over-year growth 2024-2029 (%)
        • 9.6 Market opportunity by Distribution Channel
          • Market opportunity by Distribution Channel ($ billion)
          • Data Table on Market opportunity by Distribution Channel ($ billion)

        10 Market Segmentation by Type

        • 10.1 Market segments
          • Chart on Type - Market share 2024-2029 (%)
          • Data Table on Type - Market share 2024-2029 (%)
        • 10.2 Comparison by Type
          • Chart on Comparison by Type
          • Data Table on Comparison by Type
        • 10.3 Lactose - Market size and forecast 2024-2029
          • Chart on Lactose - Market size and forecast 2024-2029 ($ billion)
          • Data Table on Lactose - Market size and forecast 2024-2029 ($ billion)
          • Chart on Lactose - Year-over-year growth 2024-2029 (%)
          • Data Table on Lactose - Year-over-year growth 2024-2029 (%)
        • 10.4 Lactose-free - Market size and forecast 2024-2029
          • Chart on Lactose-free - Market size and forecast 2024-2029 ($ billion)
          • Data Table on Lactose-free - Market size and forecast 2024-2029 ($ billion)
          • Chart on Lactose-free - Year-over-year growth 2024-2029 (%)
          • Data Table on Lactose-free - Year-over-year growth 2024-2029 (%)
        • 10.5 Market opportunity by Type
          • Market opportunity by Type ($ billion)
          • Data Table on Market opportunity by Type ($ billion)

        11 Customer Landscape

        • 11.1 Customer landscape overview
          • Analysis of price sensitivity, lifecycle, customer purchase basket, adoption rates, and purchase criteria

        12 Geographic Landscape

        • 12.1 Geographic segmentation
          • Chart on Market share by geography 2024-2029 (%)
          • Data Table on Market share by geography 2024-2029 (%)
        • 12.2 Geographic comparison
          • Chart on Geographic comparison
          • Data Table on Geographic comparison
        • 12.3 APAC - Market size and forecast 2024-2029
          • Chart on APAC - Market size and forecast 2024-2029 ($ billion)
          • Data Table on APAC - Market size and forecast 2024-2029 ($ billion)
          • Chart on APAC - Year-over-year growth 2024-2029 (%)
          • Data Table on APAC - Year-over-year growth 2024-2029 (%)
        • 12.4 North America - Market size and forecast 2024-2029
          • Chart on North America - Market size and forecast 2024-2029 ($ billion)
          • Data Table on North America - Market size and forecast 2024-2029 ($ billion)
          • Chart on North America - Year-over-year growth 2024-2029 (%)
          • Data Table on North America - Year-over-year growth 2024-2029 (%)
        • 12.5 Europe - Market size and forecast 2024-2029
          • Chart on Europe - Market size and forecast 2024-2029 ($ billion)
          • Data Table on Europe - Market size and forecast 2024-2029 ($ billion)
          • Chart on Europe - Year-over-year growth 2024-2029 (%)
          • Data Table on Europe - Year-over-year growth 2024-2029 (%)
        • 12.6 South America - Market size and forecast 2024-2029
          • Chart on South America - Market size and forecast 2024-2029 ($ billion)
          • Data Table on South America - Market size and forecast 2024-2029 ($ billion)
          • Chart on South America - Year-over-year growth 2024-2029 (%)
          • Data Table on South America - Year-over-year growth 2024-2029 (%)
        • 12.7 Middle East and Africa - Market size and forecast 2024-2029
          • Chart on Middle East and Africa - Market size and forecast 2024-2029 ($ billion)
          • Data Table on Middle East and Africa - Market size and forecast 2024-2029 ($ billion)
          • Chart on Middle East and Africa - Year-over-year growth 2024-2029 (%)
          • Data Table on Middle East and Africa - Year-over-year growth 2024-2029 (%)
        • 12.8 US - Market size and forecast 2024-2029
          • Chart on US - Market size and forecast 2024-2029 ($ billion)
          • Data Table on US - Market size and forecast 2024-2029 ($ billion)
          • Chart on US - Year-over-year growth 2024-2029 (%)
          • Data Table on US - Year-over-year growth 2024-2029 (%)
        • 12.9 China - Market size and forecast 2024-2029
          • Chart on China - Market size and forecast 2024-2029 ($ billion)
          • Data Table on China - Market size and forecast 2024-2029 ($ billion)
          • Chart on China - Year-over-year growth 2024-2029 (%)
          • Data Table on China - Year-over-year growth 2024-2029 (%)
        • 12.10 India - Market size and forecast 2024-2029
          • Chart on India - Market size and forecast 2024-2029 ($ billion)
          • Data Table on India - Market size and forecast 2024-2029 ($ billion)
          • Chart on India - Year-over-year growth 2024-2029 (%)
          • Data Table on India - Year-over-year growth 2024-2029 (%)
        • 12.11 Canada - Market size and forecast 2024-2029
          • Chart on Canada - Market size and forecast 2024-2029 ($ billion)
          • Data Table on Canada - Market size and forecast 2024-2029 ($ billion)
          • Chart on Canada - Year-over-year growth 2024-2029 (%)
          • Data Table on Canada - Year-over-year growth 2024-2029 (%)
        • 12.12 Germany - Market size and forecast 2024-2029
          • Chart on Germany - Market size and forecast 2024-2029 ($ billion)
          • Data Table on Germany - Market size and forecast 2024-2029 ($ billion)
          • Chart on Germany - Year-over-year growth 2024-2029 (%)
          • Data Table on Germany - Year-over-year growth 2024-2029 (%)
        • 12.13 Japan - Market size and forecast 2024-2029
          • Chart on Japan - Market size and forecast 2024-2029 ($ billion)
          • Data Table on Japan - Market size and forecast 2024-2029 ($ billion)
          • Chart on Japan - Year-over-year growth 2024-2029 (%)
          • Data Table on Japan - Year-over-year growth 2024-2029 (%)
        • 12.14 France - Market size and forecast 2024-2029
          • Chart on France - Market size and forecast 2024-2029 ($ billion)
          • Data Table on France - Market size and forecast 2024-2029 ($ billion)
          • Chart on France - Year-over-year growth 2024-2029 (%)
          • Data Table on France - Year-over-year growth 2024-2029 (%)
        • 12.15 UK - Market size and forecast 2024-2029
          • Chart on UK - Market size and forecast 2024-2029 ($ billion)
          • Data Table on UK - Market size and forecast 2024-2029 ($ billion)
          • Chart on UK - Year-over-year growth 2024-2029 (%)
          • Data Table on UK - Year-over-year growth 2024-2029 (%)
        • 12.16 Australia - Market size and forecast 2024-2029
          • Chart on Australia - Market size and forecast 2024-2029 ($ billion)
          • Data Table on Australia - Market size and forecast 2024-2029 ($ billion)
          • Chart on Australia - Year-over-year growth 2024-2029 (%)
          • Data Table on Australia - Year-over-year growth 2024-2029 (%)
        • 12.17 Italy - Market size and forecast 2024-2029
          • Chart on Italy - Market size and forecast 2024-2029 ($ billion)
          • Data Table on Italy - Market size and forecast 2024-2029 ($ billion)
          • Chart on Italy - Year-over-year growth 2024-2029 (%)
          • Data Table on Italy - Year-over-year growth 2024-2029 (%)
        • 12.18 Market opportunity by geography
          • Market opportunity by geography ($ billion)
          • Data Tables on Market opportunity by geography ($ billion)

        13 Drivers, Challenges, and Opportunity/Restraints

        • 13.1 Market drivers
          • 13.2 Market challenges
            • 13.3 Impact of drivers and challenges
              • Impact of drivers and challenges in 2024 and 2029
            • 13.4 Market opportunities/restraints

              14 Competitive Landscape

              • 14.1 Overview
                • 14.2 Competitive Landscape
                  • Overview on criticality of inputs and factors of differentiation
                • 14.3 Landscape disruption
                  • Overview on factors of disruption
                • 14.4 Industry risks
                  • Impact of key risks on business

                15 Competitive Analysis

                • 15.1 Companies profiled
                  • Companies covered
                • 15.2 Company ranking index
                  • Company ranking index
                • 15.3 Market positioning of companies
                  • Matrix on companies position and classification
                • 15.4 Agropur Dairy Cooperative
                  • Agropur Dairy Cooperative - Overview
                  • Agropur Dairy Cooperative - Product / Service
                  • Agropur Dairy Cooperative - Key offerings
                  • SWOT
                • 15.5 Arla Foods amba
                  • Arla Foods amba - Overview
                  • Arla Foods amba - Product / Service
                  • Arla Foods amba - Key offerings
                  • SWOT
                • 15.6 China Mengniu Dairy Co. Ltd.
                  • China Mengniu Dairy Co. Ltd. - Overview
                  • China Mengniu Dairy Co. Ltd. - Business segments
                  • China Mengniu Dairy Co. Ltd. - Key offerings
                  • China Mengniu Dairy Co. Ltd. - Segment focus
                  • SWOT
                • 15.7 Dairy Farmers of America Inc.
                  • Dairy Farmers of America Inc. - Overview
                  • Dairy Farmers of America Inc. - Product / Service
                  • Dairy Farmers of America Inc. - Key offerings
                  • SWOT
                • 15.8 Danone SA
                  • Danone SA - Overview
                  • Danone SA - Business segments
                  • Danone SA - Key news
                  • Danone SA - Key offerings
                  • Danone SA - Segment focus
                  • SWOT
                • 15.9 DMK Deutsches Milchkontor GmbH
                  • DMK Deutsches Milchkontor GmbH - Overview
                  • DMK Deutsches Milchkontor GmbH - Product / Service
                  • DMK Deutsches Milchkontor GmbH - Key offerings
                  • SWOT
                • 15.10 Fonterra Cooperative Group Ltd.
                  • Fonterra Cooperative Group Ltd. - Overview
                  • Fonterra Cooperative Group Ltd. - Business segments
                  • Fonterra Cooperative Group Ltd. - Key news
                  • Fonterra Cooperative Group Ltd. - Key offerings
                  • Fonterra Cooperative Group Ltd. - Segment focus
                  • SWOT
                • 15.11 Glanbia plc
                  • Glanbia plc - Overview
                  • Glanbia plc - Business segments
                  • Glanbia plc - Key news
                  • Glanbia plc - Key offerings
                  • Glanbia plc - Segment focus
                  • SWOT
                • 15.12 Gujarat Cooperative Milk Marketing Federation Ltd.
                  • Gujarat Cooperative Milk Marketing Federation Ltd. - Overview
                  • Gujarat Cooperative Milk Marketing Federation Ltd. - Product / Service
                  • Gujarat Cooperative Milk Marketing Federation Ltd. - Key offerings
                  • SWOT
                • 15.13 Kerry Group Plc
                  • Kerry Group Plc - Overview
                  • Kerry Group Plc - Business segments
                  • Kerry Group Plc - Key news
                  • Kerry Group Plc - Key offerings
                  • Kerry Group Plc - Segment focus
                  • SWOT
                • 15.14 Lucerne Foods
                  • Lucerne Foods - Overview
                  • Lucerne Foods - Product / Service
                  • Lucerne Foods - Key offerings
                  • SWOT
                • 15.15 Nestle SA
                  • Nestle SA - Overview
                  • Nestle SA - Business segments
                  • Nestle SA - Key news
                  • Nestle SA - Key offerings
                  • Nestle SA - Segment focus
                  • SWOT
                • 15.16 Royal FrieslandCampina NV
                  • Royal FrieslandCampina NV - Overview
                  • Royal FrieslandCampina NV - Product / Service
                  • Royal FrieslandCampina NV - Key offerings
                  • SWOT
                • 15.17 Saputo Inc.
                  • Saputo Inc. - Overview
                  • Saputo Inc. - Business segments
                  • Saputo Inc. - Key offerings
                  • Saputo Inc. - Segment focus
                  • SWOT
                • 15.18 The Kraft Heinz Co.
                  • The Kraft Heinz Co. - Overview
                  • The Kraft Heinz Co. - Business segments
                  • The Kraft Heinz Co. - Key news
                  • The Kraft Heinz Co. - Key offerings
                  • The Kraft Heinz Co. - Segment focus
                  • SWOT

                16 Appendix

                • 16.1 Scope of the report
                  • 16.2 Inclusions and exclusions checklist
                    • Inclusions checklist
                    • Exclusions checklist
                  • 16.3 Currency conversion rates for US$
                    • Currency conversion rates for US$
                  • 16.4 Research methodology
                    • Research methodology
                  • 16.5 Data procurement
                    • Information sources
                  • 16.6 Data validation
                    • Data validation
                  • 16.7 Validation techniques employed for market sizing
                    • Validation techniques employed for market sizing
                  • 16.8 Data synthesis
                    • Data synthesis
                  • 16.9 360 degree market analysis
                    • 360 degree market analysis
                  • 16.10 List of abbreviations
                    • List of abbreviations

                  Research Methodology

                  Technavio presents a detailed picture of the market by way of study, synthesis, and summation of data from multiple sources. The analysts have presented the various facets of the market with a particular focus on identifying the key industry influencers. The data thus presented is comprehensive, reliable, and the result of extensive research, both primary and secondary.

                  INFORMATION SOURCES

                  Primary sources

                  • Manufacturers and suppliers
                  • Channel partners
                  • Industry experts
                  • Strategic decision makers

                  Secondary sources

                  • Industry journals and periodicals
                  • Government data
                  • Financial reports of key industry players
                  • Historical data
                  • Press releases

                  DATA ANALYSIS

                  Data Synthesis

                  • Collation of data
                  • Estimation of key figures
                  • Analysis of derived insights

                  Data Validation

                  • Triangulation with data models
                  • Reference against proprietary databases
                  • Corroboration with industry experts

                  REPORT WRITING

                  Qualitative

                  • Market drivers
                  • Market challenges
                  • Market trends
                  • Five forces analysis

                  Quantitative

                  • Market size and forecast
                  • Market segmentation
                  • Geographical insights
                  • Competitive landscape

                  Interested in this report?

                  Get your sample now to see our research methodology and insights!

                  Download Now

                  Frequently Asked Questions

                  Dairy Food market growth will increase by $ 96.1 bn during 2025-2029.

                  The Dairy Food market is expected to grow at a CAGR of 2.2% during 2025-2029.

                  Dairy Food market is segmented by Product( Milk, Cheese, Yogurt, Butter, Others) Distribution Channel( Supermarkets, Convenience stores, Online, South America, MEA) Type( Lactose, Lactose-free, North America, South America, Middle East and Africa)

                  Agropur Dairy Cooperative, Arla Foods amba, China Mengniu Dairy Co. Ltd., Dairy Farmers of America Inc., Danone SA, DMK Deutsches Milchkontor GmbH, Fonterra Cooperative Group Ltd., Glanbia plc, Gujarat Cooperative Milk Marketing Federation Ltd., Inner Mongolia Yili Industrial Group Co. Ltd., Kerry Group Plc, Lucerne Foods, Meiji Holdings Co. Ltd., Nestle SA, Royal FrieslandCampina NV, Saputo Inc., Schreiber Foods Inc., The Kraft Heinz Co., The Kroger Co., Unilever PLC are a few of the key vendors in the Dairy Food market.

                  APAC will register the highest growth rate of 41% among the other regions. Therefore, the Dairy Food market in APAC is expected to garner significant business opportunities for the vendors during the forecast period.

                  US, China, India, Canada, Germany, Japan, France, UK, Australia, Italy

                  • Rising adoption of healthy food habitsThe prevalence and incidences of various bone diseases such as osteoporosis is the driving factor this market.
                  • arthritis is the driving factor this market.
                  • hypocalcemia is the driving factor this market.
                  • Paget disease is the driving factor this market.
                  • and osteogenesis imperfecta are increasing significantly globally. Such bone diseases are caused due to low or insufficient calcium intake.Osteoporosis results in weak and brittle bones and may lead to fractures. According to the World Bank is the driving factor this market.
                  • in 2023 is the driving factor this market.
                  • females accounted for 49.7% of the global population. The high percentage of the female population will lead to a greater demand for dairy food products to avoid bone diseases. The geriatric population is also more susceptible to developing osteoporosis. In addition is the driving factor this market.
                  • patients with hypocalcemia have lower-than-average levels of calcium in the plasma.People are adopting healthy food habits to increase their immunity and reduce the chances of developing various diseases is the driving factor this market.
                  • including diseases related to the deficiency of calcium. Dairy foods is the driving factor this market.
                  • such as milk is the driving factor this market.
                  • cheese is the driving factor this market.
                  • and yogurt is the driving factor this market.
                  • are rich in calcium and are recommended by doctors and nutritionists to avoid the risk of developing diseases related to calcium deficiency and bone diseases. As dairy foods are rich in various nutrients is the driving factor this market.
                  • such as calcium is the driving factor this market.
                  • potassium is the driving factor this market.
                  • vitamin D is the driving factor this market.
                  • and protein is the driving factor this market.
                  • people include dairy foods in their diets to reduce the chances of developing bone diseases. This will fuel the demand for dairy foods is the driving factor this market.
                  • as well as the growth of the global dairy food market during the forecast period. is the driving factor this market.

                  The Dairy Food market vendors should focus on grabbing business opportunities from the Milk segment as it accounted for the largest market share in the base year.
                  RIA - Research AI Assistant
                  Ask RIA