Meal Kit Market Size 2026-2030
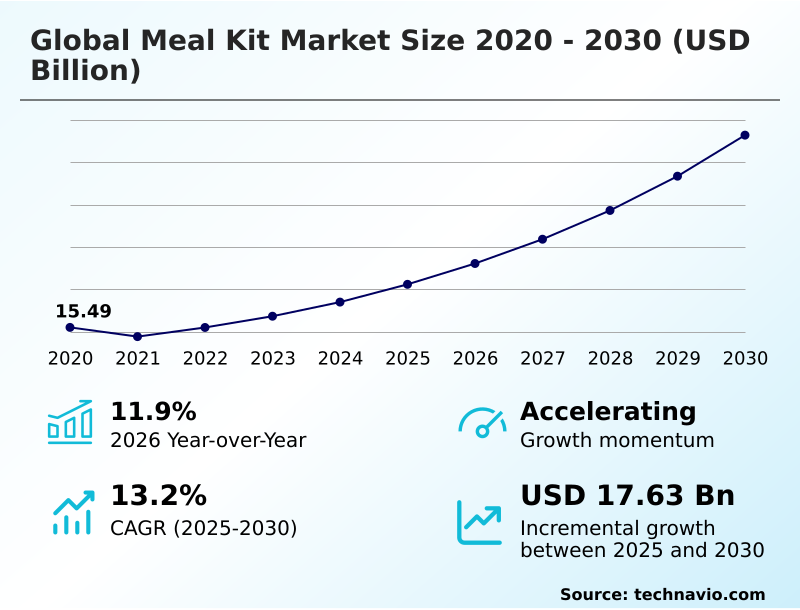
The meal kit market size is valued to increase by USD 17.63 billion, at a CAGR of 13.2% from 2025 to 2030. Strategic evolution of personalization and AI-driven culinary customization will drive the meal kit market.
Major Market Trends & Insights
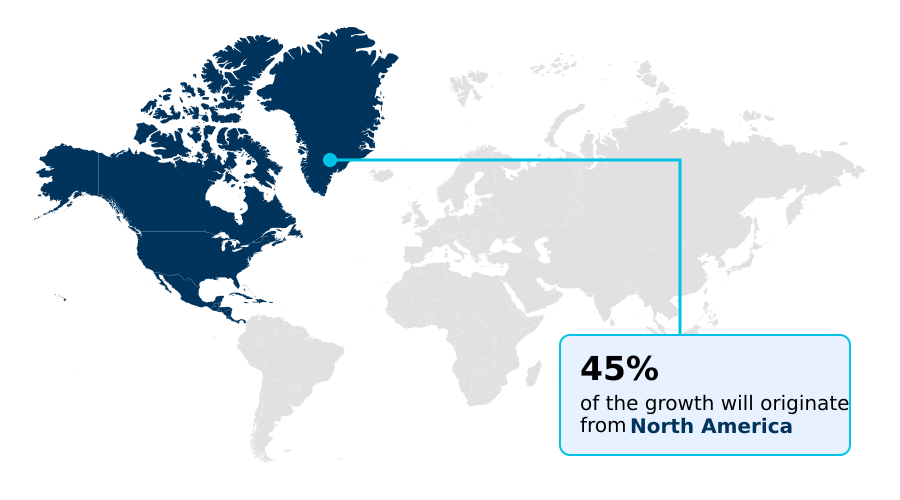
- North America dominated the market and accounted for a 45% growth during the forecast period.
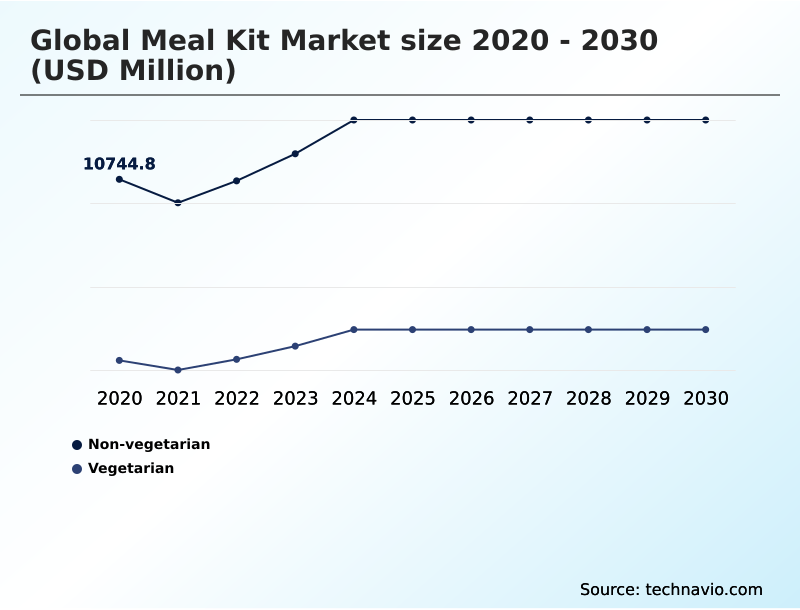
- By Product - Non-vegetarian segment was valued at USD 12.71 billion in 2024
- By Distribution Channel - Online segment accounted for the largest market revenue share in 2024
Market Size & Forecast
- Market Opportunities: USD 22.72 billion
- Market Future Opportunities: USD 17.63 billion
- CAGR from 2025 to 2030 : 13.2%
Market Summary
- The meal kit market is undergoing a significant transformation, moving beyond a niche service to become a central component of the modern digital food economy. This evolution is propelled by the need for convenience among time-constrained households and a growing preference for healthy, home-cooked meals without the complexities of planning and shopping.
- Operators are diversifying from traditional cook-and-eat models to expand the heat-and-eat segment, which offers high-quality nutrition with minimal preparation. A key business scenario involves leveraging AI-driven personalization not just for recipe curation, but also for optimizing cold-chain logistics. By implementing predictive analytics for demand forecasting, firms can enhance inventory management, reduce food waste, and improve operational margins.
- This addresses subscription fatigue by delivering greater value and customization. The industry's trajectory is defined by this pivot from a logistics-based model to a data-centric service that prioritizes nutritional transparency, on-demand ordering, and sustainable practices to navigate supply chain fragility and retain customers.
What will be the Size of the Meal Kit Market during the forecast period?
Get Key Insights on Market Forecast (PDF) Get Free Sample
How is the Meal Kit Market Segmented?
The meal kit industry research report provides comprehensive data (region-wise segment analysis), with forecasts and estimates in "USD million" for the period 2026-2030, as well as historical data from 2020-2024 for the following segments.
- Product
- Non-vegetarian
- Vegetarian
- Distribution channel
- Online
- Instore
- Type
- Cook and eat
- Heat and eat
- Geography
- North America
- US
- Canada
- Mexico
- Europe
- Germany
- UK
- France
- APAC
- China
- India
- Japan
- South America
- Brazil
- Argentina
- Colombia
- Middle East and Africa
- UAE
- Saudi Arabia
- South Africa
- Rest of World (ROW)
- North America
By Product Insights
The non-vegetarian segment is estimated to witness significant growth during the forecast period.
The non-vegetarian segment remains a cornerstone of the meal kit industry, catering to consumers who prioritize animal-based proteins in their diet.
This category, featuring gourmet meal delivery options with poultry, beef, and seafood, leverages the convenience of ready-to-cook kits to simplify complex culinary preparations at home. Providers are enhancing nutritional transparency and expanding plant-based meal kits to capture a wider audience.
However, the segment is susceptible to market pressures, as demonstrated by forecasts indicating that prices for high-protein feedstocks like beef could rise by nearly 10%, impacting operational margins.
To maintain competitiveness, companies focus on the quality of ingredients and portion control, differentiating their offerings within the broader convenience food market and online grocery services to meet demand for diet-friendly meals.
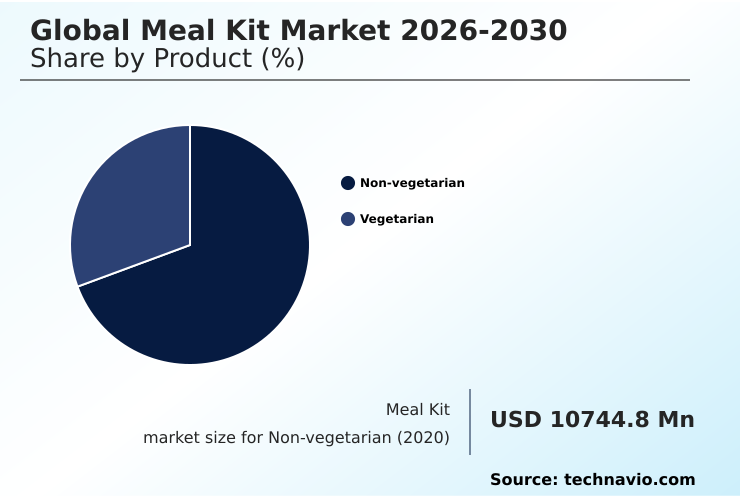
The Non-vegetarian segment was valued at USD 12.71 billion in 2024 and showed a gradual increase during the forecast period.
Regional Analysis
North America is estimated to contribute 45% to the growth of the global market during the forecast period.Technavio’s analysts have elaborately explained the regional trends and drivers that shape the market during the forecast period.
See How Meal Kit Market Demand is Rising in North America Get Free Sample
The global meal kit market's geographic landscape is diverse, with growth dynamics varying significantly across regions.
North America represents over 44% of the market opportunity, characterized by high consumer adoption and a competitive push toward menu customization and flexible subscription-free meal kits.
However, growth in APAC is poised to outpace North America, driven by a burgeoning digital food economy and the expansion of hyper-local delivery networks in dense urban centers.
In Europe, the focus is on perfecting cold-chain logistics to meet stringent food safety standards and consumer demand for fresh, locally sourced ingredients. Efficient inventory management is critical in all regions to mitigate the impacts of food price volatility.
Success hinges on adapting meal planning solutions to local tastes while optimizing logistics for a seamless experience, whether through established platforms or emerging subscription-free meal kits.
Market Dynamics
Our researchers analyzed the data with 2025 as the base year, along with the key drivers, trends, and challenges. A holistic analysis of drivers will help companies refine their marketing strategies to gain a competitive advantage.
- The global meal kit market 2026-2030 is navigating a complex landscape defined by evolving consumer preferences and operational challenges. A central debate involves comparing cook and eat vs heat and eat models, as providers seek to cater to both those desiring a hands-on culinary experience and those prioritizing ultimate convenience.
- The impact of food inflation on meal kits is a persistent concern, forcing companies to refine their sourcing and pricing strategies to remain competitive. To combat high meal kit subscription churn rate, firms are increasingly turning to AI in meal kit personalization, tailoring menus to individual tastes and dietary needs.
- This technological shift is also central to developing effective meal kit customer acquisition strategies that move beyond costly initial discounts. Furthermore, the industry is investing in sustainable cold chain for food delivery to address environmental concerns and reduce spoilage, with advanced operators reporting spoilage rates less than half of those using traditional methods.
- The expansion into meal kits with organic ingredients and options for niche lifestyles, such as meal kits for vegan diets or meal kits for weight loss and fitness, highlights a move toward hyper-segmentation. Integrating meal kits with smart kitchen appliances represents the next frontier, promising a more seamless user experience.
- Ultimately, the market's future hinges on balancing convenience with sustainability and personalization, whether through on-demand meal kit services vs subscription models.
What are the key market drivers leading to the rise in the adoption of Meal Kit Industry?
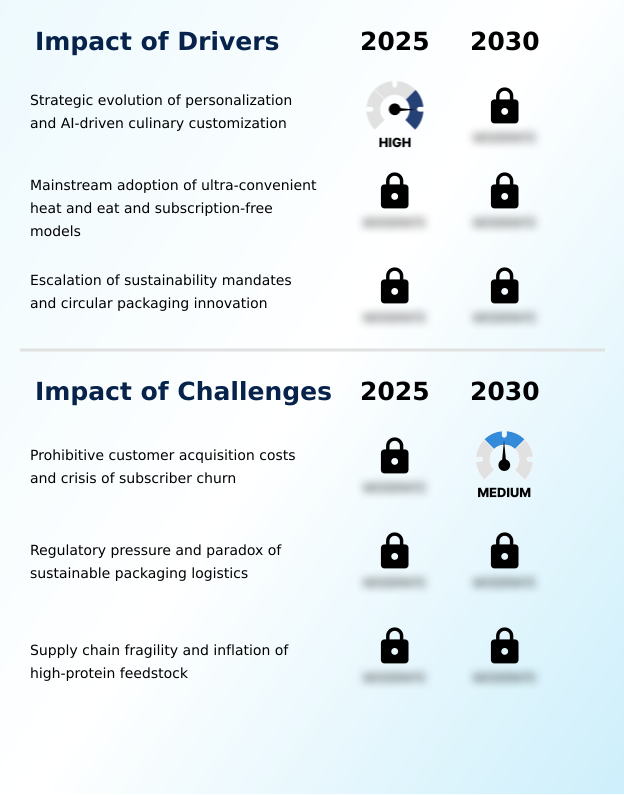
- The strategic evolution toward hyper-personalization, enabled by AI-driven culinary customization, is a primary driver of market growth and consumer retention.
- Key drivers shaping the meal kit market include the integration of AI-driven personalization and a strong consumer push for sustainability.
- The direct-to-consumer model allows companies to gather vast amounts of data, enabling hyper-personalized marketing that has been shown to boost customer retention by over 25%. This data-centric approach aligns with evolving consumer food trends.
- On the sustainability front, the adoption of circular packaging solutions and a farm-to-front-door sourcing philosophy are becoming critical differentiators.
- Companies committed to ethical sourcing and biodegradable packaging are not only meeting regulatory demands but also capturing a loyal customer base, with some achieving a reduction in packaging waste by up to 60%.
- These strategies are transforming e-commerce food sales by aligning convenience with corporate responsibility and food waste reduction.
What are the market trends shaping the Meal Kit Industry?
- The market is witnessing a structural shift away from rigid subscription models. This transition favors on-demand flexibility and de-averaged services to accommodate modern consumer behavior.
- The meal kit industry is rapidly evolving beyond rigid subscriptions, driven by a trend toward on-demand ordering to combat subscription fatigue. This shift offers consumers greater control, with the rise of the heat-and-eat segment catering to demand for ultimate convenience. Innovations in last-mile delivery and recipe curation enhance the overall culinary experience and provide flexible home cooking solutions.
- Technologically, AI-driven optimization tools are delivering significant efficiencies, with some operators reducing coolant usage in shipments by up to 30%. This transition to flexible, non-committal food subscription box models is proving effective, as companies report customer churn rates dropping by 15-20% compared to traditional weekly plans.
- The market is increasingly focused on providing healthy meal delivery that fits seamlessly into modern, unpredictable lifestyles.
What challenges does the Meal Kit Industry face during its growth?
- Prohibitive customer acquisition costs, compounded by a persistent crisis of subscriber churn, present a significant challenge to the industry's long-term profitability.
- The meal kit market faces significant challenges that threaten long-term viability, primarily high customer acquisition cost and subscriber churn. In saturated markets, the cost to acquire a new user can exceed their lifetime value by as much as 1.5 times, making the subscription-based model financially strenuous.
- This is compounded by supply chain fragility, with inflation driving the cost of key ingredients up by nearly 10% in some regions, squeezing already thin margins. The paradox of sustainable packaging adds another layer of complexity, as meeting regulatory demands and consumer expectations for eco-friendly materials increases operational expenses.
- This environment forces players in the food tech industry to innovate their food delivery business models, moving toward more flexible offerings like ready-to-eat meals and specialized dietary options to stay competitive.
Exclusive Technavio Analysis on Customer Landscape
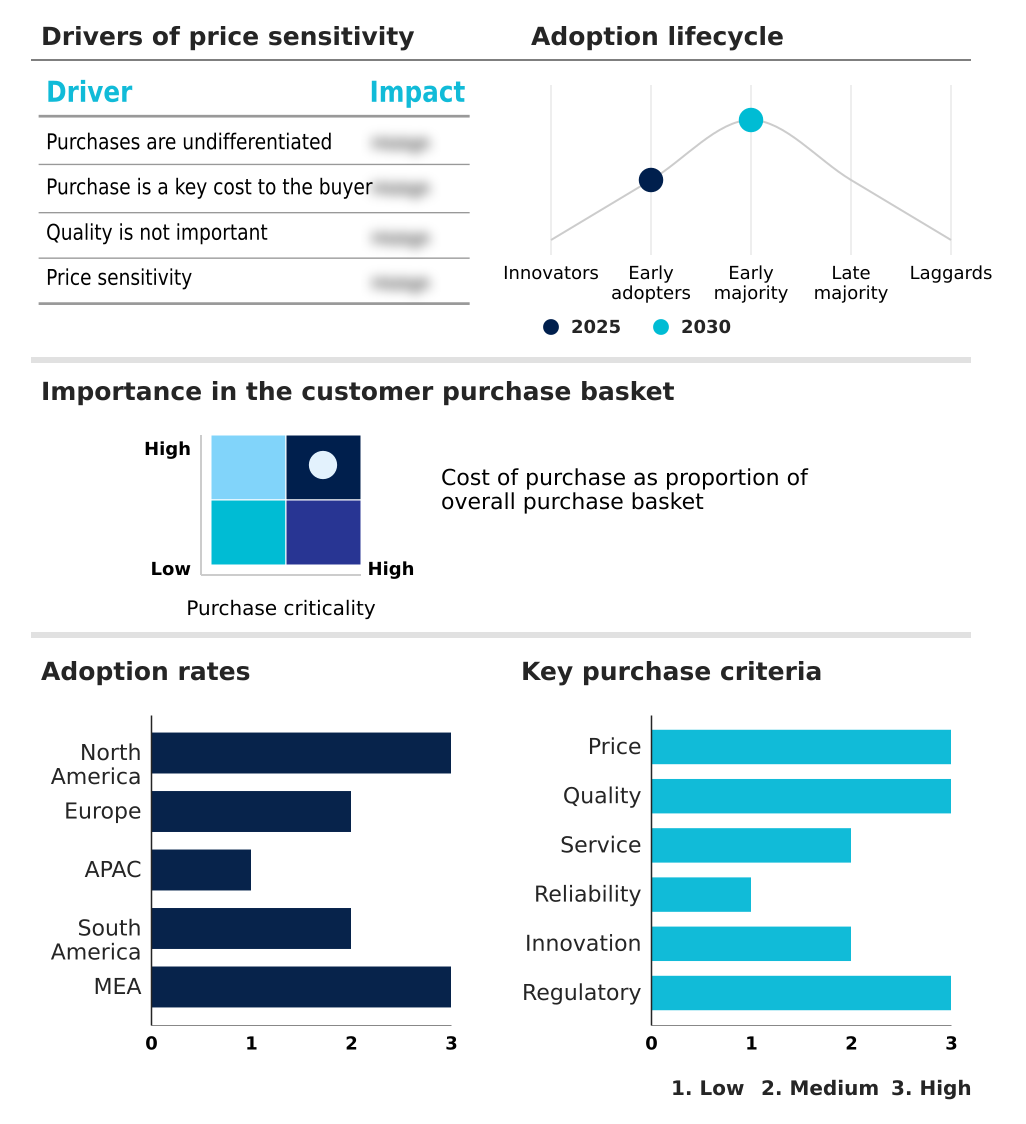
The meal kit market forecasting report includes the adoption lifecycle of the market, covering from the innovator’s stage to the laggard’s stage. It focuses on adoption rates in different regions based on penetration. Furthermore, the meal kit market report also includes key purchase criteria and drivers of price sensitivity to help companies evaluate and develop their market growth analysis strategies.
Customer Landscape of Meal Kit Industry
Competitive Landscape
Companies are implementing various strategies, such as strategic alliances, meal kit market forecast, partnerships, mergers and acquisitions, geographical expansion, and product/service launches, to enhance their presence in the industry.
Albertsons Companies Inc. - Delivers diverse, pre-portioned culinary solutions, bridging the gap between grocery retail and convenient home cooking experiences for a broad consumer base.
The industry research and growth report includes detailed analyses of the competitive landscape of the market and information about key companies, including:
- Albertsons Companies Inc.
- Blue Apron LLC
- CookUnity Inc
- Dinnerly
- Epicured
- EveryPlate
- Gobble Inc.
- Gourmet Meal Delivery LLC
- Gousto
- Green Chef
- Hungryroot Inc
- Marley Spoon Inc.
- Oisix ra daichi Inc.
- Purple Carrot
- Relish Labs LLC
- Riverford Organic Farmers Ltd.
- SimplyCook Ltd.
- Sun Basket Inc.
- The Kroger Co.
- Woop Ltd.
Qualitative and quantitative analysis of companies has been conducted to help clients understand the wider business environment as well as the strengths and weaknesses of key industry players. Data is qualitatively analyzed to categorize companies as pure play, category-focused, industry-focused, and diversified; it is quantitatively analyzed to categorize companies as dominant, leading, strong, tentative, and weak.
Recent Development and News in Meal kit market
- In August 2024, Blue Apron LLC, under the ownership of Wonder, officially transitioned its service to an a la carte ordering model, eliminating mandatory subscriptions to enhance customer flexibility.
- In October 2024, the plant-based meal kit company Grubby announced a strategic partnership with the recipe platform OP for the ready-meal brand Allplants to expand its inventory and improve delivery logistics across the UK.
- In November 2024, Blue Apron LLC launched a sophisticated AI-powered subscription tier that utilizes machine learning to deliver personalized non-vegetarian recipe recommendations based on user feedback and protein preferences.
- In March 2025, Daily Harvest introduced its proprietary AI-driven packaging optimization tools, which calculate the precise amount of dry ice required for shipments based on real-time weather data and product mix, minimizing waste.
Dive into Technavio’s robust research methodology, blending expert interviews, extensive data synthesis, and validated models for unparalleled Meal Kit Market insights. See full methodology.
| Market Scope | |
|---|---|
| Page number | 279 |
| Base year | 2025 |
| Historic period | 2020-2024 |
| Forecast period | 2026-2030 |
| Growth momentum & CAGR | Accelerate at a CAGR of 13.2% |
| Market growth 2026-2030 | USD 17630.5 million |
| Market structure | Fragmented |
| YoY growth 2025-2026(%) | 11.9% |
| Key countries | US, Canada, Mexico, Germany, UK, France, Italy, Spain, The Netherlands, China, India, Japan, South Korea, Australia, Indonesia, Brazil, Argentina, Colombia, UAE, Saudi Arabia, South Africa, Egypt and Nigeria |
| Competitive landscape | Leading Companies, Market Positioning of Companies, Competitive Strategies, and Industry Risks |
Research Analyst Overview
- The global meal kit market 2026-2030 is undergoing a strategic pivot as it matures, moving from a growth-at-all-costs mindset to a focus on sustainable profitability. The conventional subscription-based model is being challenged by on-demand ordering platforms designed to combat high subscriber churn and reduce prohibitive customer acquisition cost.
- This shift requires a sophisticated approach to inventory management and cold-chain logistics to support a more unpredictable demand flow. Central to this evolution is the role of AI-driven personalization, which enables dynamic recipe curation and menu customization, enhancing customer retention. Technology is also critical in streamlining last-mile delivery and achieving significant food waste reduction, a key metric for operational efficiency.
- For instance, AI-driven demand forecasting has been shown to reduce food waste by over 25% for some operators. As the direct-to-consumer digital food economy expands, providers are diversifying into the heat-and-eat segment and offering specialized plant-based meal kits and gourmet meal delivery.
- Success now depends on achieving nutritional transparency and implementing circular packaging solutions without compromising the farm-to-front-door quality promise that defines the industry's premium ready-to-cook kits.
What are the Key Data Covered in this Meal Kit Market Research and Growth Report?
-
What is the expected growth of the Meal Kit Market between 2026 and 2030?
-
USD 17.63 billion, at a CAGR of 13.2%
-
-
What segmentation does the market report cover?
-
The report is segmented by Product (Non-vegetarian, and Vegetarian), Distribution Channel (Online, and Instore), Type (Cook and eat, and Heat and eat) and Geography (North America, Europe, APAC, South America, Middle East and Africa)
-
-
Which regions are analyzed in the report?
-
North America, Europe, APAC, South America and Middle East and Africa
-
-
What are the key growth drivers and market challenges?
-
Strategic evolution of personalization and AI-driven culinary customization, Prohibitive customer acquisition costs and crisis of subscriber churn
-
-
Who are the major players in the Meal Kit Market?
-
Albertsons Companies Inc., Blue Apron LLC, CookUnity Inc, Dinnerly, Epicured, EveryPlate, Gobble Inc., Gourmet Meal Delivery LLC, Gousto, Green Chef, Hungryroot Inc, Marley Spoon Inc., Oisix ra daichi Inc., Purple Carrot, Relish Labs LLC, Riverford Organic Farmers Ltd., SimplyCook Ltd., Sun Basket Inc., The Kroger Co. and Woop Ltd.
-
Market Research Insights
- The meal kit market operates at the intersection of convenience and shifting consumer values, where food delivery business models are constantly refined. While the appeal of restaurant-quality meals at home drives adoption, operators face significant hurdles.
- For instance, the push for sustainability has led to initiatives aiming to reduce plastic packaging footprints by up to 40%, yet this often increases operational costs. Simultaneously, food price volatility can cause the price of essential proteins to rise by over 10%, squeezing margins for services that offer specialized dietary options.
- This dynamic forces providers in the food tech industry to balance the consumer demand for convenience with the economic realities of sourcing and delivery. Success hinges on creating value that outweighs the accessibility of ready-to-eat meals and traditional grocery shopping, making operational efficiency paramount for survival.
We can help! Our analysts can customize this meal kit market research report to meet your requirements.
 RIA -
RIA - 
