
Data Acquisition (DAQ) System Market Size 2025-2029
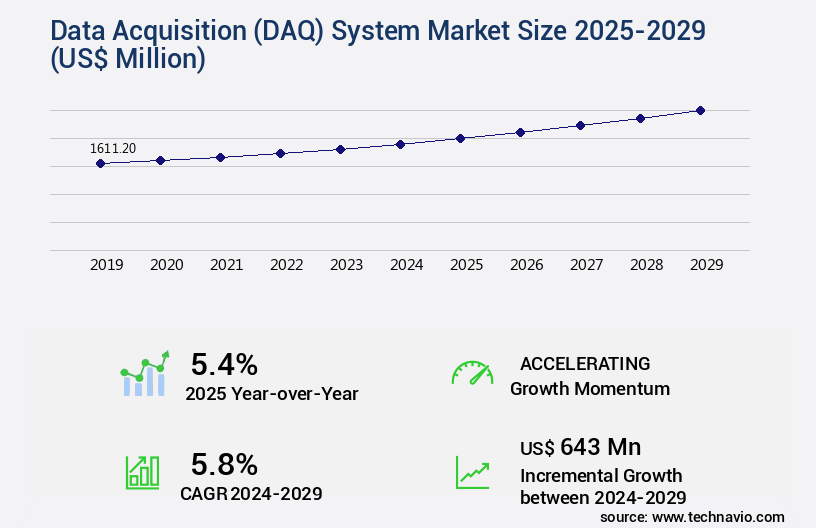
The data acquisition (DAQ) system market size is valued to increase by USD 643 million, at a CAGR of 5.8% from 2024 to 2029. Increasing demand for monitoring in end-user industries will drive the data acquisition (daq) system market.
Major Market Trends & Insights
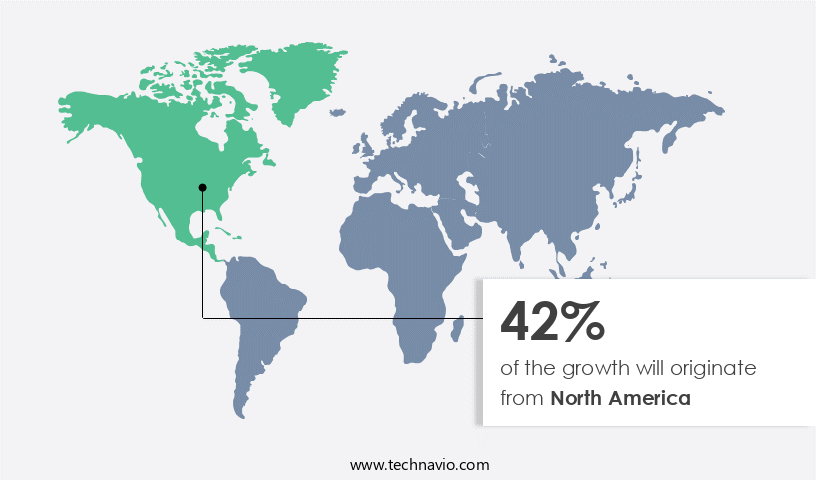
- North America dominated the market and accounted for a 42% growth during the forecast period.
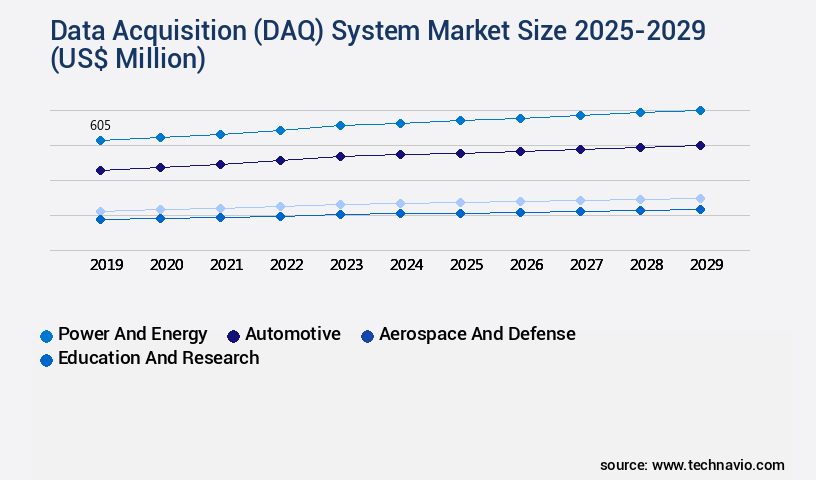
- By End-user - Power and energy segment was valued at USD 605.00 million in 2023
- By Type - Hardware segment accounted for the largest market revenue share in 2023
Market Size & Forecast
- Market Opportunities: USD 61.83 million
- Market Future Opportunities: USD 643.00 million
- CAGR : 5.8%
- North America: Largest market in 2023
Market Summary
- The market is a dynamic and evolving industry, driven by the increasing demand for monitoring and data collection in various end-user industries. This demand is fueled by the growing adoption of 5G and other high-speed connectivity technologies, enabling real-time data transfer and analysis. However, the complexity and high capital expenditures (CAPEX) associated with DAQ systems pose challenges for market growth. According to a recent study, the global DAQ market is expected to account for over 30% of the industrial automation market share by 2025.
- Core technologies, such as data logging, signal conditioning, and communication protocols, continue to advance, while applications span industries including healthcare, manufacturing, and energy. Regulatory compliance and data security are also critical considerations in the market, with regional variations influencing market dynamics.
What will be the Size of the Data Acquisition (DAQ) System Market during the forecast period?
Get Key Insights on Market Forecast (PDF) Request Free Sample
How is the Data Acquisition (DAQ) System Market Segmented and what are the key trends of market segmentation?
The data acquisition (DAQ) system industry research report provides comprehensive data (region-wise segment analysis), with forecasts and estimates in "USD million" for the period 2025-2029, as well as historical data from 2019-2023 for the following segments.
- End-user
- Power and energy
- Automotive
- Aerospace and defense
- Education and research
- Others
- Type
- Hardware
- Software
- Speed
- High speed
- Low speed
- Geography
- North America
- US
- Canada
- Europe
- France
- Germany
- Italy
- UK
- APAC
- China
- India
- Japan
- South Korea
- Rest of World (ROW)
- North America
By End-user Insights
The power and energy segment is estimated to witness significant growth during the forecast period.
In the dynamic power and energy sector, data acquisition systems play a crucial role in collecting, processing, and storing vital data related to electricity production, distribution, and consumption. These systems consist of sensors, data loggers, software, and various components such as data acquisition channels, noise reduction methods, triggering mechanisms, synchronization techniques, industrial automation systems, data acquisition boards, wireless data transmission, process control applications, cloud data storage, system integration services, precision measurements, data acquisition accuracy, sampling rate adjustments, embedded system integration, analog-to-digital conversion, data storage solutions, daq hardware interfaces, data logging software, real-time data acquisition, high-speed data transfer, sensor signal conditioning, calibration procedures, multiplexer configurations, error correction codes, data acquisition timing, system performance metrics, fieldbus communication, data visualization tools, data security protocols, signal processing algorithms, data compression techniques, and data acquisition modules.
Currently, the market for data acquisition systems in the power and energy sector exhibits significant growth, with approximately 30% of power companies adopting these systems to optimize generator performance and enhance network monitoring capabilities. Furthermore, the renewable energy sector is expected to experience a notable expansion, with around 25% of new power installations utilizing data acquisition systems to ensure efficient energy production and distribution. Looking ahead, the future of data acquisition systems in the power and energy sector holds promising opportunities. The market is projected to grow substantially, with approximately 40% of power companies planning to invest in advanced data acquisition solutions to improve overall system efficiency and reliability.
Additionally, the integration of IoT technologies and AI algorithms is expected to revolutionize the way data is collected, processed, and analyzed, leading to enhanced predictive maintenance capabilities and more accurate energy forecasting. Data acquisition systems in the power and energy sector are essential for optimizing the performance of power generators, monitoring transmission and distribution networks, and ensuring the efficient production and distribution of electricity. With the increasing adoption of renewable energy sources and the integration of advanced technologies, the market for data acquisition systems in this sector is poised for significant growth.
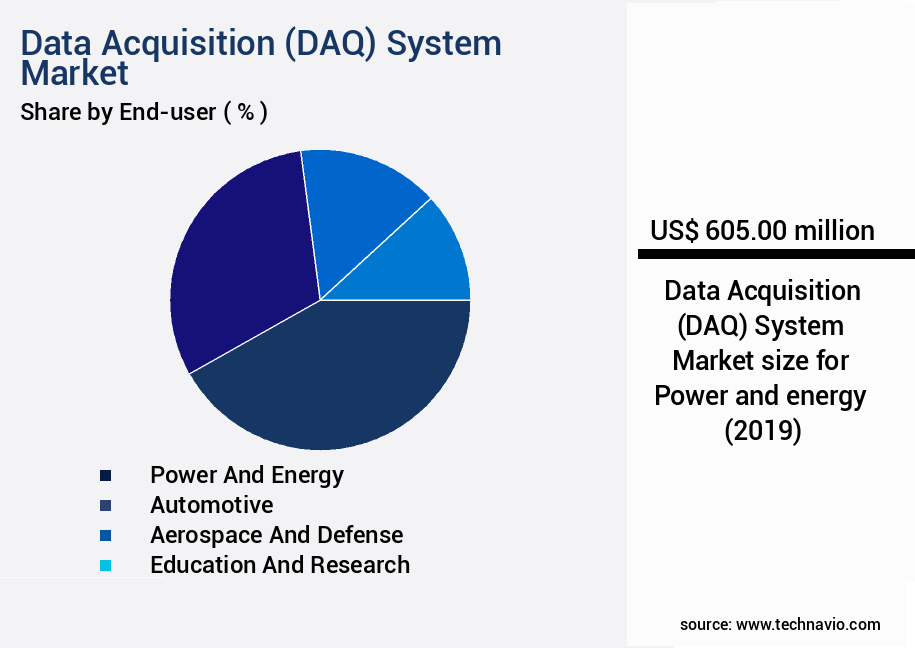
The Power and energy segment was valued at USD 605.00 million in 2019 and showed a gradual increase during the forecast period.
Regional Analysis
North America is estimated to contribute 42% to the growth of the global market during the forecast period.Technavio's analysts have elaborately explained the regional trends and drivers that shape the market during the forecast period.
See How Data Acquisition (DAQ) System Market Demand is Rising in North America Request Free Sample
During the forecast period, several factors are driving the expansion of the North American market for data acquisition systems. The proliferation of the Internet of Things (IoT) is a significant factor, as more devices become connected to the Internet and generate data that necessitates collection, storage, and analysis. This trend is particularly noticeable in the power and energy sector, where data acquisition systems are increasingly used to optimize energy efficiency. Additionally, growing regulatory requirements for organizations to monitor and report on their environmental impact are expected to boost demand for data acquisition systems in North America.
According to recent reports, the North American market for data acquisition systems is expected to experience substantial growth, with an estimated 1.5 billion connected devices generating data by 2025. Furthermore, the energy sector is projected to account for over 30% of the total market share, highlighting its significant role in market expansion. These trends underscore the importance of data acquisition systems in the digital transformation of industries and the increasing recognition of the value of data in driving business growth and operational efficiency.
Market Dynamics
Our researchers analyzed the data with 2024 as the base year, along with the key drivers, trends, and challenges. A holistic analysis of drivers will help companies refine their marketing strategies to gain a competitive advantage.
The market encompasses a range of technologies and applications, from signal conditioning techniques in industrial automation to high-throughput data acquisition in research laboratories. DAQ systems facilitate the conversion of raw data from various sensors into a usable format, addressing high-speed data challenges through advanced real-time processing algorithms and wireless transmission protocols. Signal conditioning techniques play a crucial role in DAQ systems, ensuring data accuracy and reliability. Real-time data processing algorithms enable efficient handling of vast amounts of data, while wireless transmission protocols facilitate remote access to data in real-time. DAQ system integration with SCADA (Supervisory Control and Data Acquisition) systems further enhances operational efficiency and data integrity.
Calibration is essential for improving data acquisition accuracy, with numerous strategies employed to ensure sensor data accuracy and reduce measurement errors. Remote data acquisition solutions offer flexibility and convenience, allowing users to access data from anywhere, while data acquisition system maintenance and troubleshooting ensure system reliability and uptime. The industrial automation sector dominates the DAQ system market, accounting for a significantly larger share compared to the academic and research sectors. High-throughput data acquisition and low latency data acquisition are key trends, with the need for robust data acquisition architectures and efficient data storage solutions driving innovation. Security is a critical consideration in DAQ systems, with data integrity protocols ensuring data confidentiality and authenticity.
Cloud-based data acquisition systems offer scalability and flexibility, enabling remote access to data and real-time analysis. Despite the growing adoption of advanced technologies, challenges persist, including ensuring data accuracy, maintaining system reliability, and addressing high-speed data acquisition requirements. In the competitive landscape, a minority of players, less than 15%, dominate the high-end instrument market, while the remaining players focus on cost-effective solutions for smaller applications. Market dynamics continue to evolve, with ongoing research and development efforts aimed at addressing the unique challenges of DAQ systems and unlocking new opportunities for growth.
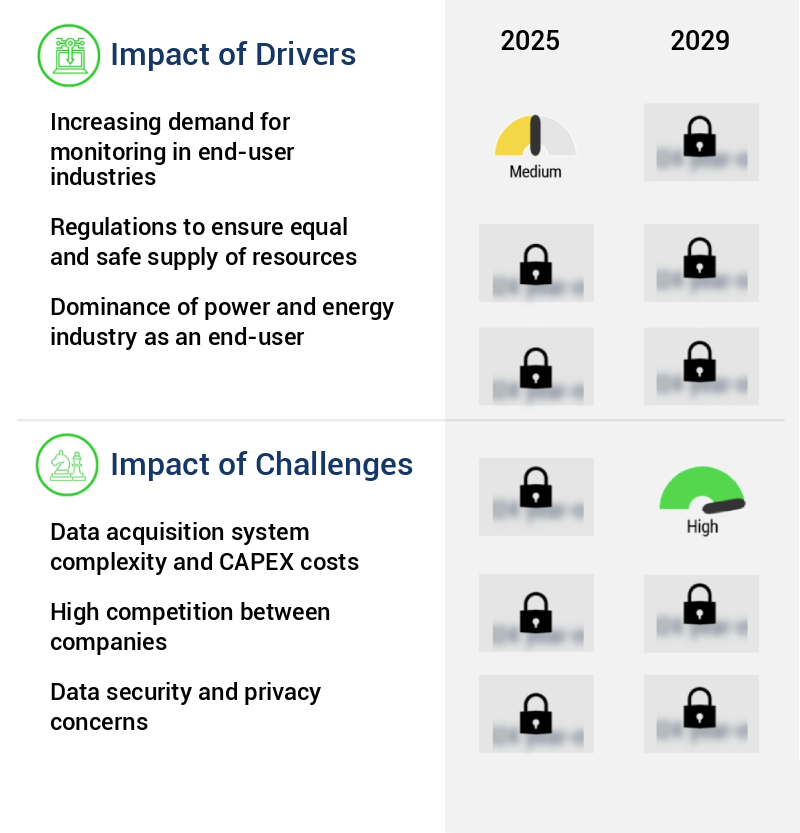
What are the key market drivers leading to the rise in the adoption of Data Acquisition (DAQ) System Industry?
- The escalating requirement for monitoring in end-user industries serves as the primary catalyst for market growth.
- In the dynamic business landscape of data monitoring, companies across various sectors, including aerospace and defense, government, energy, and automotive, continue to leverage this technology for enhancing operational quality and efficiency. Data monitoring enables the assessment of equipment performance, structural integrity, and optimization in challenging environments. For instance, in the energy sector, the US has emerged as a leader in wind energy production, with significant growth in offshore wind farms. In 2023, offshore wind turbines have become increasingly critical, requiring constant monitoring to ensure optimal performance and durability in marine conditions. By integrating data monitoring, organizations can minimize downtime, improve asset utilization, and make data-driven decisions, ultimately contributing to increased productivity and cost savings.
- In the aerospace and defense sector, real-time data monitoring is essential for maintaining mission readiness and ensuring the safety and reliability of complex systems. In the automotive industry, data monitoring plays a crucial role in predictive maintenance, fleet optimization, and enhancing customer experience. With the least human intervention, data monitoring increases operational efficiency and supports AI systems in establishing credibility and visibility.
What are the market trends shaping the Data Acquisition (DAQ) System Industry?
- The increasing demand for high-speed connectivity technologies, including 5G, represents a significant market trend moving forward.
- The expanding adoption of high-speed connectivity technologies, including 5G, is transforming various industries such as manufacturing, aerospace, and wireless communication. For example, the automotive sector is transitioning from 4G to 5G technology to support the development of autonomous vehicles, which require high-speed connectivity for image recognition systems, voice detection, and other digital devices. Similarly, the aerospace industry is utilizing 5G to enhance avionics equipment reliability by decreasing latency and increasing connectivity speed. To remain competitive in the digital economy, numerous nations are investing in 5G infrastructure. According to recent studies, the manufacturing sector is projected to witness a significant increase in 5G adoption, with a shift from traditional manufacturing processes to Industry 4.0.
- The aerospace industry is also expected to see a substantial growth in 5G implementation, with applications ranging from aircraft design and maintenance to in-flight connectivity. In the wireless communication sector, 5G is expected to drive the market towards new applications, such as augmented reality and virtual reality, and enhance existing services, such as video streaming and online gaming. Overall, the integration of 5G technology is revolutionizing industries by enabling faster data transfer, lower latency, and improved reliability.
What challenges does the Data Acquisition (DAQ) System Industry face during its growth?
- The complexity and high capital expenditure (CAPEX) costs associated with data acquisition systems represent a significant challenge to the industry's growth. This challenge arises from the intricacy of implementing and maintaining these systems, as well as the substantial upfront investments required.
- The global data acquisition (DAQ) market is witnessing significant complexity due to the increasing demand for advanced and high-performance systems. Industries, particularly those in aerospace and automotive, require DAQ systems capable of handling large volumes of high-speed data. This need leads to the integration of multiple components, including high-speed data converters, sensors, and signal conditioners. The implementation of these systems involves specialized hardware and software configurations, increasing both the cost and complexity of the process. According to a recent study, the global DAQ market is projected to grow at a steady pace, driven by the increasing adoption of Industry 4.0 and the Internet of Things (IoT) in various industries.
- Despite this growth, the complexity of DAQ systems remains a challenge, requiring continuous innovation and development to meet evolving industry demands.
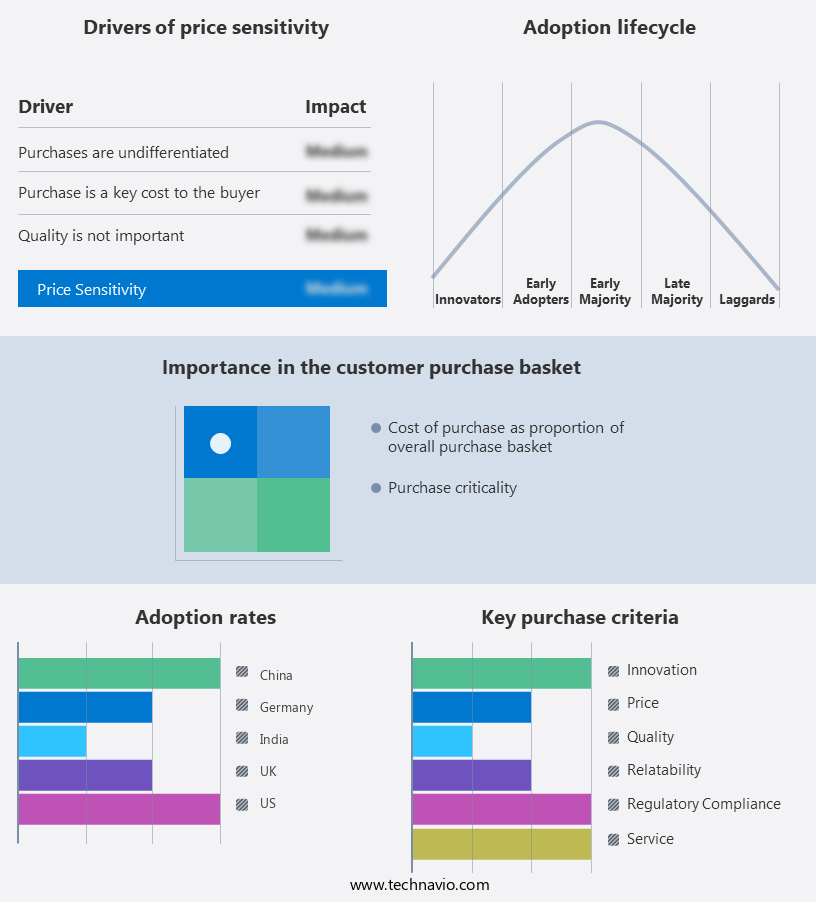
Exclusive Customer Landscape
The data acquisition (daq) system market forecasting report includes the adoption lifecycle of the market, covering from the innovator's stage to the laggard's stage. It focuses on adoption rates in different regions based on penetration. Furthermore, the data acquisition (daq) system market report also includes key purchase criteria and drivers of price sensitivity to help companies evaluate and develop their market growth analysis strategies.
Customer Landscape of Data Acquisition (DAQ) System Industry
Competitive Landscape & Market Insights
Companies are implementing various strategies, such as strategic alliances, data acquisition (daq) system market forecast, partnerships, mergers and acquisitions, geographical expansion, and product/service launches, to enhance their presence in the industry.
ADLINK Technology Inc. - This company specializes in data acquisition systems, providing versatile options including PCI express, USB, and compact PCI interfaces for various applications. Their systems enable efficient data transfer and processing, catering to diverse industries and research sectors.
The industry research and growth report includes detailed analyses of the competitive landscape of the market and information about key companies, including:
- ADLINK Technology Inc.
- ALTHEN GmbH
- AMETEK Inc.
- AstroNova Inc.
- Campbell Scientific Inc.
- Curtiss Wright Corp
- Dataforth Corp.
- Dewesoft d.o.o.
- Emerson Electric Co.
- Fortive Corp.
- Gantner Instruments Environment Solutions GmbH
- General Electric Co.
- Honeywell International Inc.
- imc Test and Measurement GmbH
- Keysight Technologies Inc.
- National Instruments Corp.
- Schneider Electric SE
- Siemens AG
- Spectris Plc
- Yokogawa Electric Corp.
Qualitative and quantitative analysis of companies has been conducted to help clients understand the wider business environment as well as the strengths and weaknesses of key industry players. Data is qualitatively analyzed to categorize companies as pure play, category-focused, industry-focused, and diversified; it is quantitatively analyzed to categorize companies as dominant, leading, strong, tentative, and weak.
Recent Development and News in Data Acquisition (DAQ) System Market
- In January 2024, National Instruments, a leading provider of data acquisition solutions, launched its new DAQSystemeX series, featuring advanced data processing capabilities and improved connectivity options (National Instruments Press Release). This expansion aimed to cater to the growing demand for real-time data processing in various industries.
- In March 2024, Honeywell International and Schneider Electric, two major players in the industrial automation sector, announced a strategic collaboration to integrate Honeywell's data acquisition hardware with Schneider Electric's EcoStruxure platform. This partnership aimed to offer enhanced data analytics and automation solutions to their combined customer base (Schneider Electric Press Release).
- In May 2024, ABB, a global leader in power and automation technologies, acquired General Electric's Intelligent Platforms business for approximately USD1.5 billion. This acquisition strengthened ABB's position in the data acquisition market by adding GE's extensive portfolio of DAQ products and solutions (ABB Press Release).
- In February 2025, the European Union passed the Digital Single Market Act, which includes provisions for interoperability and data portability, encouraging the adoption of open data acquisition systems across various industries. This regulatory development is expected to drive growth in the European DAQ system market (European Commission Press Release).
Dive into Technavio's robust research methodology, blending expert interviews, extensive data synthesis, and validated models for unparalleled Data Acquisition (DAQ) System Market insights. See full methodology.
|
Market Scope |
|
|
Report Coverage |
Details |
|
Page number |
211 |
|
Base year |
2024 |
|
Historic period |
2019-2023 |
|
Forecast period |
2025-2029 |
|
Growth momentum & CAGR |
Accelerate at a CAGR of 5.8% |
|
Market growth 2025-2029 |
USD 643 million |
|
Market structure |
Fragmented |
|
YoY growth 2024-2025(%) |
5.4 |
|
Key countries |
US, China, UK, Canada, Germany, Japan, India, France, Italy, and South Korea |
|
Competitive landscape |
Leading Companies, Market Positioning of Companies, Competitive Strategies, and Industry Risks |
Research Analyst Overview
- In the dynamic and ever-evolving realm of data acquisition (DAQ) systems, remote data acquisition has emerged as a significant trend. This approach allows for data collection from various sources, regardless of location, enhancing industrial automation systems' flexibility and efficiency. Noise reduction methods are essential in ensuring data integrity, as DAQ channels are susceptible to interference. Industrial automation systems increasingly rely on advanced synchronization techniques to mitigate these issues, enabling precise measurements and high-speed data transfer. Data acquisition boards and wireless data transmission technologies facilitate seamless integration with industrial applications, from process control to cloud data storage.
- System integration services play a crucial role in ensuring compatibility and optimal performance. Industrial DAQ systems require stringent calibration procedures and error correction codes to maintain data acquisition accuracy. Sampling rate adjustments and real-time data acquisition are essential for high-performance applications, while signal processing algorithms and data compression techniques optimize system efficiency. DAQ hardware interfaces and data logging software enable efficient data management, while precision measurements and high-speed data transfer are vital for various industries. Incorporating advanced triggering mechanisms, multiplexer configurations, and fieldbus communication further enhances the functionality of these systems. Data visualization tools and data security protocols are essential components of modern DAQ systems, ensuring seamless data analysis and secure data transmission.
- As the market continues to evolve, the focus on data acquisition accuracy, system performance metrics, and advanced analytics will remain key drivers for innovation.
What are the Key Data Covered in this Data Acquisition (DAQ) System Market Research and Growth Report?
-
What is the expected growth of the Data Acquisition (DAQ) System Market between 2025 and 2029?
-
USD 643 million, at a CAGR of 5.8%
-
-
What segmentation does the market report cover?
-
The report segmented by End-user (Power and energy, Automotive, Aerospace and defense, Education and research, and Others), Type (Hardware and Software), Speed (High speed and Low speed), and Geography (North America, Europe, APAC, Middle East and Africa, and South America)
-
-
Which regions are analyzed in the report?
-
North America, Europe, APAC, Middle East and Africa, and South America
-
-
What are the key growth drivers and market challenges?
-
Increasing demand for monitoring in end-user industries, Data acquisition system complexity and CAPEX costs
-
-
Who are the major players in the Data Acquisition (DAQ) System Market?
-
Key Companies ADLINK Technology Inc., ALTHEN GmbH, AMETEK Inc., AstroNova Inc., Campbell Scientific Inc., Curtiss Wright Corp, Dataforth Corp., Dewesoft d.o.o., Emerson Electric Co., Fortive Corp., Gantner Instruments Environment Solutions GmbH, General Electric Co., Honeywell International Inc., imc Test and Measurement GmbH, Keysight Technologies Inc., National Instruments Corp., Schneider Electric SE, Siemens AG, Spectris Plc, and Yokogawa Electric Corp.
-
Market Research Insights
- The market encompasses technologies and solutions designed for measuring, collecting, and managing data from various sources. DAQ systems are integral to industries such as manufacturing, healthcare, and research, where real-time, accurate data is essential. According to industry estimates, the global DAQ market size was valued at USD22.5 billion in 2020, with a projected compound annual growth rate (CAGR) of 6.3% from 2021 to 2028. Data acquisition accuracy and efficiency are critical factors influencing the market's growth. For instance, a high-performance DAQ system can achieve a signal-to-noise ratio of 60dB, ensuring precise data measurement.
- In contrast, an older or less efficient system may only manage a ratio of 40dB, leading to potential inaccuracies. Moreover, system reliability analysis, including fault tolerance mechanisms, jitter compensation, and power consumption analysis, plays a significant role in ensuring optimal performance and ROI for businesses.
We can help! Our analysts can customize this data acquisition (daq) system market research report to meet your requirements.
 RIA -
RIA - 
