Data Center And Network 3P Hardware Maintenance Service Market Analysis, Size, and Forecast 2026-2030: North America (US, Canada, and Mexico), Europe (Germany, UK, and France), APAC (China, Japan, and India), South America (Brazil and Argentina), Middle East and Africa (UAE, Saudi Arabia, and South Africa), and Rest of World (ROW)

Data Center And Network 3P Hardware Maintenance Service Market Analysis, Size, and Forecast 2026-2030:
North America (US, Canada, and Mexico), Europe (Germany, UK, and France), APAC (China, Japan, and India), South America (Brazil and Argentina), Middle East and Africa (UAE, Saudi Arabia, and South Africa), and Rest of World (ROW)

Published: Apr 2026 324 Pages SKU: IRTNTR74537

Market Overview at a Glance

$4.50 B
Market Opportunity
14.1%
CAGR 2025 - 2030
32%
Europe Growth
$2.68 B
Large enterprises segment 2024

Data Center And Network 3P Hardware Maintenance Service Market Size 2026-2030

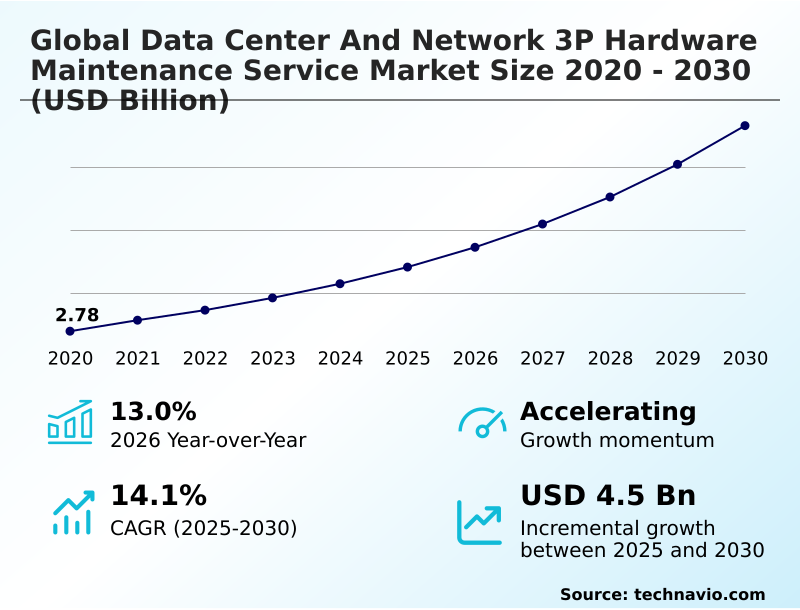
The data center and network 3p hardware maintenance service market size is valued to increase by USD 4.50 billion, at a CAGR of 14.1% from 2025 to 2030. Economic optimization and cost containment will drive the data center and network 3p hardware maintenance service market.

Major Market Trends & Insights

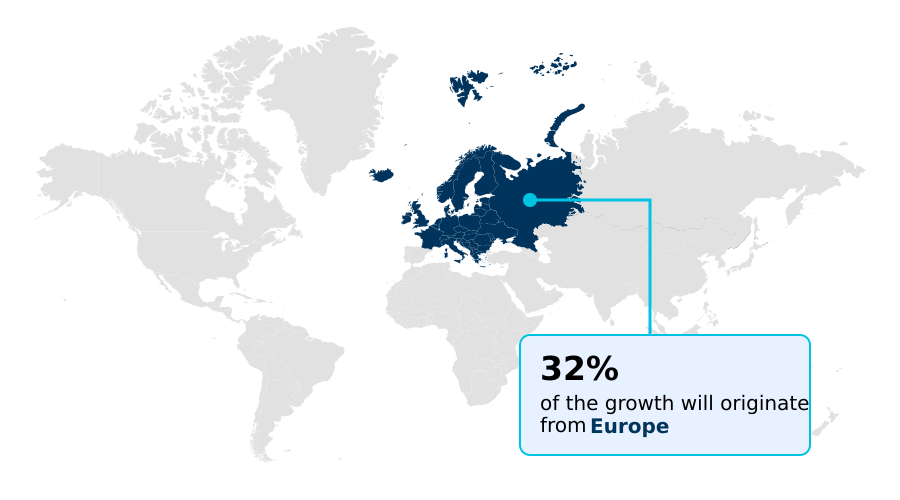
  • Europe dominated the market and accounted for a 32% growth during the forecast period.
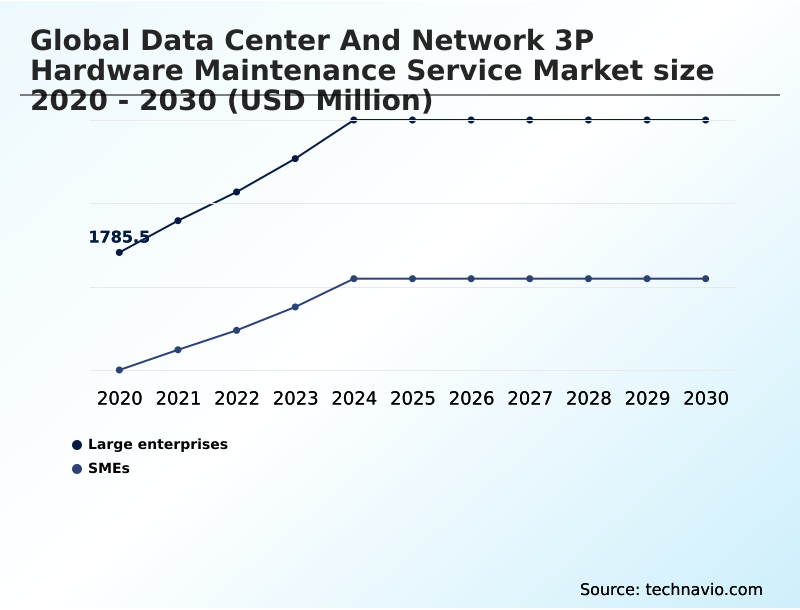
  • By Application - Large enterprises segment was valued at USD 2.68 billion in 2024
  • By Service Type - Break-fix maintenance segment accounted for the largest market revenue share in 2024

Market Size & Forecast

  • Market Opportunities: USD 6.54 billion
  • Market Future Opportunities: USD 4.50 billion
  • CAGR from 2025 to 2030 : 14.1%

Market Summary

  • The data center and network 3P hardware maintenance service market is expanding as organizations prioritize cost containment and operational efficiency. A core driver is the ability to achieve significant operational expenditure reduction by extending the life of existing assets, thereby avoiding costly and often premature hardware refresh cycles.
  • This strategy is particularly effective in complex, multi-vendor environments where managing separate OEM support contracts is both administratively burdensome and expensive. A key trend involves integrating AI-driven proactive diagnostics, which shifts the paradigm from reactive repairs to predictive hardware failure analysis.
  • For instance, a financial services firm can utilize remote infrastructure monitoring to identify a failing storage array component before it impacts transaction processing, ensuring uninterrupted service. However, the market faces challenges from OEM restrictive practices, such as firmware locks, and a growing scarcity of specialized technical talent capable of servicing emerging technologies like liquid cooling systems.

What will be the Size of the Data Center And Network 3P Hardware Maintenance Service Market during the forecast period?

Get Key Insights on Market Forecast (PDF) Request Free Sample

How is the Data Center And Network 3P Hardware Maintenance Service Market Segmented?

The data center and network 3p hardware maintenance service industry research report provides comprehensive data (region-wise segment analysis), with forecasts and estimates in "USD million" for the period 2026-2030, as well as historical data from 2020-2024 for the following segments.

  • Application
    • Large enterprises
    • SMEs
  • Service type
    • Break-fix maintenance
    • Preventive maintenance
    • Predictive maintenance
    • Proactive maintenance
    • Managed services
  • End-user
    • IT and telecom
    • Financial services
    • Healthcare
    • Government
    • Others
  • Geography
    • North America
      • US
      • Canada
      • Mexico
    • Europe
      • Germany
      • UK
      • France
    • APAC
      • China
      • Japan
      • India
    • South America
      • Brazil
      • Argentina
    • Middle East and Africa
      • UAE
      • Saudi Arabia
      • South Africa
    • Rest of World (ROW)

By Application Insights

The large enterprises segment is estimated to witness significant growth during the forecast period.

Large enterprises are pivotal to the data center and network 3P hardware maintenance service market, driven by the need for operational expenditure optimization.

These organizations leverage third-party hardware maintenance to manage expansive, multi-vendor hardware support environments, thereby enabling capital expenditure deferral. Adopting customized service level agreements allows for hardware refresh cycle avoidance, a key component of a sustainable IT operations strategy.

This approach aligns with enterprise IT strategic planning and simplifies IT procurement process simplification.

Firms utilizing these services report operational expenditure reductions often exceeding 40%, directly contributing to IT budget forecasting and stability and enhancing operational resilience by ensuring mission-critical systems availability for core business functions and digital transformation projects.

Request Free Sample

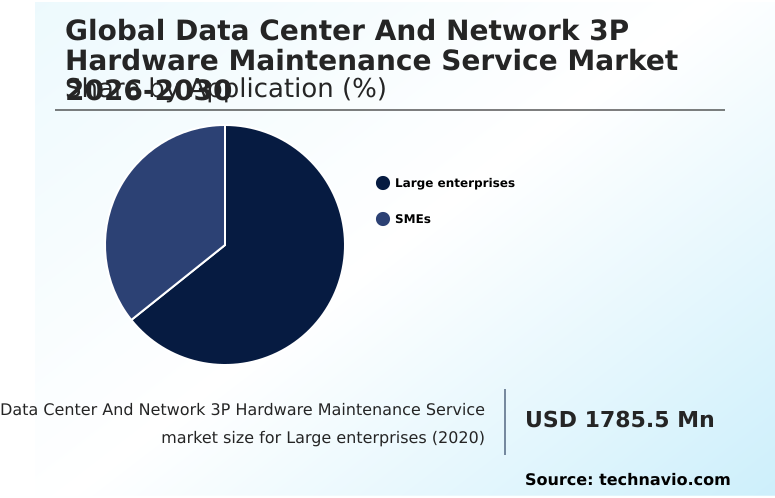
The Large enterprises segment was valued at USD 2.68 billion in 2024 and showed a gradual increase during the forecast period.

Request Free Sample

Regional Analysis

Europe is estimated to contribute 32% to the growth of the global market during the forecast period.Technavio’s analysts have elaborately explained the regional trends and drivers that shape the market during the forecast period.

See How Data Center And Network 3P Hardware Maintenance Service Market Demand is Rising in Europe Request Free Sample

The geographic landscape is defined by varying rates of adoption and maturity, driven by regional economic and regulatory factors.

In North America and Europe, there is a strong focus on data center power and cooling efficiency and adherence to data residency regulatory adherence. These regions exhibit high demand for managed IT infrastructure services.

The market in APAC is expanding rapidly, fueled by new data center builds and a growing need for post-warranty support contracts. Service providers are establishing a robust global service delivery network to offer consistent on-site engineering support.

In South America and the Middle East and Africa, the focus is on IT supply chain risk management and sourcing certified pre-owned hardware to manage costs.

This regional diversification requires providers to offer flexible support models tailored to local market needs.

Market Dynamics

Our researchers analyzed the data with 2025 as the base year, along with the key drivers, trends, and challenges. A holistic analysis of drivers will help companies refine their marketing strategies to gain a competitive advantage.

  • As organizations refine their IT infrastructure strategies, many are conducting a detailed cost comparison of OEM vs third-party maintenance. This analysis is central to developing data center hardware lifecycle management best practices and is a primary driver for adopting TPM.
  • Key strategies for extending server hardware lifespan are being implemented to maximize return on investment, which is particularly crucial for mission-critical hybrid cloud infrastructure. A core benefit is managing multi-vendor environments with a single contract, which significantly streamlines operations. This approach helps in mitigating supply chain risks for legacy IT parts, a growing concern for many IT leaders.
  • By using independent support, firms report a nearly 2 to 1 improvement in IT budget and resource allocation toward innovation versus maintenance. The ability to customize SLAs for global data center hardware ensures that support aligns perfectly with business requirements.
  • As part of a comprehensive strategy, organizations are also evaluating third-party maintenance provider capabilities for secure and compliant IT asset disposition services. Ultimately, the goal is to move beyond simple break-fix models toward a more strategic partnership that reduces IT operational expenses through independent support and helps in vendor lock-in avoidance strategies for enterprise IT.

What are the key market drivers leading to the rise in the adoption of Data Center And Network 3P Hardware Maintenance Service Industry?

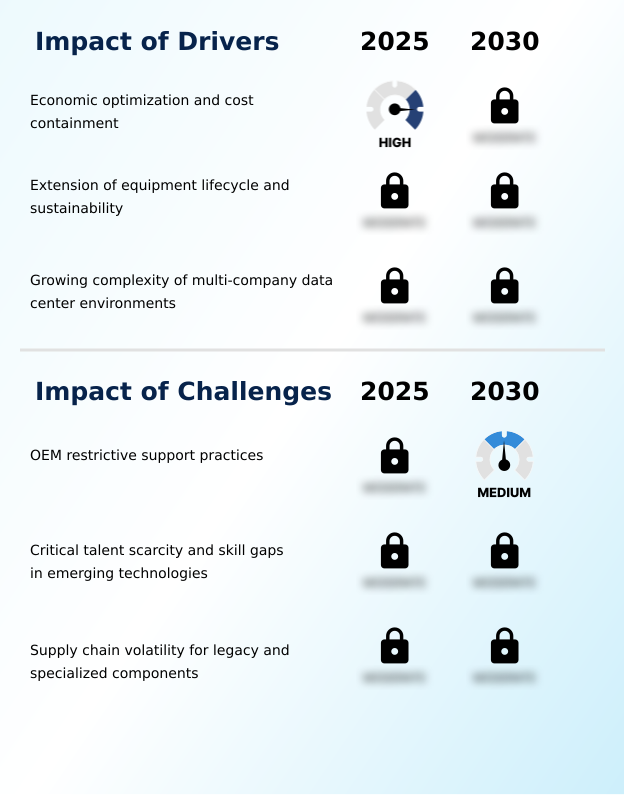
  • The key driver for the market is the focus on economic optimization and cost containment within enterprise IT budgets, compelling organizations to seek more efficient support solutions.

  • Economic imperatives are a primary driver, compelling organizations to seek alternatives to traditional support models for data center equipment support. The core benefit is operational expenditure optimization, achieved through post-warranty support contracts that offer significant savings.
  • This financial flexibility is critical for IT budget forecasting and stability. For example, by transitioning legacy hardware maintenance to a third-party provider, firms can reallocate up to 50% of their support budget to innovation.
  • This approach directly supports sustainable IT operations strategy by promoting the use of existing assets. Another key driver is the simplification of managing complex environments, where technical support service levels for multiple vendors are consolidated.
  • The use of a global service network ensures that support is available where needed, reducing logistical burdens and improving response times by an average of 25% for critical incidents.

What are the market trends shaping the Data Center And Network 3P Hardware Maintenance Service Industry?

  • A primary trend reshaping the market is the integration of AI-driven predictive maintenance and automated diagnostics, shifting service delivery from reactive models to proactive, intelligence-based workflows.

  • Key trends are reshaping service delivery, with a focus on technological innovation and operational efficiency. The adoption of IT infrastructure maintenance services is evolving with the integration of AI workload hardware infrastructure, which demands specialized high-performance computing support. This shift drives the need for advanced remote infrastructure monitoring and firmware and patch management capabilities.
  • Organizations are leveraging these trends to support their cloud migration strategy support, ensuring that legacy systems and new cloud environments coexist seamlessly. The industry's move toward a circular IT economy principles is also significant, with a focus on secure IT asset decommissioning.
  • This approach can improve asset lifecycle efficiency by up to 20%, while the use of proprietary diagnostic software has been shown to reduce mean time to resolution metrics by over 30%, showcasing a clear shift toward smarter, more sustainable operations.

What challenges does the Data Center And Network 3P Hardware Maintenance Service Industry face during its growth?

  • A key challenge affecting industry growth is the prevalence of restrictive support practices implemented by original equipment manufacturers (OEMs), which can limit service options for end-users.

  • The market faces persistent challenges, primarily from OEM practices and evolving technology. The cybersecurity of physical hardware is a significant concern, especially when proprietary diagnostic tools are not available. This forces providers to invest in developing their own solutions.
  • Another challenge is the need for IT asset lifecycle management to address the complexities of a software-defined data center management environment, which can increase support costs by 15% if not managed properly. Furthermore, specialized technical talent sourcing remains a hurdle, particularly for supporting edge computing hardware maintenance.
  • A shortage of qualified engineers can delay service delivery by up to 48 hours in some regions. Providers must also navigate the complexities of sovereign cloud infrastructure compliance, which adds a layer of regulatory burden to their service offerings and requires continuous investment in training and process refinement.

Exclusive Technavio Analysis on Customer Landscape

The data center and network 3p hardware maintenance service market forecasting report includes the adoption lifecycle of the market, covering from the innovator’s stage to the laggard’s stage. It focuses on adoption rates in different regions based on penetration. Furthermore, the data center and network 3p hardware maintenance service market report also includes key purchase criteria and drivers of price sensitivity to help companies evaluate and develop their market growth analysis strategies.

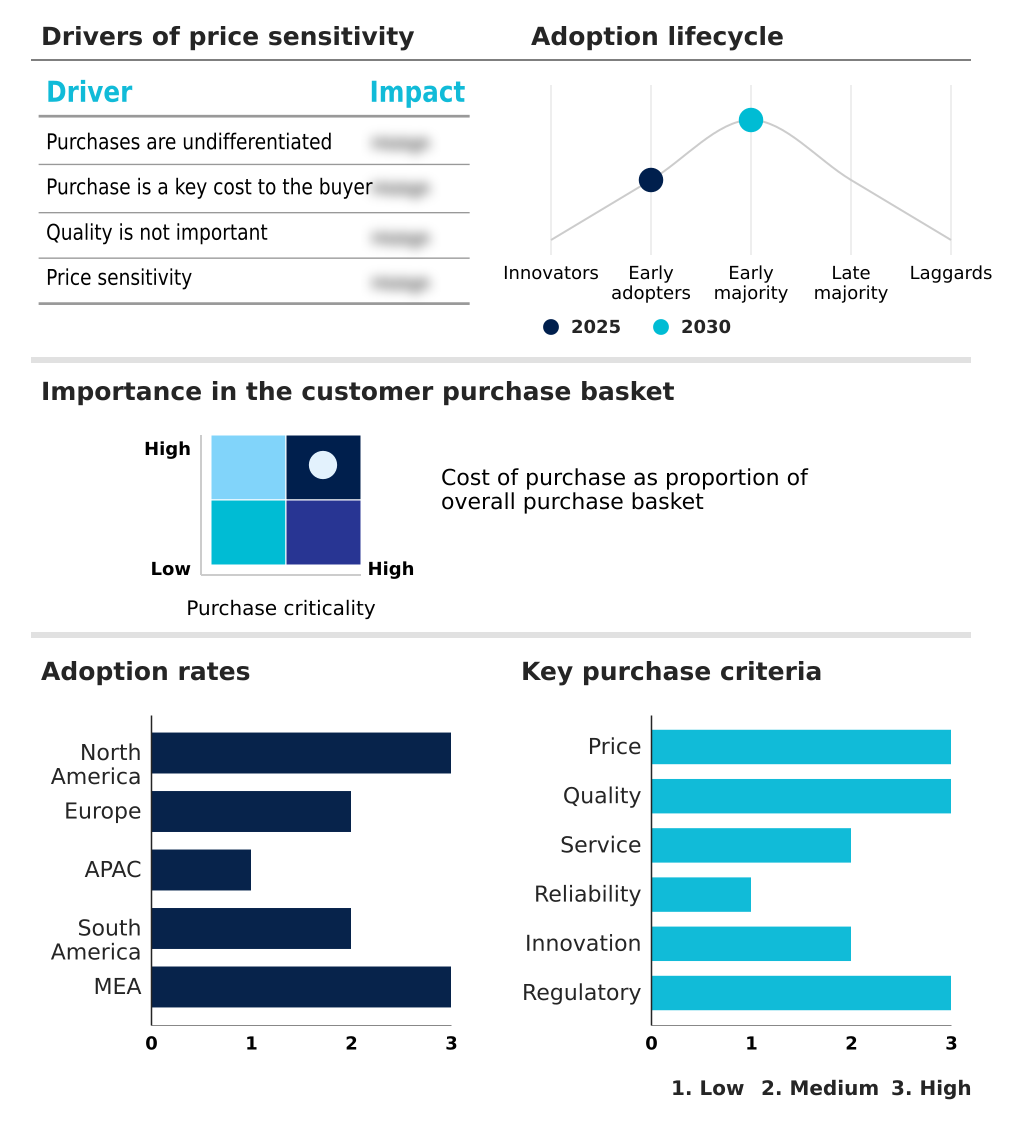
Customer Landscape of Data Center And Network 3P Hardware Maintenance Service Industry

Competitive Landscape

Companies are implementing various strategies, such as strategic alliances, data center and network 3p hardware maintenance service market forecast, partnerships, mergers and acquisitions, geographical expansion, and product/service launches, to enhance their presence in the industry.

Capgemini SE - Analysts observe offerings focused on proactive diagnostics and lifecycle management that optimize hardware performance and reduce downtime across multi-vendor environments.

The industry research and growth report includes detailed analyses of the competitive landscape of the market and information about key companies, including:

  • Capgemini SE
  • Cisco Systems Inc.
  • DataSpan Inc.
  • Dell Technologies Inc.
  • Equinix Inc.
  • Evernex
  • Fujitsu Ltd.
  • HCL Technologies Ltd.
  • Hewlett Packard Enterprise Co.
  • Hitachi Ltd.
  • Huawei Technologies Co. Ltd.
  • IBM Corp.
  • Intertek Group Plc
  • Kyndryl Inc.
  • Larsen and Toubro Ltd.
  • Lenovo Group Ltd.
  • Nokia Corp.
  • NTT Communications Corp.
  • Schneider Electric SE
  • Siemens AG

Qualitative and quantitative analysis of companies has been conducted to help clients understand the wider business environment as well as the strengths and weaknesses of key industry players. Data is qualitatively analyzed to categorize companies as pure play, category-focused, industry-focused, and diversified; it is quantitatively analyzed to categorize companies as dominant, leading, strong, tentative, and weak.

Recent Development and News in Data center and network 3p hardware maintenance service market

  • In May 2024, HCL Technologies Ltd announced a collaboration with Arm to develop custom silicon chips optimized for AI workloads in data center environments, including integrated hardware maintenance support.
  • In January 2025, Capgemini SE was recognized as a leader for its data center optimization and 3P hardware maintenance solutions, emphasizing energy efficiency and emissions reduction.
  • In April 2025, Fujitsu Ltd announced a collaboration with Supermicro Inc and Nidec Corporation to develop a comprehensive service for data center liquid cooling solutions, including operation and maintenance support.
  • In May 2025, Dell Technologies announced new software-driven, disaggregated infrastructure innovations aimed at transforming data center operations across hybrid environments with enhanced automation and security.

Dive into Technavio’s robust research methodology, blending expert interviews, extensive data synthesis, and validated models for unparalleled Data Center And Network 3P Hardware Maintenance Service Market insights. See full methodology.

Market Scope
Page number 324
Base year 2025
Historic period 2020-2024
Forecast period 2026-2030
Growth momentum & CAGR Accelerate at a CAGR of 14.1%
Market growth 2026-2030 USD 4496.7 million
Market structure Fragmented
YoY growth 2025-2026(%) 13.0%
Key countries US, Canada, Mexico, Germany, UK, France, The Netherlands, Italy, Switzerland, China, Japan, India, Australia, Singapore, South Korea, Brazil, Argentina, Chile, UAE, Saudi Arabia, South Africa, Israel and Turkey
Competitive landscape Leading Companies, Market Positioning of Companies, Competitive Strategies, and Industry Risks

Request Free Sample

Research Analyst Overview

  • The data center and network 3P hardware maintenance service market is defined by a strategic move toward extending IT hardware lifecycle extension, allowing enterprises to maximize asset value. This involves a focus on enterprise server maintenance, data storage array maintenance, and network switch and router support, often for equipment that has passed its official end-of-service-life support date.
  • Providers differentiate through global spare parts logistics and scheduled preventive maintenance, which are critical for data center uptime and reliability. A key trend is the adoption of predictive hardware failure analysis and proactive hardware diagnostics, which are boardroom-level concerns tied directly to business continuity. The integration of these technologies has been shown to reduce unplanned downtime by over 30%.
  • The market is also adapting to service high-density computing infrastructure through specialized liquid cooling system maintenance. This evolution requires global field engineering services with expertise in component-level hardware repair to execute break-fix repair services models efficiently, ensuring holistic infrastructure troubleshooting across complex systems.

What are the Key Data Covered in this Data Center And Network 3P Hardware Maintenance Service Market Research and Growth Report?

  • What is the expected growth of the Data Center And Network 3P Hardware Maintenance Service Market between 2026 and 2030?

    • USD 4.50 billion, at a CAGR of 14.1%

  • What segmentation does the market report cover?

    • The report is segmented by Application (Large enterprises, and SMEs), Service Type (Break-fix maintenance, Preventive maintenance, Predictive maintenance, Proactive maintenance, and Managed services), End-user (IT and telecom, Financial services, Healthcare, Government, and Others) and Geography (North America, Europe, APAC, South America, Middle East and Africa)

  • Which regions are analyzed in the report?

    • North America, Europe, APAC, South America and Middle East and Africa

  • What are the key growth drivers and market challenges?

    • Economic optimization and cost containment, OEM restrictive support practices

  • Who are the major players in the Data Center And Network 3P Hardware Maintenance Service Market?

    • Capgemini SE, Cisco Systems Inc., DataSpan Inc., Dell Technologies Inc., Equinix Inc., Evernex, Fujitsu Ltd., HCL Technologies Ltd., Hewlett Packard Enterprise Co., Hitachi Ltd., Huawei Technologies Co. Ltd., IBM Corp., Intertek Group Plc, Kyndryl Inc., Larsen and Toubro Ltd., Lenovo Group Ltd., Nokia Corp., NTT Communications Corp., Schneider Electric SE and Siemens AG

Market Research Insights

  • The market is shaped by a dynamic interplay of economic and technological factors. Organizations are increasingly adopting OEM support contract alternatives to achieve total cost of ownership reduction, a key metric in enterprise IT strategic planning. This shift supports data center consolidation projects and facilitates hybrid cloud infrastructure support.
  • Evidence suggests that a unified multi-vendor support contract can reduce administrative overhead by over 25%, while a focus on hardware performance tuning can improve asset utilization by 15%. This strategic approach to IT asset lifecycle management is critical for managing IT infrastructure complexity and is central to enabling broader digital transformation projects.
  • It provides the financial agility needed for new initiatives by optimizing budgets previously allocated to high-cost manufacturer support, enhancing overall operational resilience.

We can help! Our analysts can customize this data center and network 3p hardware maintenance service market research report to meet your requirements.

Get in touch

1. Executive Summary

1.1 Market overview

Executive Summary - Chart on Market Overview
Executive Summary - Data Table on Market Overview
Executive Summary - Chart on Global Market Characteristics
Executive Summary - Chart on Market by Geography
Executive Summary - Chart on Market Segmentation by Application
Executive Summary - Chart on Market Segmentation by Service Type
Executive Summary - Chart on Market Segmentation by End-user
Executive Summary - Chart on Incremental Growth
Executive Summary - Data Table on Incremental Growth
Executive Summary - Chart on Company Market Positioning

2. Technavio Analysis

2.1 Analysis of price sensitivity, lifecycle, customer purchase basket, adoption rates, and purchase criteria

2.2 Criticality of inputs and Factors of differentiation

Chart on Overview on criticality of inputs and factors of differentiation

2.3 Factors of disruption

Chart on Overview on factors of disruption

2.4 Impact of drivers and challenges

Chart on Impact of drivers and challenges in 2025 and 2030

3. Market Landscape

3.1 Market ecosystem

Chart on Parent Market
Data Table on - Parent Market

3.2 Market characteristics

Chart on Market characteristics analysis

3.3 Value chain analysis

Chart on Value chain analysis

4. Market Sizing

4.1 Market definition

Data Table on Offerings of companies included in the market definition

4.2 Market segment analysis

Market segments

4.3 Market size 2025

4.4 Market outlook: Forecast for 2025-2030

Chart on Global - Market size and forecast 2025-2030 ($ million)
Data Table on Global - Market size and forecast 2025-2030 ($ million)
Chart on Global Market: Year-over-year growth 2025-2030 (%)
Data Table on Global Market: Year-over-year growth 2025-2030 (%)

5. Historic Market Size

5.1 Global Data Center And Network 3P Hardware Maintenance Service Market 2020 - 2024

Historic Market Size - Data Table on Global Data Center And Network 3P Hardware Maintenance Service Market 2020 - 2024 ($ million)

5.2 Application segment analysis 2020 - 2024

Historic Market Size - Application Segment 2020 - 2024 ($ million)

5.3 Service Type segment analysis 2020 - 2024

Historic Market Size - Service Type Segment 2020 - 2024 ($ million)

5.4 End-user segment analysis 2020 - 2024

Historic Market Size - End-user Segment 2020 - 2024 ($ million)

5.5 Geography segment analysis 2020 - 2024

Historic Market Size - Geography Segment 2020 - 2024 ($ million)

5.6 Country segment analysis 2020 - 2024

Historic Market Size - Country Segment 2020 - 2024 ($ million)

6. Qualitative Analysis

6.1 Impact of AI on Global Data Center and Network 3P Hardware Maintenance Service Market

6.2 Impact of Geopolitical Conflict on Global Data Center and Network 3P Hardware Maintenance Service Market

7. Five Forces Analysis

7.1 Five forces summary

Five forces analysis - Comparison between 2025 and 2030

7.2 Bargaining power of buyers

Bargaining power of buyers - Impact of key factors 2025 and 2030

7.3 Bargaining power of suppliers

Bargaining power of suppliers - Impact of key factors in 2025 and 2030

7.4 Threat of new entrants

Threat of new entrants - Impact of key factors in 2025 and 2030

7.5 Threat of substitutes

Threat of substitutes - Impact of key factors in 2025 and 2030

7.6 Threat of rivalry

Threat of rivalry - Impact of key factors in 2025 and 2030

7.7 Market condition

Chart on Market condition - Five forces 2025 and 2030

8. Market Segmentation by Application

8.1 Market segments

Chart on Application - Market share 2025-2030 (%)
Data Table on Application - Market share 2025-2030 (%)

8.2 Comparison by Application

Chart on Comparison by Application
Data Table on Comparison by Application

8.3 Large enterprises - Market size and forecast 2025-2030

Chart on Large enterprises - Market size and forecast 2025-2030 ($ million)
Data Table on Large enterprises - Market size and forecast 2025-2030 ($ million)
Chart on Large enterprises - Year-over-year growth 2025-2030 (%)
Data Table on Large enterprises - Year-over-year growth 2025-2030 (%)

8.4 SMEs - Market size and forecast 2025-2030

Chart on SMEs - Market size and forecast 2025-2030 ($ million)
Data Table on SMEs - Market size and forecast 2025-2030 ($ million)
Chart on SMEs - Year-over-year growth 2025-2030 (%)
Data Table on SMEs - Year-over-year growth 2025-2030 (%)

8.5 Market opportunity by Application

Market opportunity by Application ($ million)
Data Table on Market opportunity by Application ($ million)

9. Market Segmentation by Service Type

9.1 Market segments

Chart on Service Type - Market share 2025-2030 (%)
Data Table on Service Type - Market share 2025-2030 (%)

9.2 Comparison by Service Type

Chart on Comparison by Service Type
Data Table on Comparison by Service Type

9.3 Break-fix maintenance - Market size and forecast 2025-2030

Chart on Break-fix maintenance - Market size and forecast 2025-2030 ($ million)
Data Table on Break-fix maintenance - Market size and forecast 2025-2030 ($ million)
Chart on Break-fix maintenance - Year-over-year growth 2025-2030 (%)
Data Table on Break-fix maintenance - Year-over-year growth 2025-2030 (%)

9.4 Preventive maintenance - Market size and forecast 2025-2030

Chart on Preventive maintenance - Market size and forecast 2025-2030 ($ million)
Data Table on Preventive maintenance - Market size and forecast 2025-2030 ($ million)
Chart on Preventive maintenance - Year-over-year growth 2025-2030 (%)
Data Table on Preventive maintenance - Year-over-year growth 2025-2030 (%)

9.5 Predictive maintenance - Market size and forecast 2025-2030

Chart on Predictive maintenance - Market size and forecast 2025-2030 ($ million)
Data Table on Predictive maintenance - Market size and forecast 2025-2030 ($ million)
Chart on Predictive maintenance - Year-over-year growth 2025-2030 (%)
Data Table on Predictive maintenance - Year-over-year growth 2025-2030 (%)

9.6 Proactive maintenance - Market size and forecast 2025-2030

Chart on Proactive maintenance - Market size and forecast 2025-2030 ($ million)
Data Table on Proactive maintenance - Market size and forecast 2025-2030 ($ million)
Chart on Proactive maintenance - Year-over-year growth 2025-2030 (%)
Data Table on Proactive maintenance - Year-over-year growth 2025-2030 (%)

9.7 Managed services - Market size and forecast 2025-2030

Chart on Managed services - Market size and forecast 2025-2030 ($ million)
Data Table on Managed services - Market size and forecast 2025-2030 ($ million)
Chart on Managed services - Year-over-year growth 2025-2030 (%)
Data Table on Managed services - Year-over-year growth 2025-2030 (%)

9.8 Market opportunity by Service Type

Market opportunity by Service Type ($ million)
Data Table on Market opportunity by Service Type ($ million)

10. Market Segmentation by End-user

10.1 Market segments

Chart on End-user - Market share 2025-2030 (%)
Data Table on End-user - Market share 2025-2030 (%)

10.2 Comparison by End-user

Chart on Comparison by End-user
Data Table on Comparison by End-user

10.3 IT and telecom - Market size and forecast 2025-2030

Chart on IT and telecom - Market size and forecast 2025-2030 ($ million)
Data Table on IT and telecom - Market size and forecast 2025-2030 ($ million)
Chart on IT and telecom - Year-over-year growth 2025-2030 (%)
Data Table on IT and telecom - Year-over-year growth 2025-2030 (%)

10.4 Financial services - Market size and forecast 2025-2030

Chart on Financial services - Market size and forecast 2025-2030 ($ million)
Data Table on Financial services - Market size and forecast 2025-2030 ($ million)
Chart on Financial services - Year-over-year growth 2025-2030 (%)
Data Table on Financial services - Year-over-year growth 2025-2030 (%)

10.5 Healthcare - Market size and forecast 2025-2030

Chart on Healthcare - Market size and forecast 2025-2030 ($ million)
Data Table on Healthcare - Market size and forecast 2025-2030 ($ million)
Chart on Healthcare - Year-over-year growth 2025-2030 (%)
Data Table on Healthcare - Year-over-year growth 2025-2030 (%)

10.6 Government - Market size and forecast 2025-2030

Chart on Government - Market size and forecast 2025-2030 ($ million)
Data Table on Government - Market size and forecast 2025-2030 ($ million)
Chart on Government - Year-over-year growth 2025-2030 (%)
Data Table on Government - Year-over-year growth 2025-2030 (%)

10.7 Others - Market size and forecast 2025-2030

Chart on Others - Market size and forecast 2025-2030 ($ million)
Data Table on Others - Market size and forecast 2025-2030 ($ million)
Chart on Others - Year-over-year growth 2025-2030 (%)
Data Table on Others - Year-over-year growth 2025-2030 (%)

10.8 Market opportunity by End-user

Market opportunity by End-user ($ million)
Data Table on Market opportunity by End-user ($ million)

11. Customer Landscape

11.1 Customer landscape overview

Analysis of price sensitivity, lifecycle, customer purchase basket, adoption rates, and purchase criteria

12. Geographic Landscape

12.1 Geographic segmentation

Chart on Market share by geography 2025-2030 (%)
Data Table on Market share by geography 2025-2030 (%)

12.2 Geographic comparison

Chart on Geographic comparison
Data Table on Geographic comparison

12.3 North America - Market size and forecast 2025-2030

Chart on North America - Market size and forecast 2025-2030 ($ million)
Data Table on North America - Market size and forecast 2025-2030 ($ million)
Chart on North America - Year-over-year growth 2025-2030 (%)
Data Table on North America - Year-over-year growth 2025-2030 (%)
Chart on Regional Comparison - North America
Data Table on Regional Comparison - North America

12.3.1 US - Market size and forecast 2025-2030

Chart on US - Market size and forecast 2025-2030 ($ million)
Data Table on US - Market size and forecast 2025-2030 ($ million)
Chart on US - Year-over-year growth 2025-2030 (%)
Data Table on US - Year-over-year growth 2025-2030 (%)

12.3.2 Canada - Market size and forecast 2025-2030

Chart on Canada - Market size and forecast 2025-2030 ($ million)
Data Table on Canada - Market size and forecast 2025-2030 ($ million)
Chart on Canada - Year-over-year growth 2025-2030 (%)
Data Table on Canada - Year-over-year growth 2025-2030 (%)

12.3.3 Mexico - Market size and forecast 2025-2030

Chart on Mexico - Market size and forecast 2025-2030 ($ million)
Data Table on Mexico - Market size and forecast 2025-2030 ($ million)
Chart on Mexico - Year-over-year growth 2025-2030 (%)
Data Table on Mexico - Year-over-year growth 2025-2030 (%)

12.4 Europe - Market size and forecast 2025-2030

Chart on Europe - Market size and forecast 2025-2030 ($ million)
Data Table on Europe - Market size and forecast 2025-2030 ($ million)
Chart on Europe - Year-over-year growth 2025-2030 (%)
Data Table on Europe - Year-over-year growth 2025-2030 (%)
Chart on Regional Comparison - Europe
Data Table on Regional Comparison - Europe

12.4.1 Germany - Market size and forecast 2025-2030

Chart on Germany - Market size and forecast 2025-2030 ($ million)
Data Table on Germany - Market size and forecast 2025-2030 ($ million)
Chart on Germany - Year-over-year growth 2025-2030 (%)
Data Table on Germany - Year-over-year growth 2025-2030 (%)

12.4.2 UK - Market size and forecast 2025-2030

Chart on UK - Market size and forecast 2025-2030 ($ million)
Data Table on UK - Market size and forecast 2025-2030 ($ million)
Chart on UK - Year-over-year growth 2025-2030 (%)
Data Table on UK - Year-over-year growth 2025-2030 (%)

12.4.3 France - Market size and forecast 2025-2030

Chart on France - Market size and forecast 2025-2030 ($ million)
Data Table on France - Market size and forecast 2025-2030 ($ million)
Chart on France - Year-over-year growth 2025-2030 (%)
Data Table on France - Year-over-year growth 2025-2030 (%)

12.4.4 The Netherlands - Market size and forecast 2025-2030

Chart on The Netherlands - Market size and forecast 2025-2030 ($ million)
Data Table on The Netherlands - Market size and forecast 2025-2030 ($ million)
Chart on The Netherlands - Year-over-year growth 2025-2030 (%)
Data Table on The Netherlands - Year-over-year growth 2025-2030 (%)

12.4.5 Italy - Market size and forecast 2025-2030

Chart on Italy - Market size and forecast 2025-2030 ($ million)
Data Table on Italy - Market size and forecast 2025-2030 ($ million)
Chart on Italy - Year-over-year growth 2025-2030 (%)
Data Table on Italy - Year-over-year growth 2025-2030 (%)

12.4.6 Switzerland - Market size and forecast 2025-2030

Chart on Switzerland - Market size and forecast 2025-2030 ($ million)
Data Table on Switzerland - Market size and forecast 2025-2030 ($ million)
Chart on Switzerland - Year-over-year growth 2025-2030 (%)
Data Table on Switzerland - Year-over-year growth 2025-2030 (%)

12.5 APAC - Market size and forecast 2025-2030

Chart on APAC - Market size and forecast 2025-2030 ($ million)
Data Table on APAC - Market size and forecast 2025-2030 ($ million)
Chart on APAC - Year-over-year growth 2025-2030 (%)
Data Table on APAC - Year-over-year growth 2025-2030 (%)
Chart on Regional Comparison - APAC
Data Table on Regional Comparison - APAC

12.5.1 China - Market size and forecast 2025-2030

Chart on China - Market size and forecast 2025-2030 ($ million)
Data Table on China - Market size and forecast 2025-2030 ($ million)
Chart on China - Year-over-year growth 2025-2030 (%)
Data Table on China - Year-over-year growth 2025-2030 (%)

12.5.2 Japan - Market size and forecast 2025-2030

Chart on Japan - Market size and forecast 2025-2030 ($ million)
Data Table on Japan - Market size and forecast 2025-2030 ($ million)
Chart on Japan - Year-over-year growth 2025-2030 (%)
Data Table on Japan - Year-over-year growth 2025-2030 (%)

12.5.3 India - Market size and forecast 2025-2030

Chart on India - Market size and forecast 2025-2030 ($ million)
Data Table on India - Market size and forecast 2025-2030 ($ million)
Chart on India - Year-over-year growth 2025-2030 (%)
Data Table on India - Year-over-year growth 2025-2030 (%)

12.5.4 Australia - Market size and forecast 2025-2030

Chart on Australia - Market size and forecast 2025-2030 ($ million)
Data Table on Australia - Market size and forecast 2025-2030 ($ million)
Chart on Australia - Year-over-year growth 2025-2030 (%)
Data Table on Australia - Year-over-year growth 2025-2030 (%)

12.5.5 Singapore - Market size and forecast 2025-2030

Chart on Singapore - Market size and forecast 2025-2030 ($ million)
Data Table on Singapore - Market size and forecast 2025-2030 ($ million)
Chart on Singapore - Year-over-year growth 2025-2030 (%)
Data Table on Singapore - Year-over-year growth 2025-2030 (%)

12.5.6 South Korea - Market size and forecast 2025-2030

Chart on South Korea - Market size and forecast 2025-2030 ($ million)
Data Table on South Korea - Market size and forecast 2025-2030 ($ million)
Chart on South Korea - Year-over-year growth 2025-2030 (%)
Data Table on South Korea - Year-over-year growth 2025-2030 (%)

12.6 South America - Market size and forecast 2025-2030

Chart on South America - Market size and forecast 2025-2030 ($ million)
Data Table on South America - Market size and forecast 2025-2030 ($ million)
Chart on South America - Year-over-year growth 2025-2030 (%)
Data Table on South America - Year-over-year growth 2025-2030 (%)
Chart on Regional Comparison - South America
Data Table on Regional Comparison - South America

12.6.1 Brazil - Market size and forecast 2025-2030

Chart on Brazil - Market size and forecast 2025-2030 ($ million)
Data Table on Brazil - Market size and forecast 2025-2030 ($ million)
Chart on Brazil - Year-over-year growth 2025-2030 (%)
Data Table on Brazil - Year-over-year growth 2025-2030 (%)

12.6.2 Argentina - Market size and forecast 2025-2030

Chart on Argentina - Market size and forecast 2025-2030 ($ million)
Data Table on Argentina - Market size and forecast 2025-2030 ($ million)
Chart on Argentina - Year-over-year growth 2025-2030 (%)
Data Table on Argentina - Year-over-year growth 2025-2030 (%)

12.6.3 Chile - Market size and forecast 2025-2030

Chart on Chile - Market size and forecast 2025-2030 ($ million)
Data Table on Chile - Market size and forecast 2025-2030 ($ million)
Chart on Chile - Year-over-year growth 2025-2030 (%)
Data Table on Chile - Year-over-year growth 2025-2030 (%)

12.7 Middle East and Africa - Market size and forecast 2025-2030

Chart on Middle East and Africa - Market size and forecast 2025-2030 ($ million)
Data Table on Middle East and Africa - Market size and forecast 2025-2030 ($ million)
Chart on Middle East and Africa - Year-over-year growth 2025-2030 (%)
Data Table on Middle East and Africa - Year-over-year growth 2025-2030 (%)
Chart on Regional Comparison - Middle East and Africa
Data Table on Regional Comparison - Middle East and Africa

12.7.1 UAE - Market size and forecast 2025-2030

Chart on UAE - Market size and forecast 2025-2030 ($ million)
Data Table on UAE - Market size and forecast 2025-2030 ($ million)
Chart on UAE - Year-over-year growth 2025-2030 (%)
Data Table on UAE - Year-over-year growth 2025-2030 (%)

12.7.2 Saudi Arabia - Market size and forecast 2025-2030

Chart on Saudi Arabia - Market size and forecast 2025-2030 ($ million)
Data Table on Saudi Arabia - Market size and forecast 2025-2030 ($ million)
Chart on Saudi Arabia - Year-over-year growth 2025-2030 (%)
Data Table on Saudi Arabia - Year-over-year growth 2025-2030 (%)

12.7.3 South Africa - Market size and forecast 2025-2030

Chart on South Africa - Market size and forecast 2025-2030 ($ million)
Data Table on South Africa - Market size and forecast 2025-2030 ($ million)
Chart on South Africa - Year-over-year growth 2025-2030 (%)
Data Table on South Africa - Year-over-year growth 2025-2030 (%)

12.7.4 Israel - Market size and forecast 2025-2030

Chart on Israel - Market size and forecast 2025-2030 ($ million)
Data Table on Israel - Market size and forecast 2025-2030 ($ million)
Chart on Israel - Year-over-year growth 2025-2030 (%)
Data Table on Israel - Year-over-year growth 2025-2030 (%)

12.7.5 Turkey - Market size and forecast 2025-2030

Chart on Turkey - Market size and forecast 2025-2030 ($ million)
Data Table on Turkey - Market size and forecast 2025-2030 ($ million)
Chart on Turkey - Year-over-year growth 2025-2030 (%)
Data Table on Turkey - Year-over-year growth 2025-2030 (%)

12.8 Market opportunity by geography

Market opportunity by geography ($ million)
Data Tables on Market opportunity by geography ($ million)

13. Drivers, Challenges, and Opportunity

13.1 Market drivers

Economic optimization and cost containment
Extension of equipment lifecycle and sustainability
Growing complexity of multi-company data center environments

13.2 Market challenges

OEM restrictive support practices
Critical talent scarcity and skill gaps in emerging technologies
Supply chain volatility for legacy and specialized components

13.3 Impact of drivers and challenges

Impact of drivers and challenges in 2025 and 2030

13.4 Market opportunities

Integration of AI-driven predictive maintenance and automated diagnostics
Transition toward liquid cooling and high-density infrastructure support
Rise of sovereign AI clouds and regionalized maintenance hubs

14. Competitive Landscape

14.1 Overview

14.2

Overview on criticality of inputs and factors of differentiation

14.3 Landscape disruption

Overview on factors of disruption

14.4 Industry risks

Impact of key risks on business

15. Competitive Analysis

15.1 Companies profiled

Companies covered

15.2 Company ranking index

15.3 Market positioning of companies

Matrix on companies position and classification

15.4 Capgemini SE

Capgemini SE - Overview
Capgemini SE - Business segments
Capgemini SE - Key news
Capgemini SE - Key offerings
Capgemini SE - Segment focus
SWOT

15.5 Cisco Systems Inc.

Cisco Systems Inc. - Overview
Cisco Systems Inc. - Business segments
Cisco Systems Inc. - Key news
Cisco Systems Inc. - Key offerings
Cisco Systems Inc. - Segment focus
SWOT

15.6 Dell Technologies Inc.

Dell Technologies Inc. - Overview
Dell Technologies Inc. - Business segments
Dell Technologies Inc. - Key news
Dell Technologies Inc. - Key offerings
Dell Technologies Inc. - Segment focus
SWOT

15.7 Fujitsu Ltd.

Fujitsu Ltd. - Overview
Fujitsu Ltd. - Business segments
Fujitsu Ltd. - Key offerings
Fujitsu Ltd. - Segment focus
SWOT

15.8 HCL Technologies Ltd.

HCL Technologies Ltd. - Overview
HCL Technologies Ltd. - Business segments
HCL Technologies Ltd. - Key offerings
HCL Technologies Ltd. - Segment focus
SWOT

15.9 Hewlett Packard Enterprise Co.

Hewlett Packard Enterprise Co. - Overview
Hewlett Packard Enterprise Co. - Business segments
Hewlett Packard Enterprise Co. - Key news
Hewlett Packard Enterprise Co. - Key offerings
Hewlett Packard Enterprise Co. - Segment focus
SWOT

15.10 Hitachi Ltd.

Hitachi Ltd. - Overview
Hitachi Ltd. - Business segments
Hitachi Ltd. - Key offerings
Hitachi Ltd. - Segment focus
SWOT

15.11 Huawei Technologies Co. Ltd.

Huawei Technologies Co. Ltd. - Overview
Huawei Technologies Co. Ltd. - Product / Service
Huawei Technologies Co. Ltd. - Key offerings
SWOT

15.12 IBM Corp.

IBM Corp. - Overview
IBM Corp. - Business segments
IBM Corp. - Key news
IBM Corp. - Key offerings
IBM Corp. - Segment focus
SWOT

15.13 Larsen and Toubro Ltd.

Larsen and Toubro Ltd. - Overview
Larsen and Toubro Ltd. - Business segments
Larsen and Toubro Ltd. - Key offerings
Larsen and Toubro Ltd. - Segment focus
SWOT

15.14 Lenovo Group Ltd.

Lenovo Group Ltd. - Overview
Lenovo Group Ltd. - Business segments
Lenovo Group Ltd. - Key offerings
Lenovo Group Ltd. - Segment focus
SWOT

15.15 Nokia Corp.

Nokia Corp. - Overview
Nokia Corp. - Business segments
Nokia Corp. - Key offerings
Nokia Corp. - Segment focus
SWOT

15.16 NTT Communications Corp.

NTT Communications Corp. - Overview
NTT Communications Corp. - Product / Service
NTT Communications Corp. - Key offerings
SWOT

15.17 Schneider Electric SE

Schneider Electric SE - Overview
Schneider Electric SE - Business segments
Schneider Electric SE - Key news
Schneider Electric SE - Key offerings
Schneider Electric SE - Segment focus
SWOT

15.18 Siemens AG

Siemens AG - Overview
Siemens AG - Business segments
Siemens AG - Key news
Siemens AG - Key offerings
Siemens AG - Segment focus
SWOT

16. Appendix

16.1 Scope of the report

Market definition
Objectives
Notes and caveats

16.2 Inclusions and exclusions checklist

Inclusions checklist
Exclusions checklist

16.3 Currency conversion rates for US$

16.4 Research methodology

16.5 Data procurement

Information sources

16.6 Data validation

16.7 Validation techniques employed for market sizing

16.8 Data synthesis

16.9 360 degree market analysis

16.10 List of abbreviations

Research Methodology

Technavio presents a detailed picture of the market by way of study, synthesis, and summation of data from multiple sources. The analysts have presented the various facets of the market with a particular focus on identifying the key industry influencers. The data thus presented is comprehensive, reliable, and the result of extensive research, both primary and secondary.

INFORMATION SOURCES

Primary sources

  • Manufacturers and suppliers
  • Channel partners
  • Industry experts
  • Strategic decision makers

Secondary sources

  • Industry journals and periodicals
  • Government data
  • Financial reports of key industry players
  • Historical data
  • Press releases

DATA ANALYSIS

Data Synthesis

  • Collation of data
  • Estimation of key figures
  • Analysis of derived insights

Data Validation

  • Triangulation with data models
  • Reference against proprietary databases
  • Corroboration with industry experts

REPORT WRITING

Qualitative

  • Market drivers
  • Market challenges
  • Market trends
  • Five forces analysis

Quantitative

  • Market size and forecast
  • Market segmentation
  • Geographical insights
  • Competitive landscape

Interested in this report?

Get your sample now to see our research methodology and insights!

Download Now

Frequently Asked Questions

Data Center And Network 3P Hardware Maintenance Service market growth will increase by USD 4496.7 million during 2026-2030.

The Data Center And Network 3P Hardware Maintenance Service market is expected to grow at a CAGR of 14.1% during 2026-2030.

Data Center And Network 3P Hardware Maintenance Service market is segmented by Application (Large enterprises, SMEs) Service type (Break-fix maintenance, Preventive maintenance, Predictive maintenance, Proactive maintenance, Managed services) End-user (IT and telecom, Financial services, Healthcare, Government, Others)

Capgemini SE, Cisco Systems Inc., DataSpan Inc., Dell Technologies Inc., Equinix Inc., Evernex, Fujitsu Ltd., HCL Technologies Ltd., Hewlett Packard Enterprise Co., Hitachi Ltd., Huawei Technologies Co. Ltd., IBM Corp., Intertek Group Plc, Kyndryl Inc., Larsen and Toubro Ltd., Lenovo Group Ltd., Nokia Corp., NTT Communications Corp., Schneider Electric SE, Siemens AG are a few of the key vendors in the Data Center And Network 3P Hardware Maintenance Service market.

Europe will register the highest growth rate of 32% among the other regions. Therefore, the Data Center And Network 3P Hardware Maintenance Service market in Europe is expected to garner significant business opportunities for the vendors during the forecast period.

US, Canada, Mexico, Germany, UK, France, The Netherlands, Italy, Switzerland, China, Japan, India, Australia, Singapore, South Korea, Brazil, Argentina, Chile, UAE, Saudi Arabia, South Africa, Israel, Turkey

  • Economic optimization and cost containment is the driving factor this market.

The Data Center And Network 3P Hardware Maintenance Service market vendors should focus on grabbing business opportunities from the Application segment as it accounted for the largest market share in the base year.
RIA - Research AI Assistant
Ask RIA