Data Center UPS Market Size 2025-2029
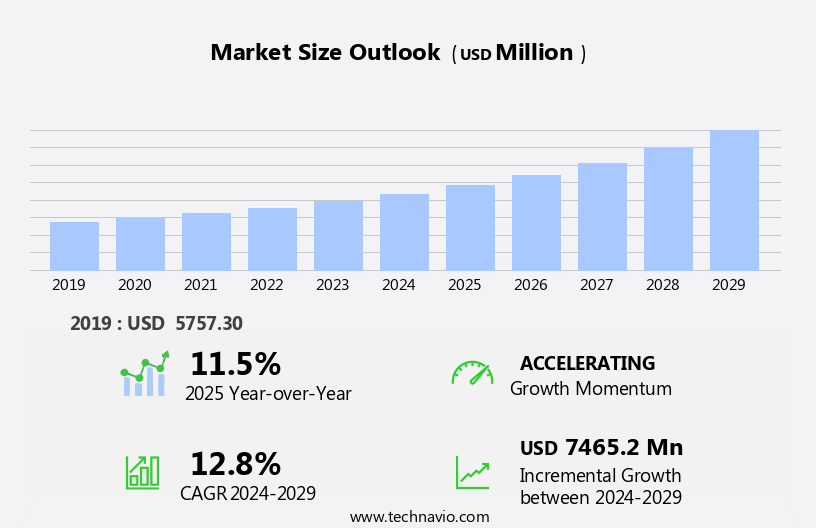
The data center UPS market size is forecast to increase by USD 7.47 billion at a CAGR of 12.8% between 2024 and 2029.
	- The market is experiencing significant growth, driven by the increasing adoption of modular UPS systems and the use of lithium ion UPS batteries. Modular UPS systems offer scalability and flexibility, making them an attractive option for data centers seeking to accommodate expanding power requirements. Meanwhile, lithium-ion UPS batteries provide longer runtime and faster recharge times compared to traditional lead-acid batteries, enhancing data center resilience and reliability. However, the market is not without challenges. UPS battery failure remains a persistent issue, with aging batteries posing a significant risk to data center operations. As such, data center operators must prioritize regular maintenance and replacement of batteries to mitigate potential downtime and associated costs. Additionally, the increasing complexity of data center infrastructure and the need for energy efficiency continue to shape the strategic landscape of the market. Companies seeking to capitalize on these opportunities must stay abreast of emerging trends and invest in innovative solutions to meet evolving power management requirements.
What will be the Size of the Market during the forecast period?

 Request Free Sample
	- The market plays a crucial role in ensuring uninterrupted power supply for data centers, mitigating the risks and costs associated with power interruptions. With the digital age's continued expansion and the increasing adoption of edge computing, data center reliability has become a paramount concern for critical facility customers. As remote working culture gains traction and cloud infrastructure becomes more prevalent, the demand for backup power solutions has increased. Power usage and operating costs, coupled with the need for carbon footprint reduction, have driven the market's growth. UPS systems provide essential power backup during power outages, ensuring business continuity and minimizing downtime.
- Remote monitoring and control solutions enable real-time management and maintenance, further enhancing the market's appeal. The evolving economies and increasing IT spending worldwide have contributed to the market's expansion. UPS systems are integral to maintaining the integrity of digital infrastructure, making them indispensable in today's interconnected world. The UPS market is poised for continued growth as businesses prioritize uninterrupted power and data center reliability.
How is this Data Center UPS Industry segmented?
The data center ups industry research report provides comprehensive data (region-wise segment analysis), with forecasts and estimates in "USD billion" for the period 2025-2029, as well as historical data from 2019-2023 for the following segments.
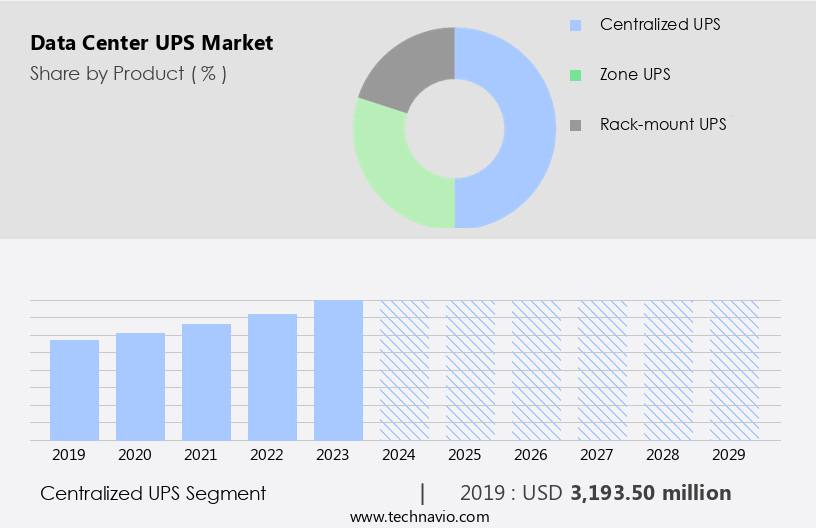
	- Product
	
		- Centralized UPS
- Zone UPS
- Rack-mount UPS
 
- Application
	
		- Tier 3 data center
- Tier 1 and 2 data center
- Tier 4 data center
 
- Battery Type
	
		- VRLA batteries
- Lithium-ion batteries
- Other batteries
 
- Geography
	
		- North America
		
		
- Europe
		
			- France
- Germany
- Italy
- The Netherlands
- UK
 
- APAC
		
		
- South America
		
		
- Middle East and Africa


By Product Insights
The centralized UPS segment is estimated to witness significant growth during the forecast period. Data centers require uninterrupted power supply to ensure the reliability of critical digital infrastructure, particularly in the context of increasing power interruptions and the remote working culture. Centralized UPS systems, capable of powering entire data center floor spaces with a capacity exceeding 1,000 kVA, remain popular for larger facilities. However, these systems come with the disadvantage of extensive cabling to every rack and IT load. To address this issue, modular UPS systems and independent power modules have gained traction, offering enhanced efficiency, improved reliability, and energy-saving modes. Edge computing and cloud infrastructure have further complicated power requirements, necessitating scalability solutions and backup energy.

Get a glance at the market report of share of various segments Request Free Sample
The centralized UPS segment was valued at USD 3.19 billion in 2019 and showed a gradual increase during the forecast period.
Regional Analysis
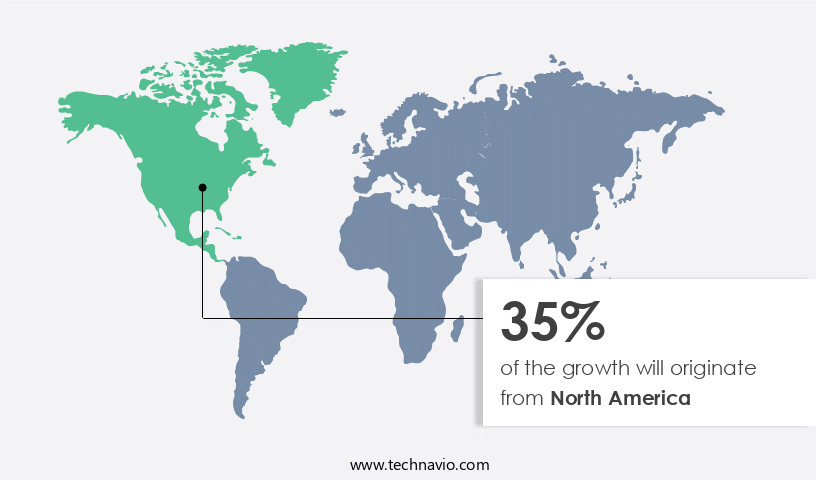
North America is estimated to contribute 35% to the growth of the global market during the forecast period. Technavio's analysts have elaborately explained the regional trends and drivers that shape the market during the forecast period.

For more insights on the market size of various regions, Request Free Sample
The market in North America is primarily driven by the US, which accounts for approximately 80% of the revenue in the region. The construction of new data centers is on the rise in this country, with significant contributions coming from communication service providers (CSPs) and colocation providers. The increasing demand for data centers and servers is the primary reason for the market growth. For instance, Schneider Electric, JLL, and Lumen Technologies collaborated in October 2023 to offer modular data centers to clients across the US. Power interruptions and utility outages pose a significant challenge to data center reliability, necessitating the adoption of uninterrupted power supply (UPS) systems.
Market Dynamics
Our researchers analyzed the data with 2024 as the base year, along with the key drivers, trends, and challenges. A holistic analysis of drivers will help companies refine their marketing strategies to gain a competitive advantage.
What are the key market drivers leading to the rise in the adoption of Data Center UPS Industry?
	- Increase in adoption of modular UPS systems is the key driver of the market. The markets encompass a range of systems, including centralized, zone, and rack-mount UPS solutions. Centralized UPS systems offer larger capacities, while rack-mount UPS systems are modular and come in lower capacities, such as 20 kVA. These modular systems are increasingly adopted due to concerns over power fluctuations and outages. 
- The modular approach offers flexibility to scale capacity as needed and reduces maintenance costs. Data center operators can initially size their UPS systems and then expand as their IT load grows. This approach is particularly beneficial for enterprises seeking to optimize their power management and mitigate potential downtime.
What are the market trends shaping the Data Center UPS Industry?
	- Use of lithium-ion UPS systems is the upcoming market trend. Data centers rely on Uninterruptible Power Supply (UPS) systems to ensure uninterrupted power delivery and prevent downtime during power outages. The most common type of batteries used in UPS systems is Valve-Regulated Lead-Acid (VRLA), also known as sealed lead-acid batteries.
- These batteries are preferred due to their reliability and cost-effectiveness. However, their maintenance is a significant challenge for data center operators, as they require regular monitoring and replacement every three to five years. An alternative to lead-acid batteries is flywheel-based UPS systems. While these systems offer advantages such as a smaller footprint and lower environmental impact, they have a lower backup time compared to lead-acid batteries.
What challenges does the Data Center UPS Industry face during its growth?
	- UPS battery failure is a key challenge affecting the industry growth. Data centers face significant challenges with UPS battery failures, accounting for approximately 55% of downtime incidents. Power fluctuations are common, making utility power supply a reliance for operators. Most power outages last only a few seconds, but the consequences can be severe.
- A single hour of downtime can cost data center operators up to USD 500,000. In a notable instance, Salesforce experienced a global outage in November 2024, affecting users across five data centers. Proper UPS battery maintenance is essential, especially during prolonged power outages, to minimize downtime and associated financial losses.
Exclusive Customer Landscape
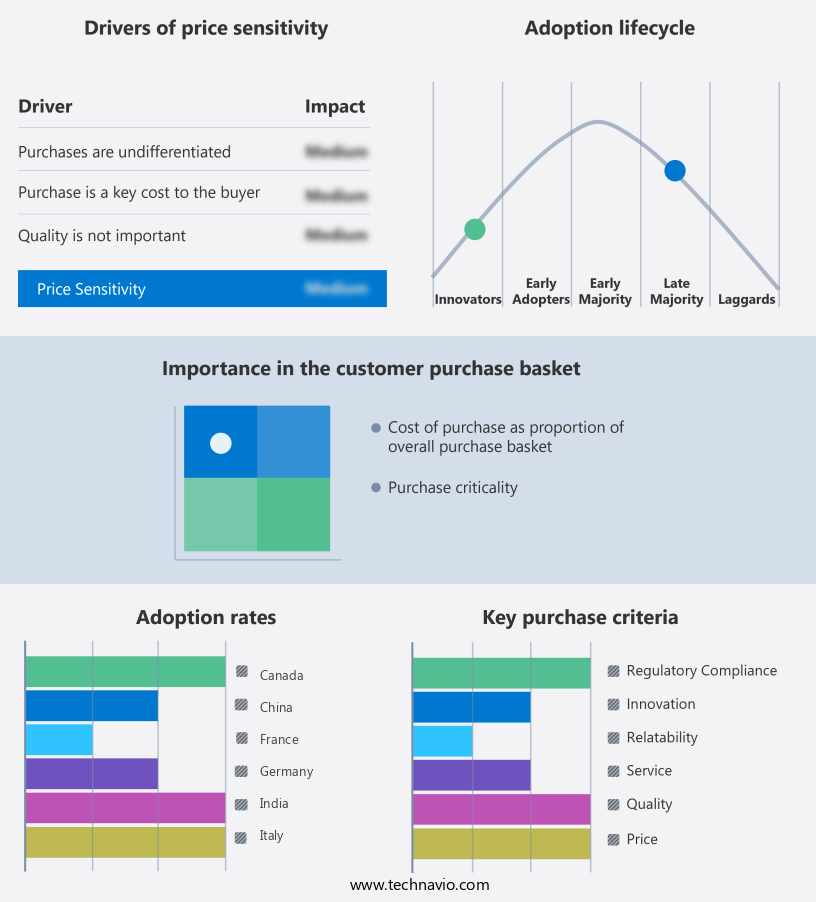
The market forecasting report includes the adoption lifecycle of the market, covering from the innovator's stage to the laggard's stage. It focuses on adoption rates in different regions based on penetration. Furthermore, the market report also includes key purchase criteria and drivers of price sensitivity to help companies evaluate and develop their market growth analysis strategies.

 Customer Landscape
Key Companies & Market Insights
Companies are implementing various strategies, such as strategic alliances, market forecast, partnerships, mergers and acquisitions, geographical expansion, and product/service launches, to enhance their presence in the industry.
ABB Ltd.  The company offers data center UPS such as MV UPS, Relays and modular UPS.
The industry research and growth report includes detailed analyses of the competitive landscape of the market and information about key companies, including:
	- Centiel Global
- Cyber Power Systems Inc.
- Delta Electronics Inc.
- Eaton Corp. plc
- Enconnex LLC
- EverExceed Corp.
- Fuji Electric Co. Ltd.
- General Electric Co.
- Hewlett Packard Enterprise Co.
- Hitachi Ltd.
- HITEC Power Protection BV
- Kohler Co.
- Legrand SA
- Mitsubishi Electric Corp.
- RPS Spa
- Schneider Electric SE
- SolarEdge Technologies Inc.
- Toshiba Corp.
- Vertiv Holdings Co.
Qualitative and quantitative analysis of companies has been conducted to help clients understand the wider business environment as well as the strengths and weaknesses of key industry players. Data is qualitatively analyzed to categorize companies as pure play, category-focused, industry-focused, and diversified; it is quantitatively analyzed to categorize companies as dominant, leading, strong, tentative, and weak.
Research Analyst Overview
The data center industry continues to experience significant growth as businesses increasingly rely on digital infrastructure to support their operations. However, ensuring the reliability and uninterrupted power supply of these facilities remains a critical challenge. Power interruptions, whether caused by utility outages or other factors, can lead to costly downtime and negatively impact business continuity. Edge computing, a decentralized approach to data processing, has emerged as a potential solution to mitigate the risks associated with power interruptions. By bringing data processing closer to the source, edge computing can reduce the need for large, centralized data centers and the associated power requirements.
In addition, the importance of uninterrupted power supply in data centers is further prioritized by the remote working culture that has become prevalent in the wake of the global health crisis. With more employees working from home, the need for reliable and efficient data center infrastructure has become even more critical. Independent power modules and other energy-saving modes are becoming increasingly popular in data center facilities to enhance efficiency and improve reliability. These solutions allow data centers to continue operating during power fluctuations and utility outages, minimizing downtime and reducing operating costs. The power infrastructure of data centers is a significant financial challenge for both large enterprises and smaller businesses.
Furthermore, high initial costs and ongoing energy usage make power infrastructure a significant expense. However, the widespread adoption of cloud infrastructure and cloud computing services has led to more eco-friendly and sustainable power solutions becoming available. The power electronics industry has responded to these evolving industry needs with a range of innovative products and solutions. Industrial UPS systems, Stallion battery chargers, and Socomec India's sustainable power solutions are just a few examples of the advanced technology available to critical facility customers. Backup power and remote management solutions are essential components of any reliable power infrastructure. Remote monitoring and control solutions enable data center operators to quickly identify and address power issues before they lead to downtime.
Moreover, the resilient power systems market is expected to continue growing as the digital economy expands and the demand for uninterrupted power supply increases. However, the financial challenge of implementing these solutions remains a barrier for some organizations. The power usage and carbon footprint of data centers are also becoming increasingly important considerations. Scalability solutions and AI and ML optimization are being adopted to improve energy efficiency and reduce the environmental impact of data centers. Independent power modules, energy-saving modes, and eco-friendly solutions are just a few of the innovations driving the market forward. The power electronics industry is responding to these challenges with advanced products and solutions that enable data centers to operate reliably and sustainably.
	
		
			| Market Scope | 
		
			| Report Coverage | Details | 
		
			| Page number | 225 | 
		
			| Base year | 2024 | 
		
			| Historic period | 2019-2023 | 
		
			| Forecast period | 2025-2029 | 
		
			| Growth momentum & CAGR | Accelerate at a CAGR of 12.8% | 
		
			| Market growth 2025-2029 | USD 7.47 billion | 
		
			| Market structure | Fragmented | 
		
			| YoY growth 2024-2025(%) | 11.5 | 
		
			| Key countries | US, China, Germany, Canada, UK, France, Japan, The Netherlands, India, and Italy | 
		
			| Competitive landscape | Leading Companies, market growth and forecasting, Market Positioning of Companies, Competitive Strategies, and Industry Risks | 
	
Request Free Sample
What are the Key Data Covered in this Market Research and Growth Report?
	- CAGR of the Data Center UPS industry during the forecast period
- Detailed information on factors that will drive the growth and forecasting between 2025 and 2029
- Precise estimation of the size of the market and its contribution of the industry in focus to the parent market
- Accurate predictions about upcoming growth and trends and changes in consumer behaviour
- Growth of the market across North America, Europe, APAC, South America, and Middle East and Africa
- Thorough analysis of the market's competitive landscape and detailed information about companies
- Comprehensive analysis of factors that will challenge the market growth of industry companies
We can help! Our analysts can customize this market research report to meet your requirements. 
Get in touch
                        
          
            1 Executive Summary
- 1.1 Market overview- Executive Summary - Chart on Market Overview
- Executive Summary - Data Table on Market Overview
- Executive Summary - Chart on Global Market Characteristics
- Executive Summary - Chart on Market by Geography
- Executive Summary - Chart on Market Segmentation by Product
- Executive Summary - Chart on Market Segmentation by Application
- Executive Summary - Chart on Market Segmentation by Battery Type
- Executive Summary - Chart on Incremental Growth
- Executive Summary - Data Table on Incremental Growth
- Executive Summary - Chart on Company Market Positioning
 
2 Technavio Analysis
- 2.1 Analysis of price sensitivity, lifecycle, customer purchase basket, adoption rates, and purchase criteria- Analysis of price sensitivity, lifecycle, customer purchase basket, adoption rates, and purchase criteria
 
- 2.2 Criticality of inputs and Factors of differentiation- Overview on criticality of inputs and factors of differentiation
 
- 2.3 Factors of disruption- Overview on factors of disruption
 
- 2.4 Impact of drivers and challenges- Impact of drivers and challenges in 2024 and 2029
 
3 Market Landscape
- 3.1 Market ecosystem- Parent Market
- Data Table on - Parent Market
 
- 3.2 Market characteristics- Market characteristics analysis
 
4 Market Sizing
- 4.1 Market definition- Offerings of companies included in the market definition
 
- 4.2 Market segment analysis
- 4.4 Market outlook: Forecast for 2024-2029- Chart on Global - Market size and forecast 2024-2029 ($ million)
- Data Table on Global - Market size and forecast 2024-2029 ($ million)
- Chart on Global Market: Year-over-year growth 2024-2029 (%)
- Data Table on Global Market: Year-over-year growth 2024-2029 (%)
 
5 Historic Market Size
- 5.1 Global Data Center UPS Market 2019 - 2023- Historic Market Size - Data Table on Global Data Center UPS Market 2019 - 2023 ($ million)
 
- 5.2 Product segment analysis 2019 - 2023- Historic Market Size - Product Segment 2019 - 2023 ($ million)
 
- 5.3 Application segment analysis 2019 - 2023- Historic Market Size - Application Segment 2019 - 2023 ($ million)
 
- 5.4 Battery Type segment analysis 2019 - 2023- Historic Market Size - Battery Type Segment 2019 - 2023 ($ million)
 
- 5.5 Geography segment analysis 2019 - 2023- Historic Market Size - Geography Segment 2019 - 2023 ($ million)
 
- 5.6 Country segment analysis 2019 - 2023- Historic Market Size - Country Segment 2019 - 2023 ($ million)
 
6 Qualitative Analysis
- 6.1 Impact of AI on Global Data Center UPS Market
7 Five Forces Analysis
- 7.1 Five forces summary- Five forces analysis - Comparison between 2024 and 2029
 
- 7.2 Bargaining power of buyers- Bargaining power of buyers - Impact of key factors 2024 and 2029
 
- 7.3 Bargaining power of suppliers- Bargaining power of suppliers - Impact of key factors in 2024 and 2029
 
- 7.4 Threat of new entrants- Threat of new entrants - Impact of key factors in 2024 and 2029
 
- 7.5 Threat of substitutes- Threat of substitutes - Impact of key factors in 2024 and 2029
 
- 7.6 Threat of rivalry- Threat of rivalry - Impact of key factors in 2024 and 2029
 
- 7.7 Market condition- Chart on Market condition - Five forces 2024 and 2029
 
8 Market Segmentation by Product
- 8.1 Market segments- Chart on Product - Market share 2024-2029 (%)
- Data Table on Product - Market share 2024-2029 (%)
 
- 8.2 Comparison by Product- Chart on Comparison by Product
- Data Table on Comparison by Product
 
- 8.3 Centralized UPS - Market size and forecast 2024-2029- Chart on Centralized UPS - Market size and forecast 2024-2029 ($ million)
- Data Table on Centralized UPS - Market size and forecast 2024-2029 ($ million)
- Chart on Centralized UPS - Year-over-year growth 2024-2029 (%)
- Data Table on Centralized UPS - Year-over-year growth 2024-2029 (%)
 
- 8.4 Zone UPS - Market size and forecast 2024-2029- Chart on Zone UPS - Market size and forecast 2024-2029 ($ million)
- Data Table on Zone UPS - Market size and forecast 2024-2029 ($ million)
- Chart on Zone UPS - Year-over-year growth 2024-2029 (%)
- Data Table on Zone UPS - Year-over-year growth 2024-2029 (%)
 
- 8.5 Rack-mount UPS - Market size and forecast 2024-2029- Chart on Rack-mount UPS - Market size and forecast 2024-2029 ($ million)
- Data Table on Rack-mount UPS - Market size and forecast 2024-2029 ($ million)
- Chart on Rack-mount UPS - Year-over-year growth 2024-2029 (%)
- Data Table on Rack-mount UPS - Year-over-year growth 2024-2029 (%)
 
- 8.6 Market opportunity by Product- Market opportunity by Product ($ million)
- Data Table on Market opportunity by Product ($ million)
 
9 Market Segmentation by Application
- 9.1 Market segments- Chart on Application - Market share 2024-2029 (%)
- Data Table on Application - Market share 2024-2029 (%)
 
- 9.2 Comparison by Application- Chart on Comparison by Application
- Data Table on Comparison by Application
 
- 9.3 Tier 3 data center - Market size and forecast 2024-2029- Chart on Tier 3 data center - Market size and forecast 2024-2029 ($ million)
- Data Table on Tier 3 data center - Market size and forecast 2024-2029 ($ million)
- Chart on Tier 3 data center - Year-over-year growth 2024-2029 (%)
- Data Table on Tier 3 data center - Year-over-year growth 2024-2029 (%)
 
- 9.4 Tier 1 and 2 data center - Market size and forecast 2024-2029- Chart on Tier 1 and 2 data center - Market size and forecast 2024-2029 ($ million)
- Data Table on Tier 1 and 2 data center - Market size and forecast 2024-2029 ($ million)
- Chart on Tier 1 and 2 data center - Year-over-year growth 2024-2029 (%)
- Data Table on Tier 1 and 2 data center - Year-over-year growth 2024-2029 (%)
 
- 9.5 Tier 4 data center - Market size and forecast 2024-2029- Chart on Tier 4 data center - Market size and forecast 2024-2029 ($ million)
- Data Table on Tier 4 data center - Market size and forecast 2024-2029 ($ million)
- Chart on Tier 4 data center - Year-over-year growth 2024-2029 (%)
- Data Table on Tier 4 data center - Year-over-year growth 2024-2029 (%)
 
- 9.6 Market opportunity by Application- Market opportunity by Application ($ million)
- Data Table on Market opportunity by Application ($ million)
 
10 Market Segmentation by Battery Type
- 10.1 Market segments- Chart on Battery Type - Market share 2024-2029 (%)
- Data Table on Battery Type - Market share 2024-2029 (%)
 
- 10.2 Comparison by Battery Type- Chart on Comparison by Battery Type
- Data Table on Comparison by Battery Type
 
- 10.3 VRLA batteries - Market size and forecast 2024-2029- Chart on VRLA batteries - Market size and forecast 2024-2029 ($ million)
- Data Table on VRLA batteries - Market size and forecast 2024-2029 ($ million)
- Chart on VRLA batteries - Year-over-year growth 2024-2029 (%)
- Data Table on VRLA batteries - Year-over-year growth 2024-2029 (%)
 
- 10.4 Lithium-ion batteries - Market size and forecast 2024-2029- Chart on Lithium-ion batteries - Market size and forecast 2024-2029 ($ million)
- Data Table on Lithium-ion batteries - Market size and forecast 2024-2029 ($ million)
- Chart on Lithium-ion batteries - Year-over-year growth 2024-2029 (%)
- Data Table on Lithium-ion batteries - Year-over-year growth 2024-2029 (%)
 
- 10.5 Other batteries - Market size and forecast 2024-2029- Chart on Other batteries - Market size and forecast 2024-2029 ($ million)
- Data Table on Other batteries - Market size and forecast 2024-2029 ($ million)
- Chart on Other batteries - Year-over-year growth 2024-2029 (%)
- Data Table on Other batteries - Year-over-year growth 2024-2029 (%)
 
- 10.6 Market opportunity by Battery Type- Market opportunity by Battery Type ($ million)
- Data Table on Market opportunity by Battery Type ($ million)
 
11 Customer Landscape
- 11.1 Customer landscape overview- Analysis of price sensitivity, lifecycle, customer purchase basket, adoption rates, and purchase criteria
 
12 Geographic Landscape
- 12.1 Geographic segmentation- Chart on Market share by geography 2024-2029 (%)
- Data Table on Market share by geography 2024-2029 (%)
 
- 12.2 Geographic comparison- Chart on Geographic comparison
- Data Table on Geographic comparison
 
- 12.3 North America - Market size and forecast 2024-2029- Chart on North America - Market size and forecast 2024-2029 ($ million)
- Data Table on North America - Market size and forecast 2024-2029 ($ million)
- Chart on North America - Year-over-year growth 2024-2029 (%)
- Data Table on North America - Year-over-year growth 2024-2029 (%)
 
- 12.4 Europe - Market size and forecast 2024-2029- Chart on Europe - Market size and forecast 2024-2029 ($ million)
- Data Table on Europe - Market size and forecast 2024-2029 ($ million)
- Chart on Europe - Year-over-year growth 2024-2029 (%)
- Data Table on Europe - Year-over-year growth 2024-2029 (%)
 
- 12.5 APAC - Market size and forecast 2024-2029- Chart on APAC - Market size and forecast 2024-2029 ($ million)
- Data Table on APAC - Market size and forecast 2024-2029 ($ million)
- Chart on APAC - Year-over-year growth 2024-2029 (%)
- Data Table on APAC - Year-over-year growth 2024-2029 (%)
 
- 12.6 South America - Market size and forecast 2024-2029- Chart on South America - Market size and forecast 2024-2029 ($ million)
- Data Table on South America - Market size and forecast 2024-2029 ($ million)
- Chart on South America - Year-over-year growth 2024-2029 (%)
- Data Table on South America - Year-over-year growth 2024-2029 (%)
 
- 12.7 Middle East and Africa - Market size and forecast 2024-2029- Chart on Middle East and Africa - Market size and forecast 2024-2029 ($ million)
- Data Table on Middle East and Africa - Market size and forecast 2024-2029 ($ million)
- Chart on Middle East and Africa - Year-over-year growth 2024-2029 (%)
- Data Table on Middle East and Africa - Year-over-year growth 2024-2029 (%)
 
- 12.8 US - Market size and forecast 2024-2029- Chart on US - Market size and forecast 2024-2029 ($ million)
- Data Table on US - Market size and forecast 2024-2029 ($ million)
- Chart on US - Year-over-year growth 2024-2029 (%)
- Data Table on US - Year-over-year growth 2024-2029 (%)
 
- 12.9 China - Market size and forecast 2024-2029- Chart on China - Market size and forecast 2024-2029 ($ million)
- Data Table on China - Market size and forecast 2024-2029 ($ million)
- Chart on China - Year-over-year growth 2024-2029 (%)
- Data Table on China - Year-over-year growth 2024-2029 (%)
 
- 12.10 Germany - Market size and forecast 2024-2029- Chart on Germany - Market size and forecast 2024-2029 ($ million)
- Data Table on Germany - Market size and forecast 2024-2029 ($ million)
- Chart on Germany - Year-over-year growth 2024-2029 (%)
- Data Table on Germany - Year-over-year growth 2024-2029 (%)
 
- 12.11 UK - Market size and forecast 2024-2029- Chart on UK - Market size and forecast 2024-2029 ($ million)
- Data Table on UK - Market size and forecast 2024-2029 ($ million)
- Chart on UK - Year-over-year growth 2024-2029 (%)
- Data Table on UK - Year-over-year growth 2024-2029 (%)
 
- 12.12 Canada - Market size and forecast 2024-2029- Chart on Canada - Market size and forecast 2024-2029 ($ million)
- Data Table on Canada - Market size and forecast 2024-2029 ($ million)
- Chart on Canada - Year-over-year growth 2024-2029 (%)
- Data Table on Canada - Year-over-year growth 2024-2029 (%)
 
- 12.13 France - Market size and forecast 2024-2029- Chart on France - Market size and forecast 2024-2029 ($ million)
- Data Table on France - Market size and forecast 2024-2029 ($ million)
- Chart on France - Year-over-year growth 2024-2029 (%)
- Data Table on France - Year-over-year growth 2024-2029 (%)
 
- 12.14 Japan - Market size and forecast 2024-2029- Chart on Japan - Market size and forecast 2024-2029 ($ million)
- Data Table on Japan - Market size and forecast 2024-2029 ($ million)
- Chart on Japan - Year-over-year growth 2024-2029 (%)
- Data Table on Japan - Year-over-year growth 2024-2029 (%)
 
- 12.15 The Netherlands - Market size and forecast 2024-2029- Chart on The Netherlands - Market size and forecast 2024-2029 ($ million)
- Data Table on The Netherlands - Market size and forecast 2024-2029 ($ million)
- Chart on The Netherlands - Year-over-year growth 2024-2029 (%)
- Data Table on The Netherlands - Year-over-year growth 2024-2029 (%)
 
- 12.16 India - Market size and forecast 2024-2029- Chart on India - Market size and forecast 2024-2029 ($ million)
- Data Table on India - Market size and forecast 2024-2029 ($ million)
- Chart on India - Year-over-year growth 2024-2029 (%)
- Data Table on India - Year-over-year growth 2024-2029 (%)
 
- 12.17 Italy - Market size and forecast 2024-2029- Chart on Italy - Market size and forecast 2024-2029 ($ million)
- Data Table on Italy - Market size and forecast 2024-2029 ($ million)
- Chart on Italy - Year-over-year growth 2024-2029 (%)
- Data Table on Italy - Year-over-year growth 2024-2029 (%)
 
- 12.18 Market opportunity by geography- Market opportunity by geography ($ million)
- Data Tables on Market opportunity by geography ($ million)
 
13 Drivers, Challenges, and Opportunity/Restraints
- 13.3 Impact of drivers and challenges- Impact of drivers and challenges in 2024 and 2029
 
- 13.4 Market opportunities/restraints
14 Competitive Landscape
- 14.2 Competitive Landscape- Overview on criticality of inputs and factors of differentiation
 
- 14.3 Landscape disruption- Overview on factors of disruption
 
- 14.4 Industry risks- Impact of key risks on business
 
15 Competitive Analysis
- 15.2 Company ranking index
- 15.3 Market positioning of companies- Matrix on companies position and classification
 
- 15.4 ABB Ltd.- ABB Ltd. - Overview
- ABB Ltd. - Business segments
- ABB Ltd. - Key news
- ABB Ltd. - Key offerings
- ABB Ltd. - Segment focus
- SWOT
 
- 15.5 Centiel Global- Centiel Global - Overview
- Centiel Global - Product / Service
- Centiel Global - Key offerings
- SWOT
 
- 15.6 Cyber Power Systems Inc.- Cyber Power Systems Inc. - Overview
- Cyber Power Systems Inc. - Product / Service
- Cyber Power Systems Inc. - Key news
- Cyber Power Systems Inc. - Key offerings
- SWOT
 
- 15.7 Delta Electronics Inc.- Delta Electronics Inc. - Overview
- Delta Electronics Inc. - Business segments
- Delta Electronics Inc. - Key news
- Delta Electronics Inc. - Key offerings
- Delta Electronics Inc. - Segment focus
- SWOT
 
- 15.8 Eaton Corp. Plc- Eaton Corp. Plc - Overview
- Eaton Corp. Plc - Business segments
- Eaton Corp. Plc - Key news
- Eaton Corp. Plc - Key offerings
- Eaton Corp. Plc - Segment focus
- SWOT
 
- 15.9 Enconnex LLC- Enconnex LLC - Overview
- Enconnex LLC - Product / Service
- Enconnex LLC - Key offerings
- SWOT
 
- 15.10 General Electric Co.- General Electric Co. - Overview
- General Electric Co. - Business segments
- General Electric Co. - Key news
- General Electric Co. - Key offerings
- General Electric Co. - Segment focus
- SWOT
 
- 15.11 Kohler Co.- Kohler Co. - Overview
- Kohler Co. - Product / Service
- Kohler Co. - Key news
- Kohler Co. - Key offerings
- SWOT
 
- 15.12 Legrand SA- Legrand SA - Overview
- Legrand SA - Business segments
- Legrand SA - Key news
- Legrand SA - Key offerings
- Legrand SA - Segment focus
- SWOT
 
- 15.13 Mitsubishi Electric Corp.- Mitsubishi Electric Corp. - Overview
- Mitsubishi Electric Corp. - Business segments
- Mitsubishi Electric Corp. - Key offerings
- Mitsubishi Electric Corp. - Segment focus
- SWOT
 
- 15.14 RPS Spa- RPS Spa - Overview
- RPS Spa - Product / Service
- RPS Spa - Key offerings
- SWOT
 
- 15.15 Schneider Electric SE- Schneider Electric SE - Overview
- Schneider Electric SE - Business segments
- Schneider Electric SE - Key news
- Schneider Electric SE - Key offerings
- Schneider Electric SE - Segment focus
- SWOT
 
- 15.16 SolarEdge Technologies Inc.- SolarEdge Technologies Inc. - Overview
- SolarEdge Technologies Inc. - Product / Service
- SolarEdge Technologies Inc. - Key news
- SolarEdge Technologies Inc. - Key offerings
- SWOT
 
- 15.17 Toshiba Corp.- Toshiba Corp. - Overview
- Toshiba Corp. - Business segments
- Toshiba Corp. - Key news
- Toshiba Corp. - Key offerings
- Toshiba Corp. - Segment focus
- SWOT
 
- 15.18 Vertiv Holdings Co.- Vertiv Holdings Co. - Overview
- Vertiv Holdings Co. - Business segments
- Vertiv Holdings Co. - Key offerings
- Vertiv Holdings Co. - Segment focus
- SWOT
 
16 Appendix
- 16.2 Inclusions and exclusions checklist- Inclusions checklist
- Exclusions checklist
 
- 16.3 Currency conversion rates for US$- Currency conversion rates for US$
 
- 16.4 Research methodology
- 16.7 Validation techniques employed for market sizing- Validation techniques employed for market sizing
 
- 16.9 360 degree market analysis- 360 degree market analysis
 
- 16.10 List of abbreviations