Power Management Integrated Circuit (PMIC) Market Analysis, Size, and Forecast 2026-2030: APAC (China, Japan, and South Korea), Europe (Germany, UK, and France), North America (US, Canada, and Mexico), South America (Brazil and Argentina), Middle East and Africa (Saudi Arabia, UAE, and South Africa), and Rest of World (ROW)

Power Management Integrated Circuit (PMIC) Market Analysis, Size, and Forecast 2026-2030:
APAC (China, Japan, and South Korea), Europe (Germany, UK, and France), North America (US, Canada, and Mexico), South America (Brazil and Argentina), Middle East and Africa (Saudi Arabia, UAE, and South Africa), and Rest of World (ROW)

Published: Apr 2026 321 Pages SKU: IRTNTR75744

Market Overview at a Glance

$11.64 B
Market Opportunity
5.4%
CAGR 2025 - 2030
44.4%
APAC Growth
$12.26 B
Voltage regulators segment 2024

Power Management Integrated Circuit (PMIC) Market Size 2026-2030

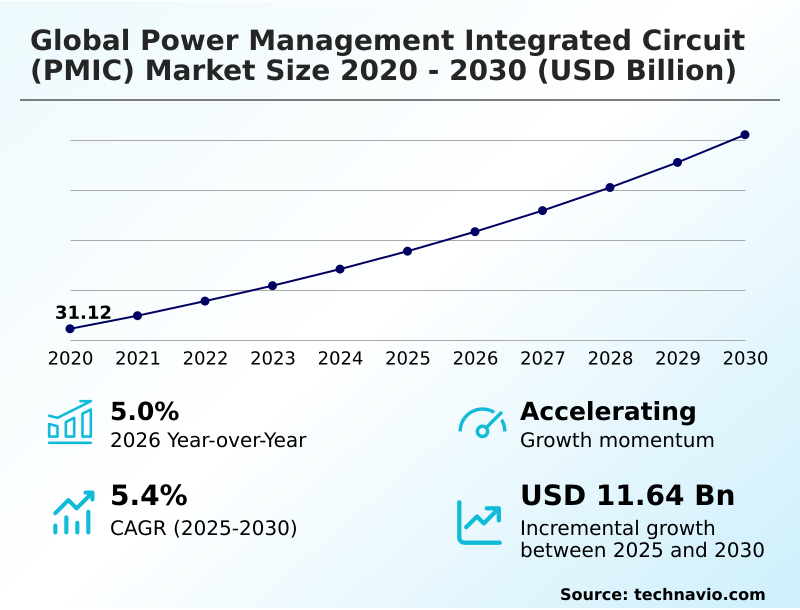
The power management integrated circuit (pmic) market size is valued to increase by USD 11.64 billion, at a CAGR of 5.4% from 2025 to 2030. Inclusion of high-voltage electric vehicle power distribution architectures will drive the power management integrated circuit (pmic) market.

Major Market Trends & Insights

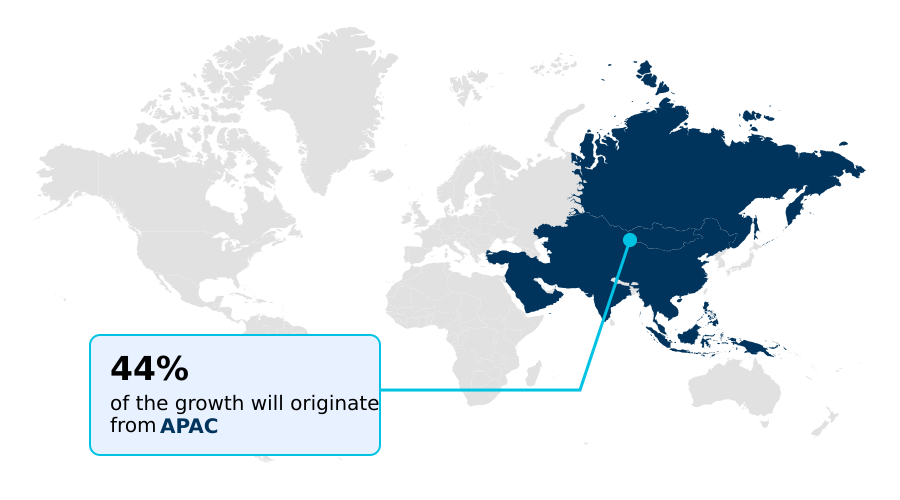
  • APAC dominated the market and accounted for a 44.4% growth during the forecast period.
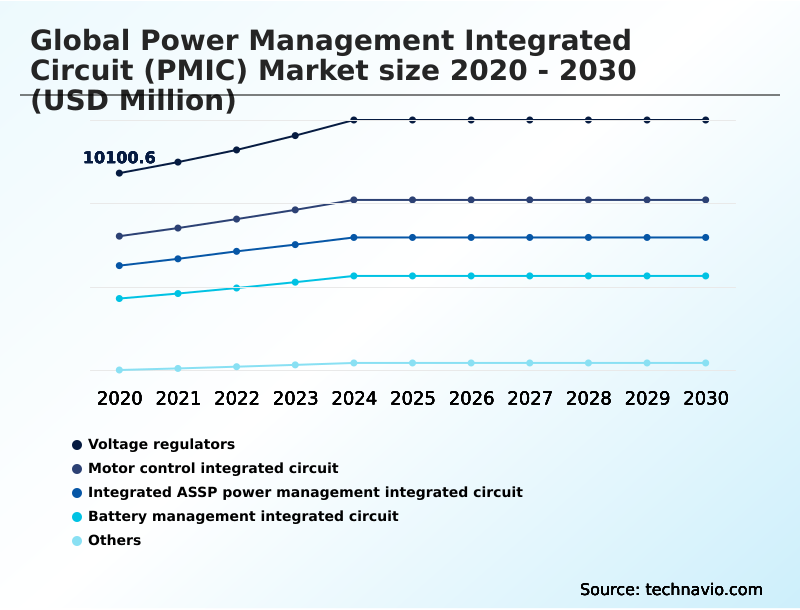
  • By Product - Voltage regulators segment was valued at USD 12.26 billion in 2024
  • By End-user - Automotive and transportation segment accounted for the largest market revenue share in 2024

Market Size & Forecast

  • Market Opportunities: USD 19.41 billion
  • Market Future Opportunities: USD 11.64 billion
  • CAGR from 2025 to 2030 : 5.4%

Market Summary

  • The Power Management Integrated Circuit (PMIC) market is defined by a relentless drive for efficiency and integration, supporting the backbone of modern electronics. Key drivers include the proliferation of high-voltage architectures in electric vehicles and the exponential power demands of hyperscale data centers running AI workloads.
  • A significant trend is the shift toward wide-bandgap materials like silicon carbide and gallium nitride, which offer superior thermal performance and lower switching losses. This enables the development of compact, high-density power modules. However, this miniaturization presents thermal dissipation challenges, requiring advanced liquid cooling and packaging innovations.
  • For instance, in an industrial automation scenario, deploying PMICs with integrated AI for workload-aware power management can optimize energy use in robotic arms, reducing consumption during idle periods while ensuring peak power for high-precision tasks.
  • This convergence of digital logic and analog control is creating cognitive power systems, essential for managing energy in everything from IoT devices with ultra-low quiescent current to complex systems requiring sophisticated battery charging and multi-phase power management. The industry's trajectory is toward creating a more autonomous, energy-aware digital landscape where the PMIC is a critical enabler of performance and sustainability.

What will be the Size of the Power Management Integrated Circuit (PMIC) Market during the forecast period?

Get Key Insights on Market Forecast (PDF) Request Free Sample

How is the Power Management Integrated Circuit (PMIC) Market Segmented?

The power management integrated circuit (pmic) industry research report provides comprehensive data (region-wise segment analysis), with forecasts and estimates in "USD million" for the period 2026-2030, as well as historical data from 2020-2024 for the following segments.

  • Product
    • Voltage regulators
    • Motor control integrated circuit
    • Integrated ASSP power management integrated circuit
    • Battery management integrated circuit
    • Others
  • End-user
    • Automotive and transportation
    • Consumer electronics
    • Industrial
    • Telecom and networking
    • Others
  • Usage
    • Between 5V to 15V
    • Below 5V
    • Above 15V
  • Geography
    • APAC
      • China
      • Japan
      • South Korea
    • Europe
      • Germany
      • UK
      • France
    • North America
      • US
      • Canada
      • Mexico
    • South America
      • Brazil
      • Argentina
    • Middle East and Africa
      • Saudi Arabia
      • UAE
      • South Africa
    • Rest of World (ROW)

By Product Insights

The voltage regulators segment is estimated to witness significant growth during the forecast period.

The power management integrated circuit (PMIC) market segmentation reflects a dynamic landscape where demand is driven by increasingly sophisticated system requirements. Core segments such as voltage regulators and motor control integrated circuits are evolving to support complex industrial motor drives.

Concurrently, the integrated ASSP and battery management integrated circuit segments are crucial for software-defined vehicles and portable medical diagnostics.

Achieving higher functional density in power modules through advanced mixed-signal design is a key objective, enabling efficient power conversion for applications like remote radio heads and server-side applications.

This focus on integration supports broader green energy workflows, with systems achieving a 15% reduction in board space while enhancing thermal performance, a critical factor for high-performance computing environments.

Request Free Sample

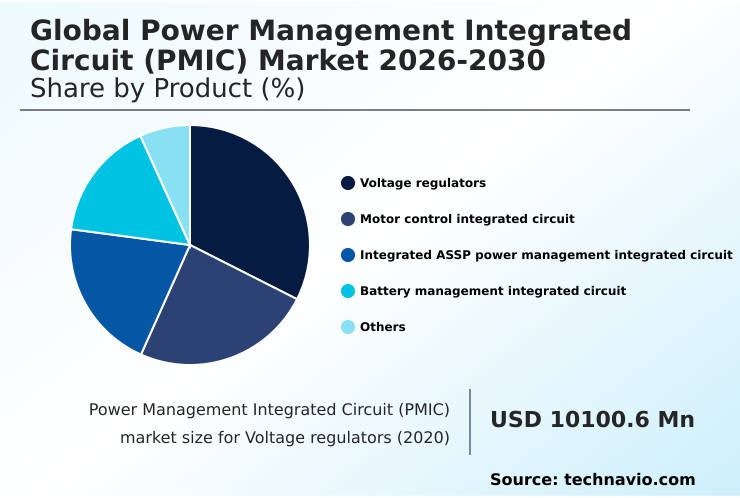
The Voltage regulators segment was valued at USD 12.26 billion in 2024 and showed a gradual increase during the forecast period.

Request Free Sample

Regional Analysis

APAC is estimated to contribute 44.4% to the growth of the global market during the forecast period.Technavio’s analysts have elaborately explained the regional trends and drivers that shape the market during the forecast period.

See How Power Management Integrated Circuit (PMIC) Market Demand is Rising in APAC Request Free Sample

The geographic landscape of the Power Management Integrated Circuit (PMIC) market is led by the APAC region, driven by its vast consumer electronics manufacturing base and government initiatives promoting advanced packaging facilities.

In North America, the market is defined by the high-performance computing sector and the rapid expansion of EV infrastructure, requiring advanced voltage scaling and DC-to-DC conversion.

Europe focuses on industrial automation and automotive applications, emphasizing high-efficiency power conversion and digital power controllers. Across all regions, the demand for low quiescent current solutions for battery charging in off-grid solar systems and IoT devices is growing.

For instance, integrating PMICs with smart regulating stage technology in commercial transportation has demonstrated a 12% improvement in fuel efficiency. The development of energy harvesting solutions is a priority in remote applications, further diversifying the market's geographic opportunities.

Market Dynamics

Our researchers analyzed the data with 2025 as the base year, along with the key drivers, trends, and challenges. A holistic analysis of drivers will help companies refine their marketing strategies to gain a competitive advantage.

  • The global power management integrated circuit market is navigating complex technological demands, with a strong focus on high-efficiency power conversion for AI accelerators. These applications require precise, high-current, low-voltage supplies, driving innovation in multi-phase architectures. A parallel focus is on multi-channel integrated battery management systems, essential for the safety and longevity of batteries in electric vehicles and portable electronics.
  • In data centers, workload-aware power management for data centers is becoming standard, with intelligent power modules for fiber gateways enabling dynamic energy allocation that can reduce consumption by over 15% compared to static systems.
  • The adoption of wide-bandgap semiconductor thermal dissipation solutions, using materials like GaN and SiC, addresses a critical bottleneck in high-density power modules for logistics and industrial robotics. However, proprietary power protocol interoperability challenges persist, complicating system integration. Firms are also navigating regulatory compliance for material provenance standards and developing solutions for sub-microampere quiescent current for IoT devices.
  • Key development areas include 800-volt electric vehicle powertrain efficiency, integrated biometric sensing power regulation, and bidirectional gallium nitride power switch applications. These advancements in power management for high-performance mobile computing and high-precision voltage scaling for server racks are crucial for next-generation electronics.

What are the key market drivers leading to the rise in the adoption of Power Management Integrated Circuit (PMIC) Industry?

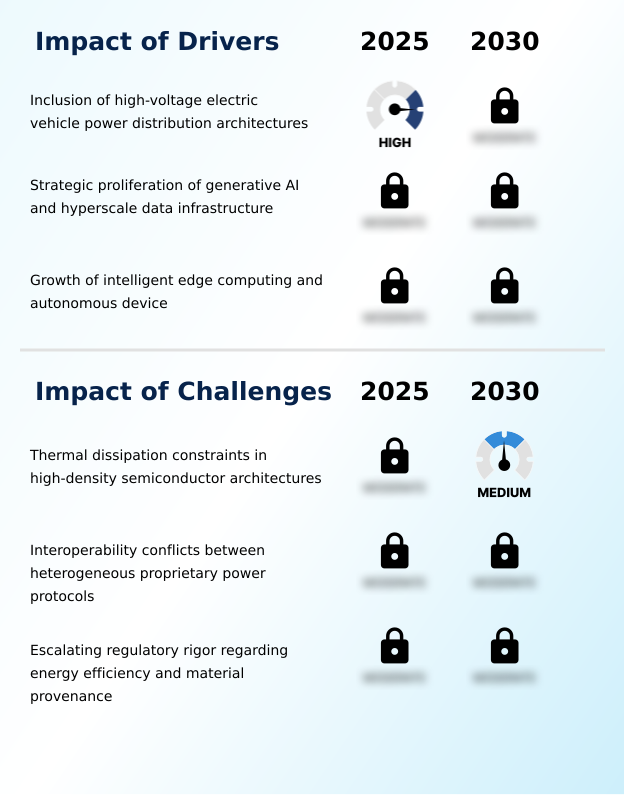
  • The rapid institutionalization of high-voltage electrical architectures within the automotive sector, particularly for electric vehicle power distribution, is a primary market driver.

  • Market growth is fundamentally driven by the escalating power requirements of high-performance sectors. The proliferation of high-voltage architectures in electric vehicles, which utilize advanced on-board chargers and traction inverters, is a primary catalyst.
  • This transition improves energy throughput and enables faster charging. Simultaneously, the expansion of hyperscale data centers for AI workloads necessitates sophisticated multi-phase power management to deliver high-current, low-voltage power with rapid transient response, improving server efficiency by over 15%.
  • The growth of the Internet of Things and smart city infrastructure also fuels demand for ultra-low-power ICs. Effective power sequencing in these complex systems, from advanced driver assistance systems to cloud-integrated platforms, is critical for operational reliability.
  • This demand ensures that PMICs remain a vital component in the digital economy's backbone.

What are the market trends shaping the Power Management Integrated Circuit (PMIC) Industry?

  • A structural market transition is underway, characterized by the expanding adoption of high-voltage silicon carbide and gallium nitride architectures. This shift meets escalating efficiency demands from the ongoing energy transition.

  • Key trends in the Power Management Integrated Circuit (PMIC) market are centered on enhancing efficiency and power density to meet the demands of modern electronics. The expansion of wide-bandgap materials, including silicon carbide and gallium nitride, is a structural shift, enabling superior thermal performance and lower switching losses.
  • This is critical for electric vehicle platforms and grid-scale energy storage systems, where advanced gate drivers improve power conversion efficiency by up to 25%. In telecommunications infrastructure, GaN-based PMICs allow for smaller, more efficient remote radio heads. Furthermore, the trend toward multi-rail sequencing and dynamic voltage scaling supports the needs of generative AI infrastructure, where precise power delivery is essential.
  • This move toward hardware-software integration, supported by advancements in digital product passports, allows for greater system-level optimization and is reshaping the design of next-generation power systems.

What challenges does the Power Management Integrated Circuit (PMIC) Industry face during its growth?

  • A key market challenge involves managing thermal dissipation constraints that arise from increasing power densities within high-density semiconductor architectures.

  • The primary challenges in the Power Management Integrated Circuit (PMIC) market stem from the physical limitations of high-density designs. As manufacturers integrate more functions, managing thermal throttling becomes a significant barrier, particularly for autonomous device ecosystems and intelligent edge computing. This often requires complex and costly liquid cooling solutions, negating some miniaturization benefits.
  • Systems in harsh environmental conditions see reliability drop by 10% without proper thermal management. Another major hurdle is the lack of standardization in communication protocols for fault monitoring and telemetry, which complicates system integration and leads to suboptimal power usage effectiveness.
  • Furthermore, escalating regulatory demands for standby power reduction and verifiable material provenance add significant administrative overhead, with compliance costs increasing by over 25% for firms with global supply chains that rely on extensive wafer fabrication networks.

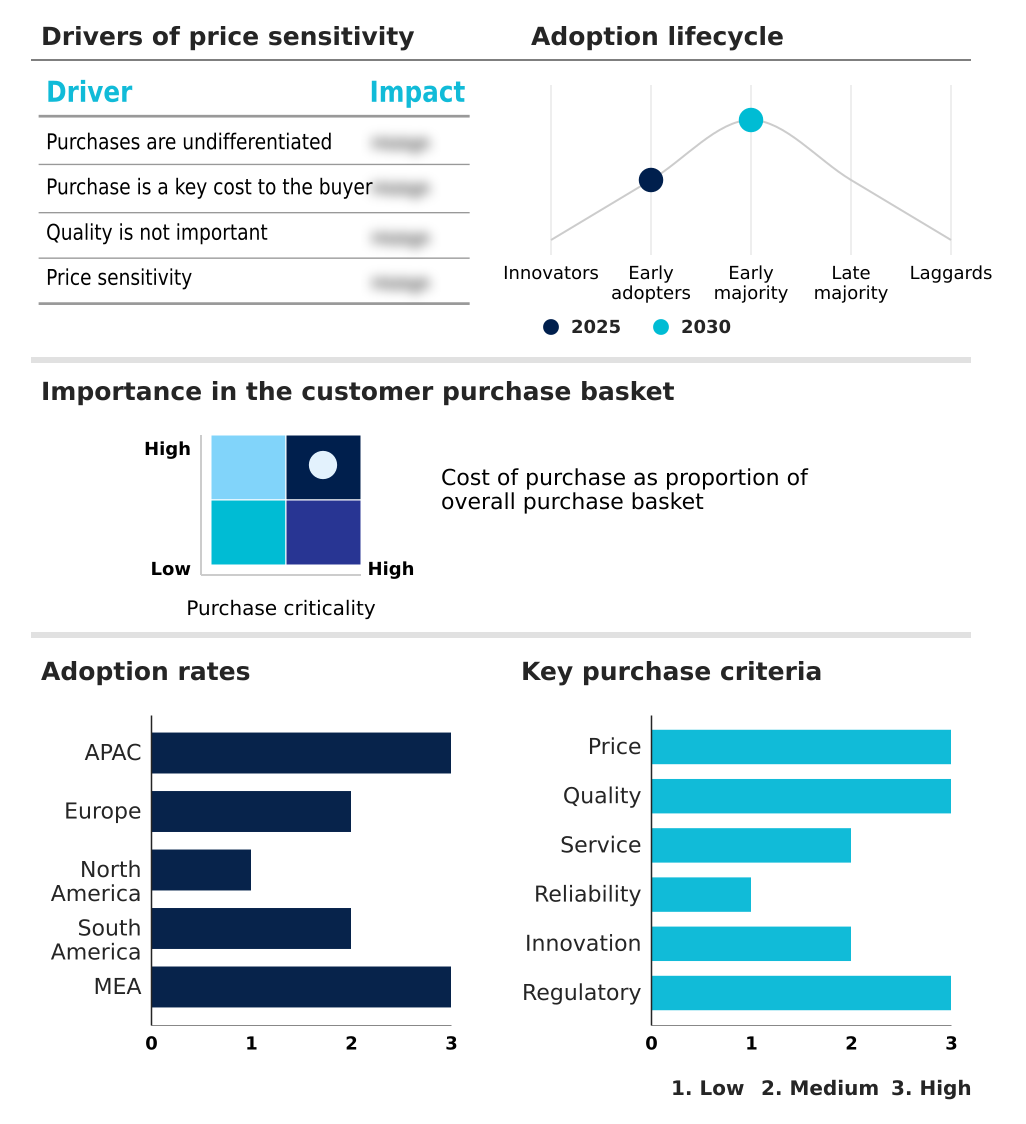
Exclusive Technavio Analysis on Customer Landscape

The power management integrated circuit (pmic) market forecasting report includes the adoption lifecycle of the market, covering from the innovator’s stage to the laggard’s stage. It focuses on adoption rates in different regions based on penetration. Furthermore, the power management integrated circuit (pmic) market report also includes key purchase criteria and drivers of price sensitivity to help companies evaluate and develop their market growth analysis strategies.

Customer Landscape of Power Management Integrated Circuit (PMIC) Industry

Competitive Landscape

Companies are implementing various strategies, such as strategic alliances, power management integrated circuit (pmic) market forecast, partnerships, mergers and acquisitions, geographical expansion, and product/service launches, to enhance their presence in the industry.

Allegro MicroSystems Inc. - Key offerings include specialized sensors and power management solutions engineered to optimize operational efficiency in advanced mechanical systems for industrial and automotive applications.

The industry research and growth report includes detailed analyses of the competitive landscape of the market and information about key companies, including:

  • Allegro MicroSystems Inc.
  • Analog Devices Inc.
  • Cactus Semiconductor Inc
  • Infineon Technologies AG
  • JLCPCB
  • MagnaChip Semiconductor Corp.
  • Microchip Technology Inc.
  • MinebeaMitsumi Inc.
  • Monolithic Power Systems Inc.
  • Nordic Semiconductor ASA
  • NXP Semiconductors NV
  • ON Semiconductor Corp.
  • Qorvo Inc.
  • Qualcomm Inc.
  • Renesas Electronics Corp.
  • ROHM Co. Ltd.
  • Semtech Corp.
  • STMicroelectronics NV
  • Texas Instruments Inc.
  • Vishay Intertechnology Inc.

Qualitative and quantitative analysis of companies has been conducted to help clients understand the wider business environment as well as the strengths and weaknesses of key industry players. Data is qualitatively analyzed to categorize companies as pure play, category-focused, industry-focused, and diversified; it is quantitatively analyzed to categorize companies as dominant, leading, strong, tentative, and weak.

Recent Development and News in Power management integrated circuit (pmic) market

  • In March, 2025, Renesas Electronics Corp. unveiled its first bidirectional 650-volt gallium nitride power switches, specifically engineered to enhance efficiency in solar inverters and AI data center power supplies.
  • In February, 2025, Infineon Technologies AG commenced the commercial ramp-up of its second-generation silicon carbide MOSFET technology, delivering a 30% increase in power density for industrial and automotive power modules.
  • In November, 2024, MaxLinear, Inc. introduced a modular intelligent power management solution combining a proprietary controller with smart regulating stage modules, designed to create a thermally optimized architecture for next-generation Wi-Fi 7 and fiber gateways.
  • In September, 2024, NVIDIA launched the Nemotron Coalition, a strategic initiative with AI labs to develop open frontier models, driving demand for multi-channel PMICs capable of powering massive GPU arrays with minimal energy loss.

Dive into Technavio’s robust research methodology, blending expert interviews, extensive data synthesis, and validated models for unparalleled Power Management Integrated Circuit (PMIC) Market insights. See full methodology.

Market Scope
Page number 321
Base year 2025
Historic period 2020-2024
Forecast period 2026-2030
Growth momentum & CAGR Accelerate at a CAGR of 5.4%
Market growth 2026-2030 USD 11642.9 million
Market structure Fragmented
YoY growth 2025-2026(%) 5.0%
Key countries China, Japan, South Korea, India, Indonesia, Australia, Germany, UK, France, Italy, The Netherlands, Spain, US, Canada, Mexico, Brazil, Argentina, Chile, Saudi Arabia, UAE, South Africa, Turkey and Israel
Competitive landscape Leading Companies, Market Positioning of Companies, Competitive Strategies, and Industry Risks

Request Free Sample

Research Analyst Overview

  • The Power Management Integrated Circuit (PMIC) market's trajectory is dictated by the imperative for higher efficiency and functional density across all electronic systems. The transition to high-voltage architectures, particularly in the automotive sector, necessitates advanced power modules and gate drivers capable of managing extreme thermal and electrical stress.
  • This shift is mirrored in data centers, where multi-phase power management is critical to support the energy throughput of AI accelerators without thermal throttling. A key boardroom consideration is the adoption of wide-bandgap materials like silicon carbide and gallium nitride, a strategic decision impacting long-term product roadmaps and supply chain resilience.
  • For example, firms leveraging these materials have achieved a 30% increase in power density, enabling smaller, more efficient end-products. The market is also defined by the need for sophisticated voltage scaling, battery charging, and DC-to-DC conversion, with advancements in liquid cooling and wafer fabrication being essential enablers.
  • The continuous innovation in power conversion and dynamic voltage scaling solidifies the PMIC's role as a foundational technology for next-generation computing and electrification.

What are the Key Data Covered in this Power Management Integrated Circuit (PMIC) Market Research and Growth Report?

  • What is the expected growth of the Power Management Integrated Circuit (PMIC) Market between 2026 and 2030?

    • USD 11.64 billion, at a CAGR of 5.4%

  • What segmentation does the market report cover?

    • The report is segmented by Product (Voltage regulators, Motor control integrated circuit, Integrated ASSP power management integrated circuit, Battery management integrated circuit, and Others), End-user (Automotive and transportation, Consumer electronics, Industrial, Telecom and networking, and Others), Usage (Between 5V to 15V, Below 5V, and Above 15V) and Geography (APAC, Europe, North America, South America, Middle East and Africa)

  • Which regions are analyzed in the report?

    • APAC, Europe, North America, South America and Middle East and Africa

  • What are the key growth drivers and market challenges?

    • Inclusion of high-voltage electric vehicle power distribution architectures, Thermal dissipation constraints in high-density semiconductor architectures

  • Who are the major players in the Power Management Integrated Circuit (PMIC) Market?

    • Allegro MicroSystems Inc., Analog Devices Inc., Cactus Semiconductor Inc, Infineon Technologies AG, JLCPCB, MagnaChip Semiconductor Corp., Microchip Technology Inc., MinebeaMitsumi Inc., Monolithic Power Systems Inc., Nordic Semiconductor ASA, NXP Semiconductors NV, ON Semiconductor Corp., Qorvo Inc., Qualcomm Inc., Renesas Electronics Corp., ROHM Co. Ltd., Semtech Corp., STMicroelectronics NV, Texas Instruments Inc. and Vishay Intertechnology Inc.

Market Research Insights

  • The market dynamics for power management integrated circuits are shaped by the strategic needs of high-growth sectors. The expansion of generative AI infrastructure and intelligent edge computing ecosystems mandates advanced power solutions. In hyperscale data centers, deployments of multi-phase power architectures have improved energy throughput by over 20%, directly lowering operational costs.
  • Similarly, the adoption of specialized PMICs in industrial automation sensors has extended device lifespans, reducing maintenance cycles by up to 35% in harsh environmental conditions. This shift is also visible in the automotive sector, where advanced driver assistance systems rely on high-reliability PMICs.
  • As industries pursue greater efficiency and autonomy, the focus on sophisticated energy management and embedded wireless connectivity in smart city infrastructure continues to intensify.

We can help! Our analysts can customize this power management integrated circuit (pmic) market research report to meet your requirements.

Get in touch

1. Executive Summary

1.1 Market overview

Executive Summary - Chart on Market Overview
Executive Summary - Data Table on Market Overview
Executive Summary - Chart on Global Market Characteristics
Executive Summary - Chart on Market by Geography
Executive Summary - Chart on Market Segmentation by Product
Executive Summary - Chart on Market Segmentation by End-user
Executive Summary - Chart on Market Segmentation by Usage
Executive Summary - Chart on Incremental Growth
Executive Summary - Data Table on Incremental Growth
Executive Summary - Chart on Company Market Positioning

2. Technavio Analysis

2.1 Analysis of price sensitivity, lifecycle, customer purchase basket, adoption rates, and purchase criteria

2.2 Criticality of inputs and Factors of differentiation

Chart on Overview on criticality of inputs and factors of differentiation

2.3 Factors of disruption

Chart on Overview on factors of disruption

2.4 Impact of drivers and challenges

Chart on Impact of drivers and challenges in 2025 and 2030

3. Market Landscape

3.1 Market ecosystem

Chart on Parent Market
Data Table on - Parent Market

3.2 Market characteristics

Chart on Market characteristics analysis

3.3 Value chain analysis

Chart on Value chain analysis

4. Market Sizing

4.1 Market definition

Data Table on Offerings of companies included in the market definition

4.2 Market segment analysis

Market segments

4.3 Market size 2025

4.4 Market outlook: Forecast for 2025-2030

Chart on Global - Market size and forecast 2025-2030 ($ million)
Data Table on Global - Market size and forecast 2025-2030 ($ million)
Chart on Global Market: Year-over-year growth 2025-2030 (%)
Data Table on Global Market: Year-over-year growth 2025-2030 (%)

5. Historic Market Size

5.1 Global Power Management Integrated Circuit (PMIC) Market 2020 - 2024

Historic Market Size - Data Table on Global Power Management Integrated Circuit (PMIC) Market 2020 - 2024 ($ million)

5.2 Product segment analysis 2020 - 2024

Historic Market Size - Product Segment 2020 - 2024 ($ million)

5.3 End-user segment analysis 2020 - 2024

Historic Market Size - End-user Segment 2020 - 2024 ($ million)

5.4 Usage segment analysis 2020 - 2024

Historic Market Size - Usage Segment 2020 - 2024 ($ million)

5.5 Geography segment analysis 2020 - 2024

Historic Market Size - Geography Segment 2020 - 2024 ($ million)

5.6 Country segment analysis 2020 - 2024

Historic Market Size - Country Segment 2020 - 2024 ($ million)

6. Qualitative Analysis

6.1 Impact of AI on global power management integrated circuit (PMIC) market

6.2 Impact of geopolitical conflict on global power management integrated circuit (PMIC) market

7. Five Forces Analysis

7.1 Five forces summary

Five forces analysis - Comparison between 2025 and 2030

7.2 Bargaining power of buyers

Bargaining power of buyers - Impact of key factors 2025 and 2030

7.3 Bargaining power of suppliers

Bargaining power of suppliers - Impact of key factors in 2025 and 2030

7.4 Threat of new entrants

Threat of new entrants - Impact of key factors in 2025 and 2030

7.5 Threat of substitutes

Threat of substitutes - Impact of key factors in 2025 and 2030

7.6 Threat of rivalry

Threat of rivalry - Impact of key factors in 2025 and 2030

7.7 Market condition

Chart on Market condition - Five forces 2025 and 2030

8. Market Segmentation by Product

8.1 Market segments

Chart on Product - Market share 2025-2030 (%)
Data Table on Product - Market share 2025-2030 (%)

8.2 Comparison by Product

Chart on Comparison by Product
Data Table on Comparison by Product

8.3 Voltage regulators - Market size and forecast 2025-2030

Chart on Voltage regulators - Market size and forecast 2025-2030 ($ million)
Data Table on Voltage regulators - Market size and forecast 2025-2030 ($ million)
Chart on Voltage regulators - Year-over-year growth 2025-2030 (%)
Data Table on Voltage regulators - Year-over-year growth 2025-2030 (%)

8.4 Motor control integrated circuit - Market size and forecast 2025-2030

Chart on Motor control integrated circuit - Market size and forecast 2025-2030 ($ million)
Data Table on Motor control integrated circuit - Market size and forecast 2025-2030 ($ million)
Chart on Motor control integrated circuit - Year-over-year growth 2025-2030 (%)
Data Table on Motor control integrated circuit - Year-over-year growth 2025-2030 (%)

8.5 Integrated ASSP power management integrated circuit - Market size and forecast 2025-2030

Chart on Integrated ASSP power management integrated circuit - Market size and forecast 2025-2030 ($ million)
Data Table on Integrated ASSP power management integrated circuit - Market size and forecast 2025-2030 ($ million)
Chart on Integrated ASSP power management integrated circuit - Year-over-year growth 2025-2030 (%)
Data Table on Integrated ASSP power management integrated circuit - Year-over-year growth 2025-2030 (%)

8.6 Battery management integrated circuit - Market size and forecast 2025-2030

Chart on Battery management integrated circuit - Market size and forecast 2025-2030 ($ million)
Data Table on Battery management integrated circuit - Market size and forecast 2025-2030 ($ million)
Chart on Battery management integrated circuit - Year-over-year growth 2025-2030 (%)
Data Table on Battery management integrated circuit - Year-over-year growth 2025-2030 (%)

8.7 Others - Market size and forecast 2025-2030

Chart on Others - Market size and forecast 2025-2030 ($ million)
Data Table on Others - Market size and forecast 2025-2030 ($ million)
Chart on Others - Year-over-year growth 2025-2030 (%)
Data Table on Others - Year-over-year growth 2025-2030 (%)

8.8 Market opportunity by Product

Market opportunity by Product ($ million)
Data Table on Market opportunity by Product ($ million)

9. Market Segmentation by End-user

9.1 Market segments

Chart on End-user - Market share 2025-2030 (%)
Data Table on End-user - Market share 2025-2030 (%)

9.2 Comparison by End-user

Chart on Comparison by End-user
Data Table on Comparison by End-user

9.3 Automotive and transportation - Market size and forecast 2025-2030

Chart on Automotive and transportation - Market size and forecast 2025-2030 ($ million)
Data Table on Automotive and transportation - Market size and forecast 2025-2030 ($ million)
Chart on Automotive and transportation - Year-over-year growth 2025-2030 (%)
Data Table on Automotive and transportation - Year-over-year growth 2025-2030 (%)

9.4 Consumer electronics - Market size and forecast 2025-2030

Chart on Consumer electronics - Market size and forecast 2025-2030 ($ million)
Data Table on Consumer electronics - Market size and forecast 2025-2030 ($ million)
Chart on Consumer electronics - Year-over-year growth 2025-2030 (%)
Data Table on Consumer electronics - Year-over-year growth 2025-2030 (%)

9.5 Industrial - Market size and forecast 2025-2030

Chart on Industrial - Market size and forecast 2025-2030 ($ million)
Data Table on Industrial - Market size and forecast 2025-2030 ($ million)
Chart on Industrial - Year-over-year growth 2025-2030 (%)
Data Table on Industrial - Year-over-year growth 2025-2030 (%)

9.6 Telecom and networking - Market size and forecast 2025-2030

Chart on Telecom and networking - Market size and forecast 2025-2030 ($ million)
Data Table on Telecom and networking - Market size and forecast 2025-2030 ($ million)
Chart on Telecom and networking - Year-over-year growth 2025-2030 (%)
Data Table on Telecom and networking - Year-over-year growth 2025-2030 (%)

9.7 Others - Market size and forecast 2025-2030

Chart on Others - Market size and forecast 2025-2030 ($ million)
Data Table on Others - Market size and forecast 2025-2030 ($ million)
Chart on Others - Year-over-year growth 2025-2030 (%)
Data Table on Others - Year-over-year growth 2025-2030 (%)

9.8 Market opportunity by End-user

Market opportunity by End-user ($ million)
Data Table on Market opportunity by End-user ($ million)

10. Market Segmentation by Usage

10.1 Market segments

Chart on Usage - Market share 2025-2030 (%)
Data Table on Usage - Market share 2025-2030 (%)

10.2 Comparison by Usage

Chart on Comparison by Usage
Data Table on Comparison by Usage

10.3 Between 5V to 15V - Market size and forecast 2025-2030

Chart on Between 5V to 15V - Market size and forecast 2025-2030 ($ million)
Data Table on Between 5V to 15V - Market size and forecast 2025-2030 ($ million)
Chart on Between 5V to 15V - Year-over-year growth 2025-2030 (%)
Data Table on Between 5V to 15V - Year-over-year growth 2025-2030 (%)

10.4 Below 5V - Market size and forecast 2025-2030

Chart on Below 5V - Market size and forecast 2025-2030 ($ million)
Data Table on Below 5V - Market size and forecast 2025-2030 ($ million)
Chart on Below 5V - Year-over-year growth 2025-2030 (%)
Data Table on Below 5V - Year-over-year growth 2025-2030 (%)

10.5 Above 15V - Market size and forecast 2025-2030

Chart on Above 15V - Market size and forecast 2025-2030 ($ million)
Data Table on Above 15V - Market size and forecast 2025-2030 ($ million)
Chart on Above 15V - Year-over-year growth 2025-2030 (%)
Data Table on Above 15V - Year-over-year growth 2025-2030 (%)

10.6 Market opportunity by Usage

Market opportunity by Usage ($ million)
Data Table on Market opportunity by Usage ($ million)

11. Customer Landscape

11.1 Customer landscape overview

Analysis of price sensitivity, lifecycle, customer purchase basket, adoption rates, and purchase criteria

12. Geographic Landscape

12.1 Geographic segmentation

Chart on Market share by geography 2025-2030 (%)
Data Table on Market share by geography 2025-2030 (%)

12.2 Geographic comparison

Chart on Geographic comparison
Data Table on Geographic comparison

12.3 APAC - Market size and forecast 2025-2030

Chart on APAC - Market size and forecast 2025-2030 ($ million)
Data Table on APAC - Market size and forecast 2025-2030 ($ million)
Chart on APAC - Year-over-year growth 2025-2030 (%)
Data Table on APAC - Year-over-year growth 2025-2030 (%)
Chart on Regional Comparison - APAC
Data Table on Regional Comparison - APAC

12.3.1 China - Market size and forecast 2025-2030

Chart on China - Market size and forecast 2025-2030 ($ million)
Data Table on China - Market size and forecast 2025-2030 ($ million)
Chart on China - Year-over-year growth 2025-2030 (%)
Data Table on China - Year-over-year growth 2025-2030 (%)

12.3.2 Japan - Market size and forecast 2025-2030

Chart on Japan - Market size and forecast 2025-2030 ($ million)
Data Table on Japan - Market size and forecast 2025-2030 ($ million)
Chart on Japan - Year-over-year growth 2025-2030 (%)
Data Table on Japan - Year-over-year growth 2025-2030 (%)

12.3.3 South Korea - Market size and forecast 2025-2030

Chart on South Korea - Market size and forecast 2025-2030 ($ million)
Data Table on South Korea - Market size and forecast 2025-2030 ($ million)
Chart on South Korea - Year-over-year growth 2025-2030 (%)
Data Table on South Korea - Year-over-year growth 2025-2030 (%)

12.3.4 India - Market size and forecast 2025-2030

Chart on India - Market size and forecast 2025-2030 ($ million)
Data Table on India - Market size and forecast 2025-2030 ($ million)
Chart on India - Year-over-year growth 2025-2030 (%)
Data Table on India - Year-over-year growth 2025-2030 (%)

12.3.5 Indonesia - Market size and forecast 2025-2030

Chart on Indonesia - Market size and forecast 2025-2030 ($ million)
Data Table on Indonesia - Market size and forecast 2025-2030 ($ million)
Chart on Indonesia - Year-over-year growth 2025-2030 (%)
Data Table on Indonesia - Year-over-year growth 2025-2030 (%)

12.3.6 Australia - Market size and forecast 2025-2030

Chart on Australia - Market size and forecast 2025-2030 ($ million)
Data Table on Australia - Market size and forecast 2025-2030 ($ million)
Chart on Australia - Year-over-year growth 2025-2030 (%)
Data Table on Australia - Year-over-year growth 2025-2030 (%)

12.4 Europe - Market size and forecast 2025-2030

Chart on Europe - Market size and forecast 2025-2030 ($ million)
Data Table on Europe - Market size and forecast 2025-2030 ($ million)
Chart on Europe - Year-over-year growth 2025-2030 (%)
Data Table on Europe - Year-over-year growth 2025-2030 (%)
Chart on Regional Comparison - Europe
Data Table on Regional Comparison - Europe

12.4.1 Germany - Market size and forecast 2025-2030

Chart on Germany - Market size and forecast 2025-2030 ($ million)
Data Table on Germany - Market size and forecast 2025-2030 ($ million)
Chart on Germany - Year-over-year growth 2025-2030 (%)
Data Table on Germany - Year-over-year growth 2025-2030 (%)

12.4.2 UK - Market size and forecast 2025-2030

Chart on UK - Market size and forecast 2025-2030 ($ million)
Data Table on UK - Market size and forecast 2025-2030 ($ million)
Chart on UK - Year-over-year growth 2025-2030 (%)
Data Table on UK - Year-over-year growth 2025-2030 (%)

12.4.3 France - Market size and forecast 2025-2030

Chart on France - Market size and forecast 2025-2030 ($ million)
Data Table on France - Market size and forecast 2025-2030 ($ million)
Chart on France - Year-over-year growth 2025-2030 (%)
Data Table on France - Year-over-year growth 2025-2030 (%)

12.4.4 Italy - Market size and forecast 2025-2030

Chart on Italy - Market size and forecast 2025-2030 ($ million)
Data Table on Italy - Market size and forecast 2025-2030 ($ million)
Chart on Italy - Year-over-year growth 2025-2030 (%)
Data Table on Italy - Year-over-year growth 2025-2030 (%)

12.4.5 The Netherlands - Market size and forecast 2025-2030

Chart on The Netherlands - Market size and forecast 2025-2030 ($ million)
Data Table on The Netherlands - Market size and forecast 2025-2030 ($ million)
Chart on The Netherlands - Year-over-year growth 2025-2030 (%)
Data Table on The Netherlands - Year-over-year growth 2025-2030 (%)

12.4.6 Spain - Market size and forecast 2025-2030

Chart on Spain - Market size and forecast 2025-2030 ($ million)
Data Table on Spain - Market size and forecast 2025-2030 ($ million)
Chart on Spain - Year-over-year growth 2025-2030 (%)
Data Table on Spain - Year-over-year growth 2025-2030 (%)

12.5 North America - Market size and forecast 2025-2030

Chart on North America - Market size and forecast 2025-2030 ($ million)
Data Table on North America - Market size and forecast 2025-2030 ($ million)
Chart on North America - Year-over-year growth 2025-2030 (%)
Data Table on North America - Year-over-year growth 2025-2030 (%)
Chart on Regional Comparison - North America
Data Table on Regional Comparison - North America

12.5.1 US - Market size and forecast 2025-2030

Chart on US - Market size and forecast 2025-2030 ($ million)
Data Table on US - Market size and forecast 2025-2030 ($ million)
Chart on US - Year-over-year growth 2025-2030 (%)
Data Table on US - Year-over-year growth 2025-2030 (%)

12.5.2 Canada - Market size and forecast 2025-2030

Chart on Canada - Market size and forecast 2025-2030 ($ million)
Data Table on Canada - Market size and forecast 2025-2030 ($ million)
Chart on Canada - Year-over-year growth 2025-2030 (%)
Data Table on Canada - Year-over-year growth 2025-2030 (%)

12.5.3 Mexico - Market size and forecast 2025-2030

Chart on Mexico - Market size and forecast 2025-2030 ($ million)
Data Table on Mexico - Market size and forecast 2025-2030 ($ million)
Chart on Mexico - Year-over-year growth 2025-2030 (%)
Data Table on Mexico - Year-over-year growth 2025-2030 (%)

12.6 South America - Market size and forecast 2025-2030

Chart on South America - Market size and forecast 2025-2030 ($ million)
Data Table on South America - Market size and forecast 2025-2030 ($ million)
Chart on South America - Year-over-year growth 2025-2030 (%)
Data Table on South America - Year-over-year growth 2025-2030 (%)
Chart on Regional Comparison - South America
Data Table on Regional Comparison - South America

12.6.1 Brazil - Market size and forecast 2025-2030

Chart on Brazil - Market size and forecast 2025-2030 ($ million)
Data Table on Brazil - Market size and forecast 2025-2030 ($ million)
Chart on Brazil - Year-over-year growth 2025-2030 (%)
Data Table on Brazil - Year-over-year growth 2025-2030 (%)

12.6.2 Argentina - Market size and forecast 2025-2030

Chart on Argentina - Market size and forecast 2025-2030 ($ million)
Data Table on Argentina - Market size and forecast 2025-2030 ($ million)
Chart on Argentina - Year-over-year growth 2025-2030 (%)
Data Table on Argentina - Year-over-year growth 2025-2030 (%)

12.6.3 Chile - Market size and forecast 2025-2030

Chart on Chile - Market size and forecast 2025-2030 ($ million)
Data Table on Chile - Market size and forecast 2025-2030 ($ million)
Chart on Chile - Year-over-year growth 2025-2030 (%)
Data Table on Chile - Year-over-year growth 2025-2030 (%)

12.7 Middle East and Africa - Market size and forecast 2025-2030

Chart on Middle East and Africa - Market size and forecast 2025-2030 ($ million)
Data Table on Middle East and Africa - Market size and forecast 2025-2030 ($ million)
Chart on Middle East and Africa - Year-over-year growth 2025-2030 (%)
Data Table on Middle East and Africa - Year-over-year growth 2025-2030 (%)
Chart on Regional Comparison - Middle East and Africa
Data Table on Regional Comparison - Middle East and Africa

12.7.1 Saudi Arabia - Market size and forecast 2025-2030

Chart on Saudi Arabia - Market size and forecast 2025-2030 ($ million)
Data Table on Saudi Arabia - Market size and forecast 2025-2030 ($ million)
Chart on Saudi Arabia - Year-over-year growth 2025-2030 (%)
Data Table on Saudi Arabia - Year-over-year growth 2025-2030 (%)

12.7.2 UAE - Market size and forecast 2025-2030

Chart on UAE - Market size and forecast 2025-2030 ($ million)
Data Table on UAE - Market size and forecast 2025-2030 ($ million)
Chart on UAE - Year-over-year growth 2025-2030 (%)
Data Table on UAE - Year-over-year growth 2025-2030 (%)

12.7.3 South Africa - Market size and forecast 2025-2030

Chart on South Africa - Market size and forecast 2025-2030 ($ million)
Data Table on South Africa - Market size and forecast 2025-2030 ($ million)
Chart on South Africa - Year-over-year growth 2025-2030 (%)
Data Table on South Africa - Year-over-year growth 2025-2030 (%)

12.7.4 Turkey - Market size and forecast 2025-2030

Chart on Turkey - Market size and forecast 2025-2030 ($ million)
Data Table on Turkey - Market size and forecast 2025-2030 ($ million)
Chart on Turkey - Year-over-year growth 2025-2030 (%)
Data Table on Turkey - Year-over-year growth 2025-2030 (%)

12.7.5 Israel - Market size and forecast 2025-2030

Chart on Israel - Market size and forecast 2025-2030 ($ million)
Data Table on Israel - Market size and forecast 2025-2030 ($ million)
Chart on Israel - Year-over-year growth 2025-2030 (%)
Data Table on Israel - Year-over-year growth 2025-2030 (%)

12.8 Market opportunity by geography

Market opportunity by geography ($ million)
Data Tables on Market opportunity by geography ($ million)

13. Drivers, Challenges, and Opportunity

13.1 Market drivers

Inclusion of high-voltage electric vehicle power distribution architectures
Strategic proliferation of generative AI and hyperscale data infrastructure
Growth of intelligent edge computing and autonomous device

13.2 Market challenges

Thermal dissipation constraints in high-density semiconductor architectures
Interoperability conflicts between heterogeneous proprietary power protocols
Escalating regulatory rigor regarding energy efficiency and material provenance

13.3 Impact of drivers and challenges

Impact of drivers and challenges in 2025 and 2030

13.4 Market opportunities

Expansion of silicon carbide and gallium nitride architectures
Integration of AI-driven workload aware power management
Advancements in multi-channel integrated battery management

14. Competitive Landscape

14.1 Overview

14.2

Overview on criticality of inputs and factors of differentiation

14.3 Landscape disruption

Overview on factors of disruption

14.4 Industry risks

Impact of key risks on business

15. Competitive Analysis

15.1 Companies profiled

Companies covered

15.2 Company ranking index

15.3 Market positioning of companies

Matrix on companies position and classification

15.4 Allegro MicroSystems Inc.

Allegro MicroSystems Inc. - Overview
Allegro MicroSystems Inc. - Product / Service
Allegro MicroSystems Inc. - Key offerings
SWOT

15.5 Analog Devices Inc.

Analog Devices Inc. - Overview
Analog Devices Inc. - Business segments
Analog Devices Inc. - Key offerings
Analog Devices Inc. - Segment focus
SWOT

15.6 Infineon Technologies AG

Infineon Technologies AG - Overview
Infineon Technologies AG - Business segments
Infineon Technologies AG - Key news
Infineon Technologies AG - Key offerings
Infineon Technologies AG - Segment focus
SWOT

15.7 Microchip Technology Inc.

Microchip Technology Inc. - Overview
Microchip Technology Inc. - Business segments
Microchip Technology Inc. - Key offerings
Microchip Technology Inc. - Segment focus
SWOT

15.8 MinebeaMitsumi Inc.

MinebeaMitsumi Inc. - Overview
MinebeaMitsumi Inc. - Business segments
MinebeaMitsumi Inc. - Key offerings
MinebeaMitsumi Inc. - Segment focus
SWOT

15.9 Monolithic Power Systems Inc.

Monolithic Power Systems Inc. - Overview
Monolithic Power Systems Inc. - Product / Service
Monolithic Power Systems Inc. - Key news
Monolithic Power Systems Inc. - Key offerings
SWOT

15.10 NXP Semiconductors NV

NXP Semiconductors NV - Overview
NXP Semiconductors NV - Business segments
NXP Semiconductors NV - Key news
NXP Semiconductors NV - Key offerings
NXP Semiconductors NV - Segment focus
SWOT

15.11 ON Semiconductor Corp.

ON Semiconductor Corp. - Overview
ON Semiconductor Corp. - Business segments
ON Semiconductor Corp. - Key news
ON Semiconductor Corp. - Key offerings
ON Semiconductor Corp. - Segment focus
SWOT

15.12 Qualcomm Inc.

Qualcomm Inc. - Overview
Qualcomm Inc. - Business segments
Qualcomm Inc. - Key news
Qualcomm Inc. - Key offerings
Qualcomm Inc. - Segment focus
SWOT

15.13 Renesas Electronics Corp.

Renesas Electronics Corp. - Overview
Renesas Electronics Corp. - Business segments
Renesas Electronics Corp. - Key offerings
Renesas Electronics Corp. - Segment focus
SWOT

15.14 ROHM Co. Ltd.

ROHM Co. Ltd. - Overview
ROHM Co. Ltd. - Business segments
ROHM Co. Ltd. - Key news
ROHM Co. Ltd. - Key offerings
ROHM Co. Ltd. - Segment focus
SWOT

15.15 Semtech Corp.

Semtech Corp. - Overview
Semtech Corp. - Business segments
Semtech Corp. - Key offerings
Semtech Corp. - Segment focus
SWOT

15.16 STMicroelectronics NV

STMicroelectronics NV - Overview
STMicroelectronics NV - Business segments
STMicroelectronics NV - Key offerings
STMicroelectronics NV - Segment focus
SWOT

15.17 Texas Instruments Inc.

Texas Instruments Inc. - Overview
Texas Instruments Inc. - Business segments
Texas Instruments Inc. - Key offerings
Texas Instruments Inc. - Segment focus
SWOT

15.18 Vishay Intertechnology Inc.

Vishay Intertechnology Inc. - Overview
Vishay Intertechnology Inc. - Business segments
Vishay Intertechnology Inc. - Key news
Vishay Intertechnology Inc. - Key offerings
Vishay Intertechnology Inc. - Segment focus
SWOT

16. Appendix

16.1 Scope of the report

Market definition
Objectives
Notes and caveats

16.2 Inclusions and exclusions checklist

Inclusions checklist
Exclusions checklist

16.3 Currency conversion rates for US$

16.4 Research methodology

16.5 Data procurement

Information sources

16.6 Data validation

16.7 Validation techniques employed for market sizing

16.8 Data synthesis

16.9 360 degree market analysis

16.10 List of abbreviations

Research Methodology

Technavio presents a detailed picture of the market by way of study, synthesis, and summation of data from multiple sources. The analysts have presented the various facets of the market with a particular focus on identifying the key industry influencers. The data thus presented is comprehensive, reliable, and the result of extensive research, both primary and secondary.

INFORMATION SOURCES

Primary sources

  • Manufacturers and suppliers
  • Channel partners
  • Industry experts
  • Strategic decision makers

Secondary sources

  • Industry journals and periodicals
  • Government data
  • Financial reports of key industry players
  • Historical data
  • Press releases

DATA ANALYSIS

Data Synthesis

  • Collation of data
  • Estimation of key figures
  • Analysis of derived insights

Data Validation

  • Triangulation with data models
  • Reference against proprietary databases
  • Corroboration with industry experts

REPORT WRITING

Qualitative

  • Market drivers
  • Market challenges
  • Market trends
  • Five forces analysis

Quantitative

  • Market size and forecast
  • Market segmentation
  • Geographical insights
  • Competitive landscape

Interested in this report?

Get your sample now to see our research methodology and insights!

Download Now

Frequently Asked Questions

Power Management Integrated Circuit (PMIC) market growth will increase by USD 11642.9 million during 2026-2030.

The Power Management Integrated Circuit (PMIC) market is expected to grow at a CAGR of 5.4% during 2026-2030.

Power Management Integrated Circuit (PMIC) market is segmented by Product (Voltage regulators, Motor control integrated circuit, Integrated ASSP power management integrated circuit, Battery management integrated circuit, Others) End-user (Automotive and transportation, Consumer electronics, Industrial, Telecom and networking, Others) Usage (Between 5V to 15V, Below 5V, Above 15V)

Allegro MicroSystems Inc., Analog Devices Inc., Cactus Semiconductor Inc, Infineon Technologies AG, JLCPCB, MagnaChip Semiconductor Corp., Microchip Technology Inc., MinebeaMitsumi Inc., Monolithic Power Systems Inc., Nordic Semiconductor ASA, NXP Semiconductors NV, ON Semiconductor Corp., Qorvo Inc., Qualcomm Inc., Renesas Electronics Corp., ROHM Co. Ltd., Semtech Corp., STMicroelectronics NV, Texas Instruments Inc., Vishay Intertechnology Inc. are a few of the key vendors in the Power Management Integrated Circuit (PMIC) market.

APAC will register the highest growth rate of 44.4% among the other regions. Therefore, the Power Management Integrated Circuit (PMIC) market in APAC is expected to garner significant business opportunities for the vendors during the forecast period.

China, Japan, South Korea, India, Indonesia, Australia, Germany, UK, France, Italy, The Netherlands, Spain, US, Canada, Mexico, Brazil, Argentina, Chile, Saudi Arabia, UAE, South Africa, Turkey, Israel

  • Inclusion of high-voltage electric vehicle power distribution architectures is the driving factor this market.

The Power Management Integrated Circuit (PMIC) market vendors should focus on grabbing business opportunities from the Product segment as it accounted for the largest market share in the base year.
RIA - Research AI Assistant
Ask RIA