Decorative Pavement Material Market Size 2025-2029
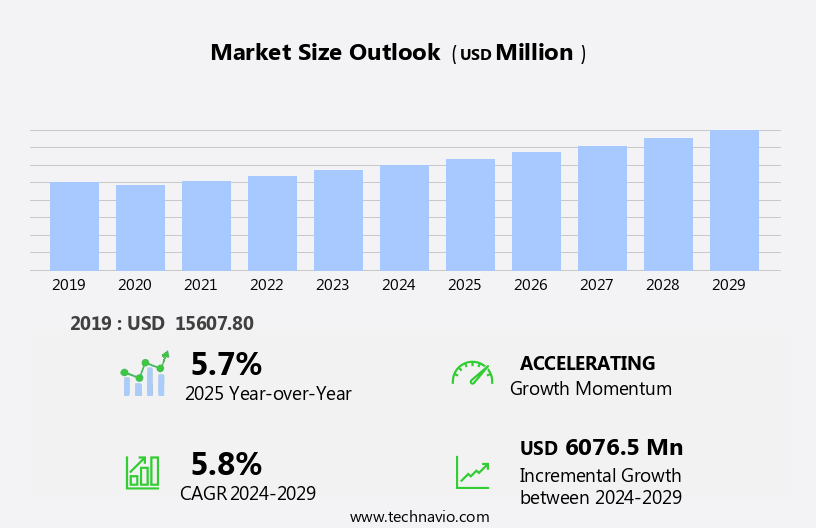
The decorative pavement material market size is forecast to increase by USD 6.08 billion at a CAGR of 5.8% between 2024 and 2029.
- The market is experiencing significant growth due to key trends such as urbanization and infrastructure development. Sustainability and eco-friendliness are increasingly important factors influencing market growth, leading to the rising adoption of green concrete as a popular decorative pavement material. Recycled and bio-based materials, such as recycled rubber, crushed glass, and reclaimed concrete, are gaining traction due to their waste-reducing and environmentally friendly properties. Green concrete, which is produced using supplementary cementitious materials and recycled aggregates, not only reduces carbon emissions but also offers excellent durability and aesthetic appeal. Additionally, stringent government regulations and compliance requirements are driving the market towards the use of sustainable materials to minimize environmental impact. These factors are expected to continue shaping the market In the coming years.
What will be the Size of the Decorative Pavement Material Market During the Forecast Period?
- The market encompasses a wide range of products and applications, including concrete design software, high-strength concrete, retail outlets for concrete flooring options, and various concrete building materials. This market is driven by the growing demand for unique and sustainable design elements in both indoor and outdoor spaces, such as residential and commercial buildings, outdoor recreation areas, and architectural projects. Decorative concrete patterns, stamped concrete designs, and surface treatments are popular trends, offering cost-effective and durable solutions for enhancing the aesthetic appeal of concrete structures.
- Sustainability is also a significant factor, with eco-friendly materials, green concrete solutions, and low-impact construction methods gaining traction. Innovation in concrete mix design, performance, and certification continues to drive growth in this market, as does the increasing focus on concrete restoration, maintenance, and recycling to minimize environmental impact. Overall, the market is expected to experience steady growth due to its versatility, durability, and ability to cater to diverse design preferences.
How is this Decorative Pavement Material Industry segmented and which is the largest segment?
The decorative pavement material industry research report provides comprehensive data (region-wise segment analysis), with forecasts and estimates in "USD billion" for the period 2025-2029, as well as historical data from 2019-2023 for the following segments.
- Material
- Concrete
- Natural stone
- Tiles
- Ceramics
- Others
- End-user
- Non residential
- Residential
- Geography
- North America
- Canada
- US
- Europe
- Germany
- UK
- France
- Italy
- APAC
- China
- India
- Japan
- Middle East and Africa
- South America
- North America
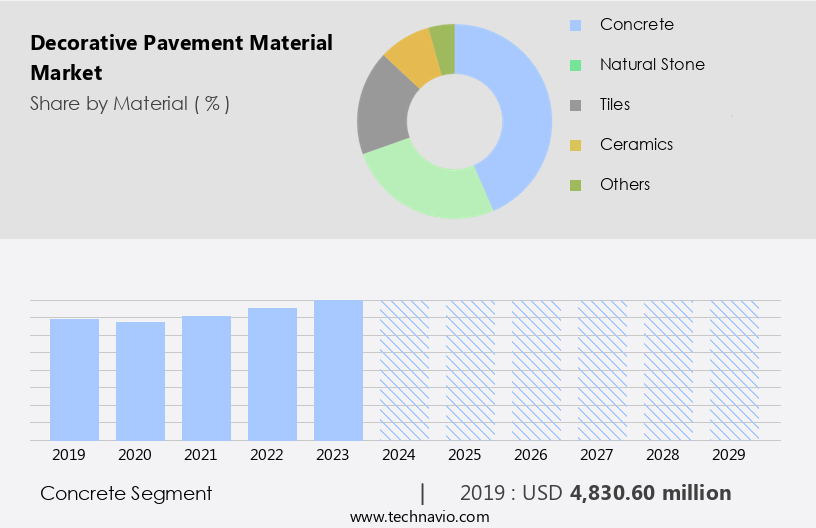
By Material Insights
- The concrete segment is estimated to witness significant growth during the forecast period. The market is dominated by concrete due to its strength, versatility, and cost-effectiveness. Concrete's widespread usage extends to various applications such as residential driveways, commercial walkways, patios, plazas, and recreational centers. Decorative concrete offers numerous forms, including stamped concrete, which mimics natural stone, brick, or wood, and stained concrete, which uses acid or water-based stains to create unique color effects.
- These customizable options cater to diverse aesthetic and functional requirements, making concrete a preferred choice for housing construction, healthcare facilities, educational institutions, hotels, and more. Concrete's durability, environmental safety, and eco-friendly properties contribute to its increasing popularity. Technological advancements, such as additives, admixtures, and superior finish techniques, further enhance concrete's appeal. Easy installation, quicker installation technologies, and design consultants cater to consumer preference and environmental safety regulations. Concrete's versatility and aesthetic appeal make it a valuable resource-efficient investment for buildings and green structures.
Get a glance at the market report of share of various segments Request Free Sample
- The concrete segment was valued at USD 4.83 billion in 2019 and showed a gradual increase during the forecast period.
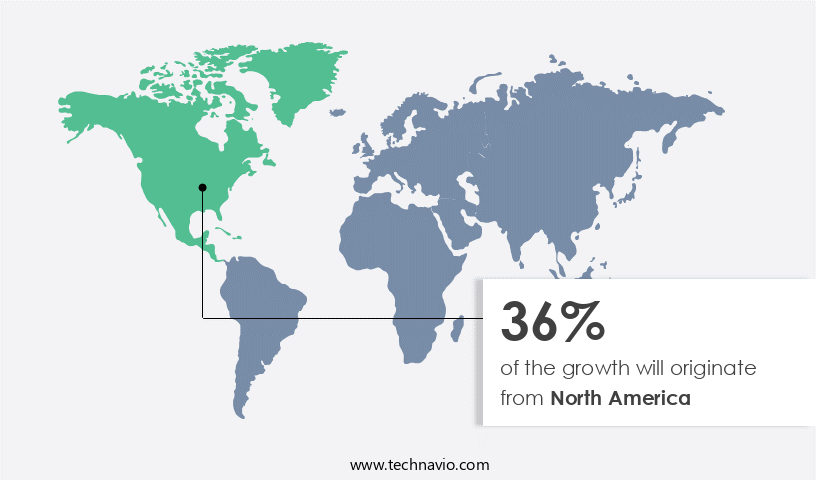
Regional Analysis
- North America is estimated to contribute 36% to the growth of the global market during the forecast period. Technavio's analysts have elaborately explained the regional trends and drivers that shape the market during the forecast period. The North American market is experiencing significant growth due to increasing urbanization and substantial investments In the construction sector. With approximately 82% of North America's population living in urban areas as of 2022, the demand for infrastructure and residential development is high. In the US, construction spending reached an all-time high of approximately USD 1.6 trillion in 2023, fueled by investments from both the private and public sectors.
For more insights on the market size of various regions, Request Free Sample
- The residential construction sector, in particular, has seen robust growth, driven by a strong housing market and low interest rates, leading to an increase in new home construction and renovation projects. Decorative pavement materials, including textured surfaces, decorative concrete, pavers, floors, and stamped concrete, are in high demand for both new construction and renovation purposes. These materials offer versatility, superior finish, and easy installation, making them cost-effective and customizable options for various applications, such as recreation centers, housing construction, healthcare facilities, educational institutions, hotels, and countertops. Additionally, the use of eco-friendly and resource-efficient materials, such as bamboo, stone, and concrete mix with additives, is gaining popularity due to consumer preference and environmental safety regulations. Technological advancements, including the use of oxide pigments and new techniques, continue to enhance the aesthetic appeal and structural capabilities of decorative pavement materials. Architects and designers are incorporating these materials into their projects to create visually appealing and functional spaces while adhering to environmental friendly and green building practices.
Market Dynamics
Our researchers analyzed the data with 2024 as the base year, along with the key drivers, trends, and challenges. A holistic analysis of drivers will help companies refine their marketing strategies to gain a competitive advantage.
What are the key market drivers leading to the rise In the adoption of Decorative Pavement Material Industry?
- The urbanization and infrastructure development is the key driver of the market. The market is experiencing significant growth due to urbanization and infrastructure development. According to the United Nations Department of Economic and Social Affairs (UN DESA), over 55% of the world's population lived in urban areas as of 2024, with this figure projected to reach 68% by 2050. This trend necessitates extensive infrastructure development to accommodate growing urban populations, leading to increased demand for decorative pavement materials. In India, the government's commitment to infrastructure development is evident In the Union Budget 2024-25, where Finance Minister Smt. Nirmala Sitharaman allocated USD 133.5 billion for capital expenditure, representing 3.4% of the country's GDP.
- Decorative pavement materials, such as textured surfaces, decorative concrete, pavers, and stamped concrete, are gaining popularity due to their aesthetic appeal, easy installation, and cost-effectiveness. These materials are being used not only for floors in recreation centers, housing construction, healthcare facilities, educational institutions, and hotels but also for countertops and home decor. Moreover, the use of eco-friendly and resource-efficient materials, such as bamboo, is on the rise due to consumer preference and environmental safety regulations. Technological advancements, including additives, admixtures, bitumen, and oxide pigments, are enhancing the durability and superior finish of decorative pavement materials. Design consultants and architects are increasingly incorporating these materials into their projects due to their versatile features and structural capabilities. Overall, the market is expected to continue growing as urbanization and infrastructure development continue to be a priority for governments and businesses worldwide.
What are the market trends shaping the Decorative Pavement Material Industry?
- The rising adoption of sustainable and eco-friendly materials is the upcoming market trend. The market is experiencing a notable shift towards sustainable and eco-friendly options. This trend is fueled by the increasing focus on green infrastructure, which aims to address urban flooding and minimize heat islands through the use of permeable paving solutions. These solutions enable water to penetrate the pavement, reducing surface runoff and promoting groundwater recharge. Government regulations advocating for low-carbon and energy-efficient construction practices are also driving the adoption of sustainable alternatives. Decorative concrete, textured surfaces, pavers, and floors made from these materials offer aesthetic appeal while contributing to environmental safety and sustainability.
- Additives, such as admixtures and oxide pigments, enhance the durability and versatility of these materials. Cost-effective and quicker installation, coupled with easy customization, make decorative pavement materials an attractive choice for various applications, including recreation centers, housing construction, healthcare facilities, hotels, educational institutions, and renovation projects. Technological advancements continue to expand design options and new techniques, allowing for superior finishes and resource-efficient production. Architects and designers increasingly prioritize eco-friendly and green building practices, which further boosts the demand for decorative pavement materials. Consumer preference for sustainable and durable materials, along with environmental safety regulations, adds to the market's growth. Bamboo, bricks, countertops, and other materials can also be used in decorative pavement applications, offering a wide range of aesthetic possibilities. The market is expected to continue expanding, driven by the increasing importance of environmental friendliness and resource efficiency in construction activities and capital investments.
What challenges does the Decorative Pavement Material Industry face during its growth?
- Stringent government regulations and compliance requirements is a key challenge affecting the industry growth. The market encounters regulatory challenges due to stringent environmental safety regulations. These regulations influence material selection, production processes, and installation standards, primarily driven by environmental sustainability concerns. For instance, the European Union's Emissions Trading System (EUETS) mandates manufacturers to reduce CO2 emissions or purchase carbon credits, increasing production costs. Similarly, the US Environmental Protection Agency (EPA) enforces regulations on dust control and water runoff from production sites, affecting both manufacturing and installation processes. Decorative pavement materials, such as textured surfaces, decorative concrete, pavers, floors, and stamped concrete, are increasingly popular due to their aesthetic appeal and versatility. However, the use of additives like oxide pigments and admixtures in concrete mixes, as well as the production and installation of materials like bitumen and bamboo, contribute to environmental concerns.
- To address these challenges, technological advancements in eco-friendly techniques and resource-efficient materials, such as recycled concrete and permeable pavers, are gaining popularity. Additionally, consumer preference for green buildings and capital investments in energy-efficient structures are driving product developments In the market. Despite these challenges, the market remains cost-effective and offers quicker installation and customizable design options for various applications, including recreation centers, housing construction, healthcare facilities, hotels, educational institutions, and home decor. Design consultants and architects continue to explore new techniques and materials to enhance the structural capabilities and aesthetic appeal while adhering to environmental friendly and green building regulations.
Exclusive Customer Landscape
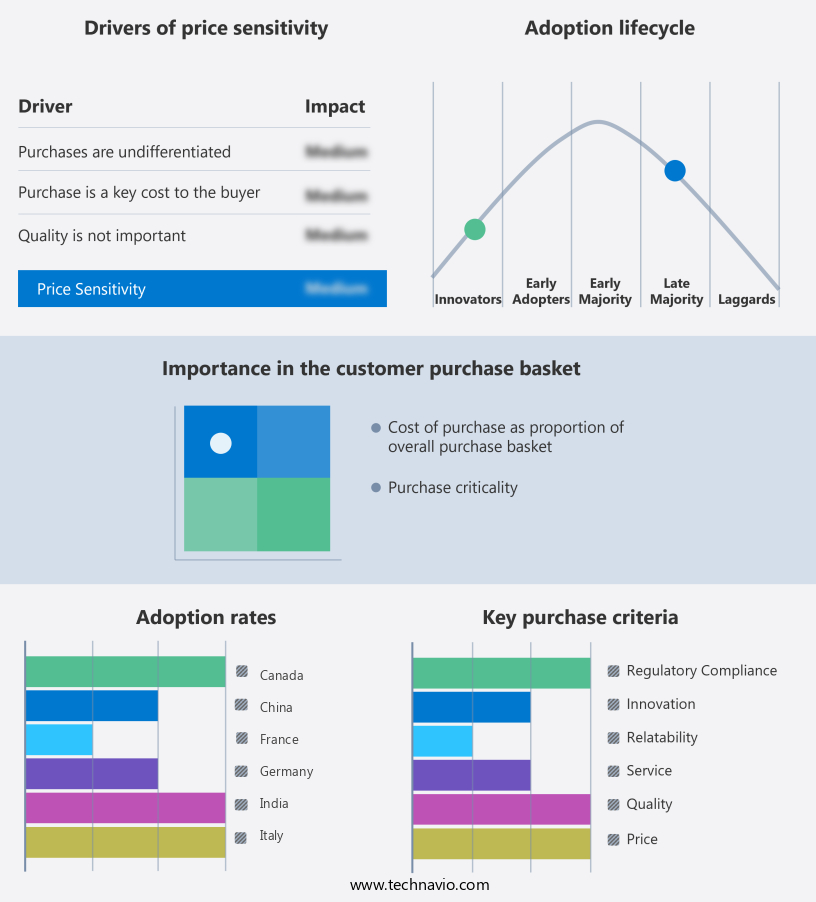
The market forecasting report includes the adoption lifecycle of the market, covering from the innovator's stage to the laggard's stage. It focuses on adoption rates in different regions based on penetration. Furthermore, the market report also includes key purchase criteria and drivers of price sensitivity to help companies evaluate and develop their market growth analysis strategies.
Customer Landscape
Key Companies & Market Insights
Companies are implementing various strategies, such as strategic alliances, market forecast, partnerships, mergers and acquisitions, geographical expansion, and product/service launches, to enhance their presence In the industry.
The industry research and growth report includes detailed analyses of the competitive landscape of the market and information about key companies, including:
- Angelus Block Co. Inc.
- Bowland Stone
- Breedon Group plc
- Brett
- Cambridge Pavers Inc.
- CEMEX SAB de CV
- Ketley Brick Co. Ltd.
- Marshalls plc
- Mutual Materials
- Oldcastle APG Inc.
- Pavestone Inc.
- Pine Hall Brick Co.
- PPG Industries Inc.
- Shamrock Building Materials LLC
- Sika AG
- Stonecraft Paving
- Superior Precast Products Inc.
- Techo-Bloc Inc.
- U.S. Paverscape Inc.
- Unilock Ltd.
- Wienerberger AG
Qualitative and quantitative analysis of companies has been conducted to help clients understand the wider business environment as well as the strengths and weaknesses of key industry players. Data is qualitatively analyzed to categorize companies as pure play, category-focused, industry-focused, and diversified; it is quantitatively analyzed to categorize companies as dominant, leading, strong, tentative, and weak.
Research Analyst Overview
Decorative pavement materials have gained significant traction in various sectors due to their ability to enhance the aesthetic appeal of structures while providing functional benefits. Textured surfaces, such as decorative concrete and pavers, have become popular choices for floors in recreational centers, housing construction, healthcare facilities, educational institutions, hotels, and other buildings. The market for decorative pavement materials is driven by several factors. Strength and durability are essential considerations for these materials, as they must withstand heavy foot traffic and environmental conditions. Consequently, concrete mixes with added additives and admixtures are frequently used to improve the strength and longevity of decorative concrete and pavers. Moreover, versatility is a significant factor In their growing popularity. These materials can mimic the look of wood, stone, and other natural materials, providing a cost-effective alternative to their natural counterparts.
Additionally, they offer quicker installation and easier customization, making them an attractive option for renovation purposes. Technological advancements have played a crucial role In the development. For instance, stamped concrete and oxide pigments have enabled the creation of intricate designs and patterns, enhancing the aesthetic appeal of structures. Furthermore, eco-friendly and resource-efficient materials, such as bamboo and recycled rubber, have gained popularity due to increasing consumer preference for environmental safety and regulatory compliance. Design consultants and architects have embraced decorative pavement materials due to their versatile features and superior finish. These materials offer various design options, allowing for customizable solutions tailored to specific project requirements. Additionally, their structural capabilities make them suitable for a range of applications, from countertops and home decor to large-scale construction projects. Despite the numerous benefits, labor costs remain a significant challenge for suppliers and contractors.
However, ongoing research and development efforts are focused on creating new techniques and technologies to reduce installation time and labor requirements, making these materials even more cost-effective and attractive to consumers. Thus, the market is characterized by continuous innovation and growth, driven by factors such as consumer preference, environmental safety regulations, and technological advancements. These materials offer a range of benefits, including durability, versatility, and aesthetic appeal, making them a popular choice for various sectors, from residential structures to commercial buildings and renovation projects. The Decorative Pavement Material Market is witnessing significant growth due to the increasing demand for unique and sustainable concrete solutions for outdoor recreation spaces. High-strength concrete, with its durability and design flexibility, is a popular choice for concrete construction projects, renovation ideas, and architectural concrete applications. Concrete suppliers offer a concrete supplier directory, providing inspiration for concrete projects, certification, and innovative treatment options. Concrete maintenance tips ensure the longevity of these installations, while concrete sustainability and recycling efforts reduce the concrete carbon footprint.
Concrete design trends include decorative concrete finishes, such as stamped, stained, or polished surfaces, and concrete surface treatments like texturing and coloring. Concrete performance, durability, and cost analysis are crucial factors in concrete project planning. Concrete policies and standards ensure the quality and safety of concrete materials, techniques, and repair services. Sustainable concrete and concrete environmental impact are essential considerations for eco-conscious projects. Concrete technology continues to evolve, offering new applications and treatment cost savings. Concrete repair and maintenance are essential for maintaining the aesthetic appeal and functionality of these installations. Concrete colors, concrete development, and concrete construction projects showcase the versatility and innovation of this versatile material. In summary, the Decorative Pavement Material Market offers a wide range of high-strength, sustainable, and innovative concrete solutions for various applications, from outdoor recreation spaces to architectural projects.
|
Market Scope |
|
|
Report Coverage |
Details |
|
Page number |
210 |
|
Base year |
2024 |
|
Historic period |
2019-2023 |
|
Forecast period |
2025-2029 |
|
Growth momentum & CAGR |
Accelerate at a CAGR of 5.8% |
|
Market growth 2025-2029 |
USD 6.08 billion |
|
Market structure |
Fragmented |
|
YoY growth 2024-2025(%) |
5.7 |
|
Key countries |
US, China, Germany, Canada, UK, France, India, Japan, Italy, and The Netherlands |
|
Competitive landscape |
Leading Companies, Market Positioning of Companies, Competitive Strategies, and Industry Risks |
What are the Key Data Covered in this Market Research and Growth Report?
- CAGR of the industry during the forecast period
- Detailed information on factors that will drive the growth and forecasting between 2025 and 2029
- Precise estimation of the size of the market and its contribution of the industry in focus to the parent market
- Accurate predictions about upcoming growth and trends and changes in consumer behaviour
- Growth of the market across North America, Europe, APAC, Middle East and Africa, and South America
- Thorough analysis of the market's competitive landscape and detailed information about companies
- Comprehensive analysis of factors that will challenge the market growth of industry companies
We can help! Our analysts can customize this market research report to meet your requirements.
 RIA -
RIA - 
