Delta Robots Market Analysis, Size, and Forecast 2025-2029: APAC (China, Japan, and India), Europe (Germany, UK, and France), North America (US, Canada, and Mexico), South America (Brazil, Argentina, and Colombia), Middle East and Africa (Saudi Arabia, UAE, and South Africa), and Rest of World (ROW)

Delta Robots Market Analysis, Size, and Forecast 2025-2029:
APAC (China, Japan, and India), Europe (Germany, UK, and France), North America (US, Canada, and Mexico), South America (Brazil, Argentina, and Colombia), Middle East and Africa (Saudi Arabia, UAE, and South Africa), and Rest of World (ROW)

Published: Dec 2025 301 Pages SKU: IRTNTR71854

Market Overview at a Glance

$2.12 B
Market Opportunity
16.8%
CAGR 2024 - 2029
51%
APAC Growth
$618.8 Mn
4 Axis segment 2023

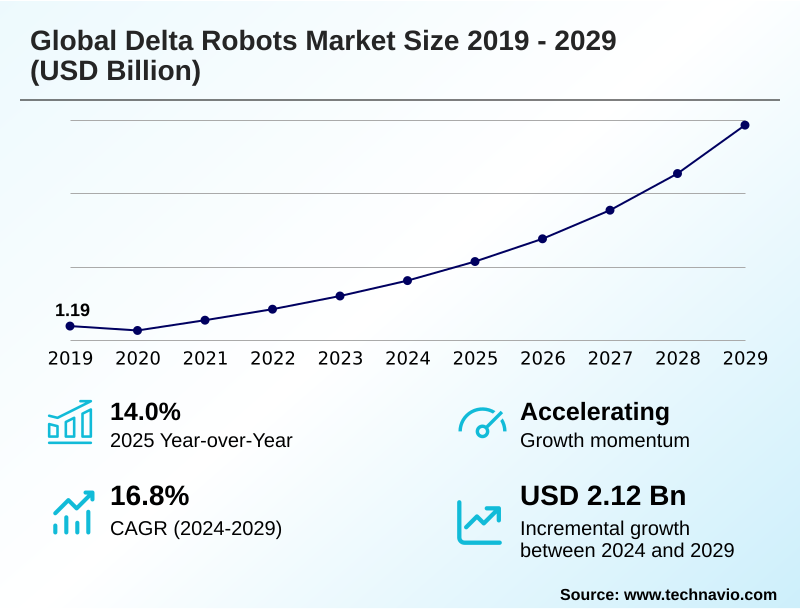
Delta Robots Market Size 2025-2029

The delta robots market size is valued to increase by USD 2.12 billion, at a CAGR of 16.8% from 2024 to 2029. Growing demand for delta robots in packaging applications will drive the delta robots market.

Major Market Trends & Insights

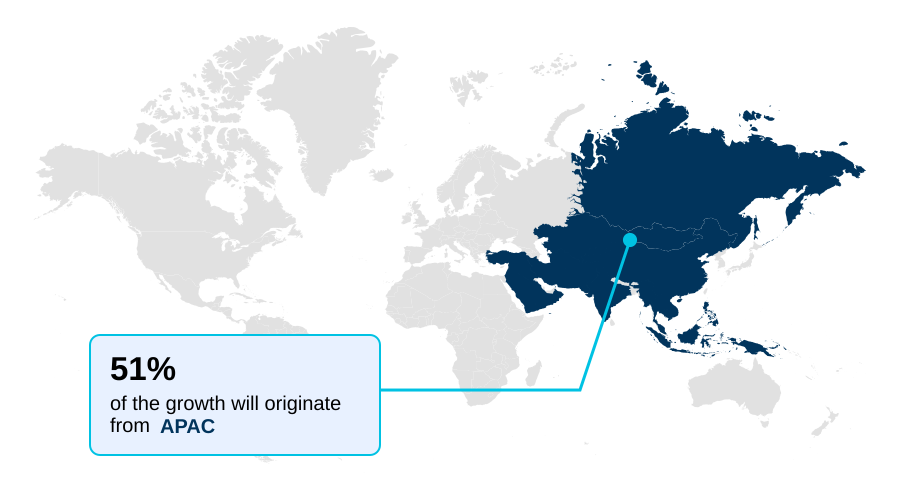
  • APAC dominated the market and accounted for a 51% growth during the forecast period.
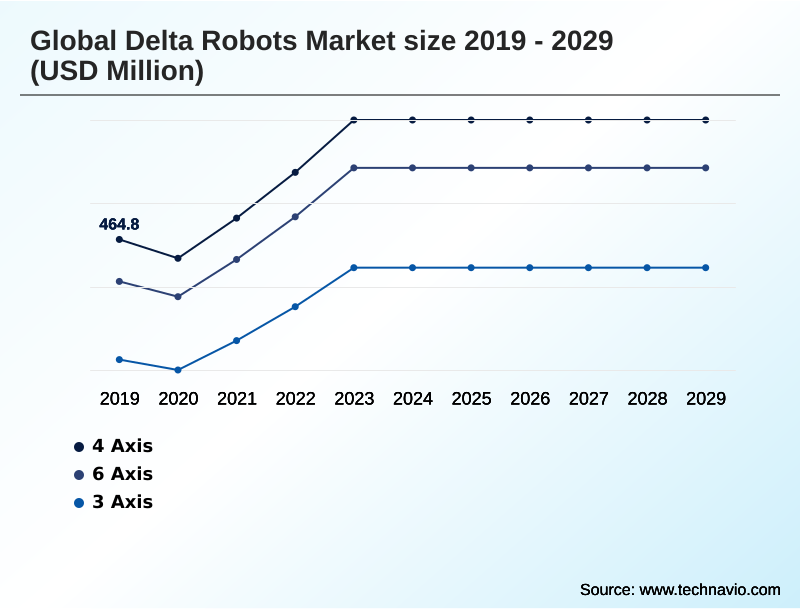
  • By Type - 4 Axis segment was valued at USD 618.8 million in 2023
  • By End-user - Food and beverages segment accounted for the largest market revenue share in 2023

Market Size & Forecast

  • Market Opportunities: USD 2.75 billion
  • Market Future Opportunities: USD 2.12 billion
  • CAGR from 2024 to 2029 : 16.8%

Market Summary

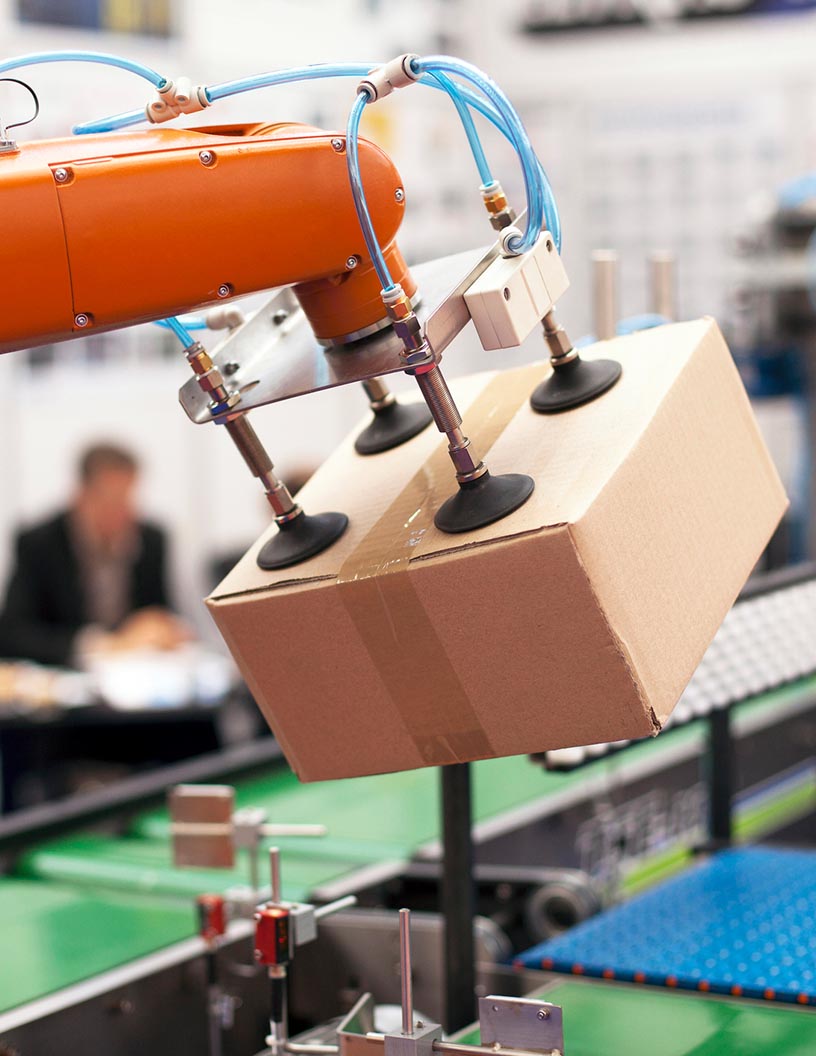
  • The delta robots market is characterized by a strong demand for high-speed automation solutions, particularly within the food and beverage, pharmaceutical, and electronics sectors. These industries leverage the inherent advantages of parallel kinematic robots, such as high acceleration and precision, to optimize pick-and-place applications, packaging, and assembly tasks.
  • The adoption of vision-guided robotics and advanced robotic controllers allows these systems to handle complex sorting and handling operations on fast-moving production lines. For example, a food processing business can deploy a series of washdown-compatible delta robots to sort and pack delicate baked goods directly from a conveyor.
  • This not only significantly increases throughput but also adheres to strict hygienic design standards, minimizing contamination risks. However, the market also faces constraints from the inherent technical limitations of these robots, including restricted payload capacity and a confined, dome-shaped work envelope, which makes them unsuitable for heavy-duty material handling.
  • Additionally, the high initial capital expenditure and the availability of alternative robotic systems, like SCARA robots for certain assembly tasks, moderate the adoption rate, especially among small and medium-sized enterprises.

What will be the Size of the Delta Robots Market during the forecast period?

Get Key Insights on Market Forecast (PDF) Request Free Sample

How is the Delta Robots Market Segmented?

The delta robots industry research report provides comprehensive data (region-wise segment analysis), with forecasts and estimates in "USD million" for the period 2025-2029, as well as historical data from 2019-2023 for the following segments.

  • Type
    • 4 Axis
    • 6 Axis
    • 3 Axis
  • End-user
    • Food and beverages
    • Electrical and electronics
    • Pharmaceuticals
  • Application
    • Pick and place
    • Palletizing and packaging
    • Assembly
    • Material handling
    • Others
  • Geography
    • APAC
      • China
      • Japan
      • India
    • Europe
      • Germany
      • UK
      • France
    • North America
      • US
      • Canada
      • Mexico
    • South America
      • Brazil
      • Argentina
      • Colombia
    • Middle East and Africa
      • Saudi Arabia
      • UAE
      • South Africa
    • Rest of World (ROW)

By Type Insights

The 4 axis segment is estimated to witness significant growth during the forecast period.

The 4-axis delta robot segment is defined by the integration of a rotational R-axis, which provides critical part orientation capabilities.

This function allows the end-effector to not only pick an object but also to rotate it before placement, a requirement for many electronics assembly and complex packaging applications. This added flexibility significantly expands the operational scope beyond simple pick-and-place automation.

For instance, in manufacturing processes requiring precise component alignment, these systems offer a distinct advantage over 3-axis variants. The evolution of the parallel kinematic structure in these robots, often involving lightweight carbon fiber arms, supports high-speed automation.

The integration of advanced robotic controllers and vision-guided robotics further enhances their precision, with some systems achieving a repeatability precision below 3 microns, enabling effective use in micro-assembly and micro-automation tasks.

Request Free Sample

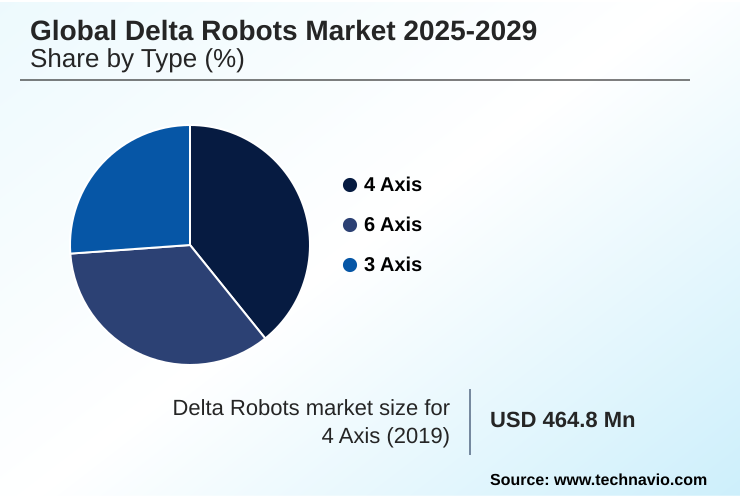
The 4 Axis segment was valued at USD 618.8 million in 2023 and showed a gradual increase during the forecast period.

Request Free Sample

Regional Analysis

APAC is estimated to contribute 51% to the growth of the global market during the forecast period.Technavio’s analysts have elaborately explained the regional trends and drivers that shape the market during the forecast period.

See How Delta Robots Market Demand is Rising in APAC Request Free Sample

The geographic landscape of the delta robots market is dominated by APAC, which accounts for over 51% of the market's incremental growth.

This is driven by the region's massive electronics industry, where high-speed automation and robotic part handling are essential for assembling consumer devices in countries like China, Japan, and South Korea.

In contrast, growth in North America and Europe is largely propelled by the food and beverage packaging and pharmaceutical sorting sectors.

Stringent food safety regulations in these regions mandate the use of washdown-compatible and hygienic design robots, making the technology a strategic investment.

While North America shows strong growth, the competitive environment and continuous innovation from robotics companies headquartered in APAC ensure the region's continued leadership in both production and adoption of delta robot technology.

Market Dynamics

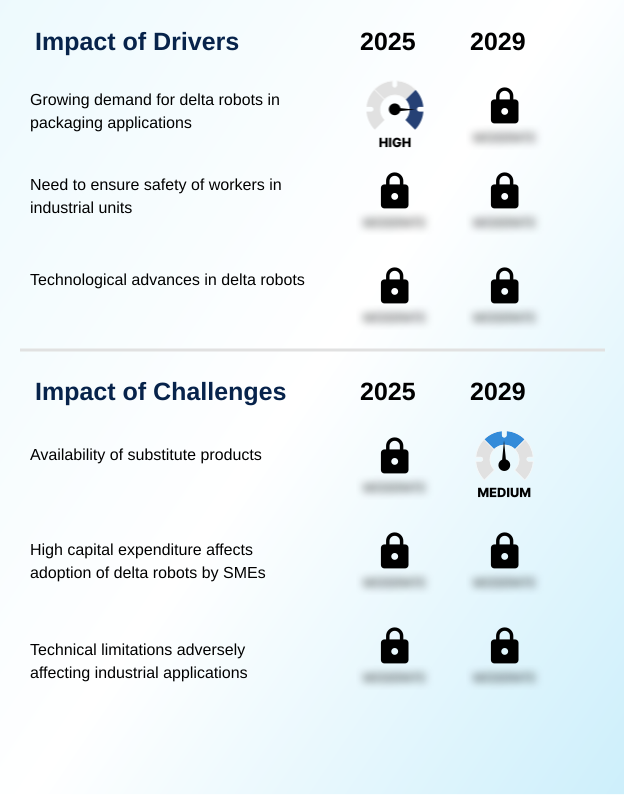
Our researchers analyzed the data with 2024 as the base year, along with the key drivers, trends, and challenges. A holistic analysis of drivers will help companies refine their marketing strategies to gain a competitive advantage.

  • Strategic implementation of high-speed pick and place automation is a critical focus for manufacturers aiming to enhance operational efficiency. A central consideration in this process is selecting the appropriate robotic system, often involving a detailed comparison of a 4-axis vs. a 6-axis delta robot. For many tasks, such as primary packaging in food processing, a 4-axis model provides sufficient dexterity.
  • However, more complex assembly operations may necessitate the advanced capabilities of a 6-axis system. A key enabler for all configurations is the effective practice of integrating machine vision with delta robots, which allows for dynamic tracking and handling of objects on a production line.
  • Organizations must also carefully evaluate the total cost of implementing delta robots, which includes not only the hardware but also integration, programming, and safety infrastructure. Understanding technical constraints, such as delta robot payload capacity limitations, is crucial to avoid misapplication. A thorough analysis of the delta robot's work envelope ensures the system can meet all required pick-and-place points.
  • This detailed planning can yield significant returns; facilities that optimize for both payload and reach report up to a 15% greater efficiency in floor space utilization compared to those with suboptimal configurations. The choice between a delta robot and a SCARA robot ultimately depends on the specific speed and reach requirements of the pick-and-place task.
  • Properly integrating these systems is a key factor in improving throughput with delta robots and achieving a competitive advantage.

What are the key market drivers leading to the rise in the adoption of Delta Robots Industry?

  • The growing demand for delta robots, particularly in high-speed packaging applications across the food and beverage, pharmaceutical, and electronics industries, is a key driver of market growth.

  • Market growth is primarily driven by the escalating demand for high-speed automation to improve manufacturing efficiency and ensure worker safety.
  • In packaging applications, delta robots can increase production throughput by as much as 50% compared to traditional methods, offering a significant competitive advantage.
  • The need to protect workers from repetitive motion injuries and hazardous environments is another powerful driver; automating these tasks can reduce related workplace incidents by over 70%.
  • Technological advances are also expanding the market, with modern delta robots featuring enhanced payload capacity and greater flexibility.
  • The integration of sophisticated end-effectors and vision-guided robotics allows these systems to perform complex pick-and-place automation and material handling tasks that were previously unfeasible, boosting their adoption across various industries.

What are the market trends shaping the Delta Robots Industry?

  • A prominent market trend is the increasing focus on reducing the overall size of delta robots. This development is driven by the demand for compact automation solutions in micro-assembly and space-constrained production environments.

  • Key market trends are centered on enhancing the performance and applicability of delta robots through technological innovation. There is a significant focus on miniaturization, with newer models designed for micro-automation tasks achieving a repeatability precision of under 3 microns, essential for the electronics assembly sector.
  • The development of advanced software and motion control systems is also critical, enabling smoother and faster operational cycles. For instance, the latest robotic controllers can reduce programming time for new tasks by up to 25%. Furthermore, the integration of advanced 3D machine vision technology is becoming standard.
  • These vision-guided robotics systems improve pick accuracy to over 99% on fast-moving and disorganized product flows, drastically reducing errors in food and beverage packaging and pharmaceutical sorting operations.

What challenges does the Delta Robots Industry face during its growth?

  • The availability of substitute products, such as SCARA and cartesian robots for certain applications, presents a key challenge to the market's growth.

  • Despite strong drivers, the market faces challenges that temper its growth. The primary constraint is the availability of substitute products, particularly SCARA and Cartesian robots, which are often preferred for applications requiring heavier payload capacity or a larger, rectangular work envelope.
  • A delta robot's payload capacity is typically limited to under 15 lbs, making it unsuitable for many material handling tasks. The high initial capital expenditure is another significant barrier, especially for small and medium-sized enterprises (SMEs). A fully integrated delta robot cell can require an investment several times that of a manual workstation.
  • Furthermore, their parallel kinematic structure, while enabling high speed, inherently limits the end-effector's dexterity and reach, confining their use to a specific niche of high-speed, lightweight handling tasks.

Exclusive Technavio Analysis on Customer Landscape

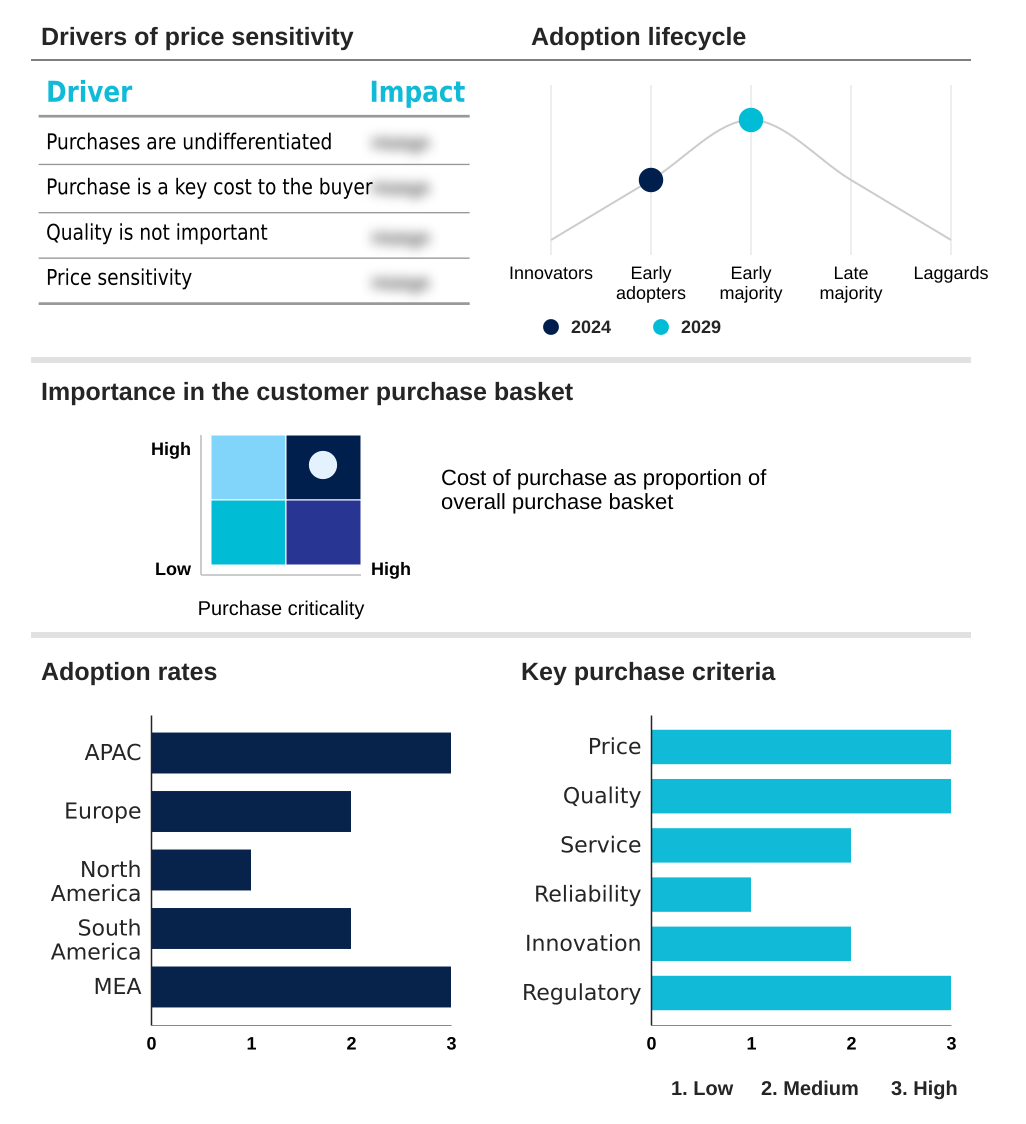
The delta robots market forecasting report includes the adoption lifecycle of the market, covering from the innovator’s stage to the laggard’s stage. It focuses on adoption rates in different regions based on penetration. Furthermore, the delta robots market report also includes key purchase criteria and drivers of price sensitivity to help companies evaluate and develop their market growth analysis strategies.

Customer Landscape of Delta Robots Industry

Competitive Landscape

Companies are implementing various strategies, such as strategic alliances, delta robots market forecast, partnerships, mergers and acquisitions, geographical expansion, and product/service launches, to enhance their presence in the industry.

Acrome Robotik - Provides turnkey delta robot systems with integrated vision and controllers, targeting academic and research applications in robotics and automation.

The industry research and growth report includes detailed analyses of the competitive landscape of the market and information about key companies, including:

  • Acrome Robotik
  • Cama 1 S.p.A.
  • Codian Robotics BV
  • Delta Electronics Inc.
  • DENSO Corp.
  • FANUC Corp.
  • GSK CNC Equipment Co. Ltd.
  • Hiwin Technologies Corp.
  • igus GmbH
  • Kawasaki Heavy Industries Ltd.
  • MIDEA Group Co. Ltd.
  • NACHI FUJIKOSHI Corp.
  • OMRON Corp.
  • ONExia Inc.
  • Robert Bosch GmbH
  • Seiko Epson Corp.
  • Yaskawa Electric Corp.

Qualitative and quantitative analysis of companies has been conducted to help clients understand the wider business environment as well as the strengths and weaknesses of key industry players. Data is qualitatively analyzed to categorize companies as pure play, category-focused, industry-focused, and diversified; it is quantitatively analyzed to categorize companies as dominant, leading, strong, tentative, and weak.

Recent Development and News in Delta robots market

  • In September 2024, Robert Bosch GmbH announced the acquisition of a European startup specializing in advanced end-of-arm-tooling (EOAT) for approximately USD 45 million, aiming to strengthen its offerings for the pharmaceutical packaging sector.
  • In November 2024, FANUC Corp. launched its new DR-4iB series of delta robots, which feature a proprietary AI-driven vision system that enhances sorting accuracy by 15% in high-speed, variable-product-flow environments.
  • In February 2025, Yaskawa Electric Corp. formed a strategic partnership with a leading industrial software company to integrate digital twin and predictive maintenance analytics into its MOTOMAN delta robot controllers, targeting a 20% reduction in unscheduled downtime for users.
  • In April 2025, Seiko Epson Corp. unveiled a new generation of compact, high-speed delta robots at Hannover Messe, demonstrating a cycle time of under 0.25 seconds for complex pick-and-place tasks within a minimal footprint, designed specifically for the electronics assembly market.

Dive into Technavio’s robust research methodology, blending expert interviews, extensive data synthesis, and validated models for unparalleled Delta Robots Market insights. See full methodology.

Market Scope
Page number 301
Base year 2024
Historic period 2019-2023
Forecast period 2025-2029
Growth momentum & CAGR Accelerate at a CAGR of 16.8%
Market growth 2025-2029 USD 2119.8 million
Market structure Fragmented
YoY growth 2024-2025(%) 14.0%
Key countries China, Japan, India, South Korea, Australia, Indonesia, Germany, UK, France, Italy, The Netherlands, Spain, US, Canada, Mexico, Brazil, Argentina, Colombia, Saudi Arabia, UAE, South Africa, Israel and Turkey
Competitive landscape Leading Companies, Market Positioning of Companies, Competitive Strategies, and Industry Risks

Request Free Sample

Research Analyst Overview

  • The delta robots market is centered on the application of parallel kinematic robots, which are distinguished by their lightweight carbon fiber arms and parallel link mechanism. This structure facilitates the high acceleration necessary for high-speed pick-and-place applications within a distinctive dome-shaped work envelope.
  • The core technology, involving sophisticated robotic controllers and motion control systems, enables precise movements of the end-effector for tasks ranging from packaging to assembly. A key trend influencing boardroom decisions is the growing requirement for regulatory compliance in sensitive industries.
  • The adoption of washdown-compatible robots with a hygienic design is no longer just an operational choice but a strategic imperative to mitigate risks in food and pharmaceutical production, where systems must withstand rigorous sanitation protocols.
  • Integrating advanced machine vision technology and conveyor tracking allows for dynamic robotic part handling, with some automated systems achieving cycle time reductions of over 60% compared to manual processes. While payload capacity remains a key consideration, advancements in materials and design continue to expand the application scope of both 3-axis delta robots and 4-axis delta robots in high-throughput environments.

What are the Key Data Covered in this Delta Robots Market Research and Growth Report?

  • What is the expected growth of the Delta Robots Market between 2025 and 2029?

    • USD 2.12 billion, at a CAGR of 16.8%

  • What segmentation does the market report cover?

    • The report is segmented by Type (4 Axis, 6 Axis, and 3 Axis), End-user (Food and beverages, Electrical and electronics, and Pharmaceuticals), Application (Pick and place, Palletizing and packaging, Assembly, Material handling, and Others) and Geography (APAC, Europe, North America, South America, Middle East and Africa)

  • Which regions are analyzed in the report?

    • APAC, Europe, North America, South America and Middle East and Africa

  • What are the key growth drivers and market challenges?

    • Growing demand for delta robots in packaging applications , Availability of substitute products

  • Who are the major players in the Delta Robots Market?

    • Acrome Robotik, Cama 1 S.p.A., Codian Robotics BV, Delta Electronics Inc., DENSO Corp., FANUC Corp., GSK CNC Equipment Co. Ltd., Hiwin Technologies Corp., igus GmbH, Kawasaki Heavy Industries Ltd., MIDEA Group Co. Ltd., NACHI FUJIKOSHI Corp., OMRON Corp., ONExia Inc., Robert Bosch GmbH, Seiko Epson Corp. and Yaskawa Electric Corp.

Market Research Insights

  • Market dynamics are heavily influenced by the push for greater efficiency in high-speed automation across several key sectors. In food and beverage packaging, implementing delta robots has been shown to boost line throughput by over 30% compared to manual methods.
  • Similarly, for pharmaceutical sorting, the technology facilitates compliance with stringent regulations by reducing human contact, leading to a 90% decrease in potential contamination events. In the demanding field of electronics assembly, the precision of vision-guided robotics allows for the accurate placement of miniature components, improving first-pass yield rates significantly.
  • These advancements in robotic kitting and material handling are critical as manufacturers seek to optimize production. The adoption of robotic systems in secondary packaging operations and within cleanroom environments demonstrates a clear return on investment, often realized in under 24 months through labor savings and enhanced productivity.

We can help! Our analysts can customize this delta robots market research report to meet your requirements.

Get in touch

1. Executive Summary

1.1 Market overview

Executive Summary - Chart on Market Overview
Executive Summary - Data Table on Market Overview
Executive Summary - Chart on Global Market Characteristics
Executive Summary - Chart on Market by Geography
Executive Summary - Chart on Market Segmentation by Type
Executive Summary - Chart on Market Segmentation by End-user
Executive Summary - Chart on Market Segmentation by Application
Executive Summary - Chart on Incremental Growth
Executive Summary - Data Table on Incremental Growth
Executive Summary - Chart on Company Market Positioning

2. Technavio Analysis

2.1 Analysis of price sensitivity, lifecycle, customer purchase basket, adoption rates, and purchase criteria

2.2 Criticality of inputs and Factors of differentiation

Chart on Overview on criticality of inputs and factors of differentiation

2.3 Factors of disruption

Chart on Overview on factors of disruption

2.4 Impact of drivers and challenges

Chart on Impact of drivers and challenges in 2024 and 2029

3. Market Landscape

3.1 Market ecosystem

Chart on Parent Market
Data Table on - Parent Market

3.2 Market characteristics

Chart on Market characteristics analysis

3.3 Value chain analysis

Chart on Value chain analysis

4. Market Sizing

4.1 Market definition

Data Table on Offerings of companies included in the market definition

4.2 Market segment analysis

Market segments

4.3 Market size 2024

4.4 Market outlook: Forecast for 2024-2029

Chart on Global - Market size and forecast 2024-2029 ($ million)
Data Table on Global - Market size and forecast 2024-2029 ($ million)
Chart on Global Market: Year-over-year growth 2024-2029 (%)
Data Table on Global Market: Year-over-year growth 2024-2029 (%)

5. Historic Market Size

5.1 Global Delta Robots Market 2019 - 2023

Historic Market Size - Data Table on Global Delta Robots Market 2019 - 2023 ($ million)

5.2 Type segment analysis 2019 - 2023

Historic Market Size - Type Segment 2019 - 2023 ($ million)

5.3 End-user segment analysis 2019 - 2023

Historic Market Size - End-user Segment 2019 - 2023 ($ million)

5.4 Application segment analysis 2019 - 2023

Historic Market Size - Application Segment 2019 - 2023 ($ million)

5.5 Geography segment analysis 2019 - 2023

Historic Market Size - Geography Segment 2019 - 2023 ($ million)

5.6 Country segment analysis 2019 - 2023

Historic Market Size - Country Segment 2019 - 2023 ($ million)

6. Qualitative Analysis

6.1 Impact of AI in global delta robots market

7. Five Forces Analysis

7.1 Five forces summary

Five forces analysis - Comparison between 2024 and 2029

7.2 Bargaining power of buyers

Bargaining power of buyers - Impact of key factors 2024 and 2029

7.3 Bargaining power of suppliers

Bargaining power of suppliers - Impact of key factors in 2024 and 2029

7.4 Threat of new entrants

Threat of new entrants - Impact of key factors in 2024 and 2029

7.5 Threat of substitutes

Threat of substitutes - Impact of key factors in 2024 and 2029

7.6 Threat of rivalry

Threat of rivalry - Impact of key factors in 2024 and 2029

7.7 Market condition

Chart on Market condition - Five forces 2024 and 2029

8. Market Segmentation by Type

8.1 Market segments

Chart on Type - Market share 2024-2029 (%)
Data Table on Type - Market share 2024-2029 (%)

8.2 Comparison by Type

Chart on Comparison by Type
Data Table on Comparison by Type

8.3 4 Axis - Market size and forecast 2024-2029

Chart on 4 Axis - Market size and forecast 2024-2029 ($ million)
Data Table on 4 Axis - Market size and forecast 2024-2029 ($ million)
Chart on 4 Axis - Year-over-year growth 2024-2029 (%)
Data Table on 4 Axis - Year-over-year growth 2024-2029 (%)

8.4 6 Axis - Market size and forecast 2024-2029

Chart on 6 Axis - Market size and forecast 2024-2029 ($ million)
Data Table on 6 Axis - Market size and forecast 2024-2029 ($ million)
Chart on 6 Axis - Year-over-year growth 2024-2029 (%)
Data Table on 6 Axis - Year-over-year growth 2024-2029 (%)

8.5 3 Axis - Market size and forecast 2024-2029

Chart on 3 Axis - Market size and forecast 2024-2029 ($ million)
Data Table on 3 Axis - Market size and forecast 2024-2029 ($ million)
Chart on 3 Axis - Year-over-year growth 2024-2029 (%)
Data Table on 3 Axis - Year-over-year growth 2024-2029 (%)

8.6 Market opportunity by Type

Market opportunity by Type ($ million)
Data Table on Market opportunity by Type ($ million)

9. Market Segmentation by End-user

9.1 Market segments

Chart on End-user - Market share 2024-2029 (%)
Data Table on End-user - Market share 2024-2029 (%)

9.2 Comparison by End-user

Chart on Comparison by End-user
Data Table on Comparison by End-user

9.3 Food and beverages - Market size and forecast 2024-2029

Chart on Food and beverages - Market size and forecast 2024-2029 ($ million)
Data Table on Food and beverages - Market size and forecast 2024-2029 ($ million)
Chart on Food and beverages - Year-over-year growth 2024-2029 (%)
Data Table on Food and beverages - Year-over-year growth 2024-2029 (%)

9.4 Electrical and electronics - Market size and forecast 2024-2029

Chart on Electrical and electronics - Market size and forecast 2024-2029 ($ million)
Data Table on Electrical and electronics - Market size and forecast 2024-2029 ($ million)
Chart on Electrical and electronics - Year-over-year growth 2024-2029 (%)
Data Table on Electrical and electronics - Year-over-year growth 2024-2029 (%)

9.5 Pharmaceuticals - Market size and forecast 2024-2029

Chart on Pharmaceuticals - Market size and forecast 2024-2029 ($ million)
Data Table on Pharmaceuticals - Market size and forecast 2024-2029 ($ million)
Chart on Pharmaceuticals - Year-over-year growth 2024-2029 (%)
Data Table on Pharmaceuticals - Year-over-year growth 2024-2029 (%)

9.6 Market opportunity by End-user

Market opportunity by End-user ($ million)
Data Table on Market opportunity by End-user ($ million)

10. Market Segmentation by Application

10.1 Market segments

Chart on Application - Market share 2024-2029 (%)
Data Table on Application - Market share 2024-2029 (%)

10.2 Comparison by Application

Chart on Comparison by Application
Data Table on Comparison by Application

10.3 Pick and place - Market size and forecast 2024-2029

Chart on Pick and place - Market size and forecast 2024-2029 ($ million)
Data Table on Pick and place - Market size and forecast 2024-2029 ($ million)
Chart on Pick and place - Year-over-year growth 2024-2029 (%)
Data Table on Pick and place - Year-over-year growth 2024-2029 (%)

10.4 Palletizing and packaging - Market size and forecast 2024-2029

Chart on Palletizing and packaging - Market size and forecast 2024-2029 ($ million)
Data Table on Palletizing and packaging - Market size and forecast 2024-2029 ($ million)
Chart on Palletizing and packaging - Year-over-year growth 2024-2029 (%)
Data Table on Palletizing and packaging - Year-over-year growth 2024-2029 (%)

10.5 Assembly - Market size and forecast 2024-2029

Chart on Assembly - Market size and forecast 2024-2029 ($ million)
Data Table on Assembly - Market size and forecast 2024-2029 ($ million)
Chart on Assembly - Year-over-year growth 2024-2029 (%)
Data Table on Assembly - Year-over-year growth 2024-2029 (%)

10.6 Material handling - Market size and forecast 2024-2029

Chart on Material handling - Market size and forecast 2024-2029 ($ million)
Data Table on Material handling - Market size and forecast 2024-2029 ($ million)
Chart on Material handling - Year-over-year growth 2024-2029 (%)
Data Table on Material handling - Year-over-year growth 2024-2029 (%)

10.7 Others - Market size and forecast 2024-2029

Chart on Others - Market size and forecast 2024-2029 ($ million)
Data Table on Others - Market size and forecast 2024-2029 ($ million)
Chart on Others - Year-over-year growth 2024-2029 (%)
Data Table on Others - Year-over-year growth 2024-2029 (%)

10.8 Market opportunity by Application

Market opportunity by Application ($ million)
Data Table on Market opportunity by Application ($ million)

11. Customer Landscape

11.1 Customer landscape overview

Analysis of price sensitivity, lifecycle, customer purchase basket, adoption rates, and purchase criteria

12. Geographic Landscape

12.1 Geographic segmentation

Chart on Market share by geography 2024-2029 (%)
Data Table on Market share by geography 2024-2029 (%)

12.2 Geographic comparison

Chart on Geographic comparison
Data Table on Geographic comparison

12.3 APAC - Market size and forecast 2024-2029

Chart on APAC - Market size and forecast 2024-2029 ($ million)
Data Table on APAC - Market size and forecast 2024-2029 ($ million)
Chart on APAC - Year-over-year growth 2024-2029 (%)
Data Table on APAC - Year-over-year growth 2024-2029 (%)
Chart on Regional Comparison - APAC
Data Table on Regional Comparison - APAC

12.3.1 China - Market size and forecast 2024-2029

Chart on China - Market size and forecast 2024-2029 ($ million)
Data Table on China - Market size and forecast 2024-2029 ($ million)
Chart on China - Year-over-year growth 2024-2029 (%)
Data Table on China - Year-over-year growth 2024-2029 (%)

12.3.2 Japan - Market size and forecast 2024-2029

Chart on Japan - Market size and forecast 2024-2029 ($ million)
Data Table on Japan - Market size and forecast 2024-2029 ($ million)
Chart on Japan - Year-over-year growth 2024-2029 (%)
Data Table on Japan - Year-over-year growth 2024-2029 (%)

12.3.3 India - Market size and forecast 2024-2029

Chart on India - Market size and forecast 2024-2029 ($ million)
Data Table on India - Market size and forecast 2024-2029 ($ million)
Chart on India - Year-over-year growth 2024-2029 (%)
Data Table on India - Year-over-year growth 2024-2029 (%)

12.3.4 South Korea - Market size and forecast 2024-2029

Chart on South Korea - Market size and forecast 2024-2029 ($ million)
Data Table on South Korea - Market size and forecast 2024-2029 ($ million)
Chart on South Korea - Year-over-year growth 2024-2029 (%)
Data Table on South Korea - Year-over-year growth 2024-2029 (%)

12.3.5 Australia - Market size and forecast 2024-2029

Chart on Australia - Market size and forecast 2024-2029 ($ million)
Data Table on Australia - Market size and forecast 2024-2029 ($ million)
Chart on Australia - Year-over-year growth 2024-2029 (%)
Data Table on Australia - Year-over-year growth 2024-2029 (%)

12.3.6 Indonesia - Market size and forecast 2024-2029

Chart on Indonesia - Market size and forecast 2024-2029 ($ million)
Data Table on Indonesia - Market size and forecast 2024-2029 ($ million)
Chart on Indonesia - Year-over-year growth 2024-2029 (%)
Data Table on Indonesia - Year-over-year growth 2024-2029 (%)

12.4 Europe - Market size and forecast 2024-2029

Chart on Europe - Market size and forecast 2024-2029 ($ million)
Data Table on Europe - Market size and forecast 2024-2029 ($ million)
Chart on Europe - Year-over-year growth 2024-2029 (%)
Data Table on Europe - Year-over-year growth 2024-2029 (%)
Chart on Regional Comparison - Europe
Data Table on Regional Comparison - Europe

12.4.1 Germany - Market size and forecast 2024-2029

Chart on Germany - Market size and forecast 2024-2029 ($ million)
Data Table on Germany - Market size and forecast 2024-2029 ($ million)
Chart on Germany - Year-over-year growth 2024-2029 (%)
Data Table on Germany - Year-over-year growth 2024-2029 (%)

12.4.2 UK - Market size and forecast 2024-2029

Chart on UK - Market size and forecast 2024-2029 ($ million)
Data Table on UK - Market size and forecast 2024-2029 ($ million)
Chart on UK - Year-over-year growth 2024-2029 (%)
Data Table on UK - Year-over-year growth 2024-2029 (%)

12.4.3 France - Market size and forecast 2024-2029

Chart on France - Market size and forecast 2024-2029 ($ million)
Data Table on France - Market size and forecast 2024-2029 ($ million)
Chart on France - Year-over-year growth 2024-2029 (%)
Data Table on France - Year-over-year growth 2024-2029 (%)

12.4.4 Italy - Market size and forecast 2024-2029

Chart on Italy - Market size and forecast 2024-2029 ($ million)
Data Table on Italy - Market size and forecast 2024-2029 ($ million)
Chart on Italy - Year-over-year growth 2024-2029 (%)
Data Table on Italy - Year-over-year growth 2024-2029 (%)

12.4.5 The Netherlands - Market size and forecast 2024-2029

Chart on The Netherlands - Market size and forecast 2024-2029 ($ million)
Data Table on The Netherlands - Market size and forecast 2024-2029 ($ million)
Chart on The Netherlands - Year-over-year growth 2024-2029 (%)
Data Table on The Netherlands - Year-over-year growth 2024-2029 (%)

12.4.6 Spain - Market size and forecast 2024-2029

Chart on Spain - Market size and forecast 2024-2029 ($ million)
Data Table on Spain - Market size and forecast 2024-2029 ($ million)
Chart on Spain - Year-over-year growth 2024-2029 (%)
Data Table on Spain - Year-over-year growth 2024-2029 (%)

12.5 North America - Market size and forecast 2024-2029

Chart on North America - Market size and forecast 2024-2029 ($ million)
Data Table on North America - Market size and forecast 2024-2029 ($ million)
Chart on North America - Year-over-year growth 2024-2029 (%)
Data Table on North America - Year-over-year growth 2024-2029 (%)
Chart on Regional Comparison - North America
Data Table on Regional Comparison - North America

12.5.1 US - Market size and forecast 2024-2029

Chart on US - Market size and forecast 2024-2029 ($ million)
Data Table on US - Market size and forecast 2024-2029 ($ million)
Chart on US - Year-over-year growth 2024-2029 (%)
Data Table on US - Year-over-year growth 2024-2029 (%)

12.5.2 Canada - Market size and forecast 2024-2029

Chart on Canada - Market size and forecast 2024-2029 ($ million)
Data Table on Canada - Market size and forecast 2024-2029 ($ million)
Chart on Canada - Year-over-year growth 2024-2029 (%)
Data Table on Canada - Year-over-year growth 2024-2029 (%)

12.5.3 Mexico - Market size and forecast 2024-2029

Chart on Mexico - Market size and forecast 2024-2029 ($ million)
Data Table on Mexico - Market size and forecast 2024-2029 ($ million)
Chart on Mexico - Year-over-year growth 2024-2029 (%)
Data Table on Mexico - Year-over-year growth 2024-2029 (%)

12.6 South America - Market size and forecast 2024-2029

Chart on South America - Market size and forecast 2024-2029 ($ million)
Data Table on South America - Market size and forecast 2024-2029 ($ million)
Chart on South America - Year-over-year growth 2024-2029 (%)
Data Table on South America - Year-over-year growth 2024-2029 (%)
Chart on Regional Comparison - South America
Data Table on Regional Comparison - South America

12.6.1 Brazil - Market size and forecast 2024-2029

Chart on Brazil - Market size and forecast 2024-2029 ($ million)
Data Table on Brazil - Market size and forecast 2024-2029 ($ million)
Chart on Brazil - Year-over-year growth 2024-2029 (%)
Data Table on Brazil - Year-over-year growth 2024-2029 (%)

12.6.2 Argentina - Market size and forecast 2024-2029

Chart on Argentina - Market size and forecast 2024-2029 ($ million)
Data Table on Argentina - Market size and forecast 2024-2029 ($ million)
Chart on Argentina - Year-over-year growth 2024-2029 (%)
Data Table on Argentina - Year-over-year growth 2024-2029 (%)

12.6.3 Colombia - Market size and forecast 2024-2029

Chart on Colombia - Market size and forecast 2024-2029 ($ million)
Data Table on Colombia - Market size and forecast 2024-2029 ($ million)
Chart on Colombia - Year-over-year growth 2024-2029 (%)
Data Table on Colombia - Year-over-year growth 2024-2029 (%)

12.7 Middle East and Africa - Market size and forecast 2024-2029

Chart on Middle East and Africa - Market size and forecast 2024-2029 ($ million)
Data Table on Middle East and Africa - Market size and forecast 2024-2029 ($ million)
Chart on Middle East and Africa - Year-over-year growth 2024-2029 (%)
Data Table on Middle East and Africa - Year-over-year growth 2024-2029 (%)
Chart on Regional Comparison - Middle East and Africa
Data Table on Regional Comparison - Middle East and Africa

12.7.1 Saudi Arabia - Market size and forecast 2024-2029

Chart on Saudi Arabia - Market size and forecast 2024-2029 ($ million)
Data Table on Saudi Arabia - Market size and forecast 2024-2029 ($ million)
Chart on Saudi Arabia - Year-over-year growth 2024-2029 (%)
Data Table on Saudi Arabia - Year-over-year growth 2024-2029 (%)

12.7.2 UAE - Market size and forecast 2024-2029

Chart on UAE - Market size and forecast 2024-2029 ($ million)
Data Table on UAE - Market size and forecast 2024-2029 ($ million)
Chart on UAE - Year-over-year growth 2024-2029 (%)
Data Table on UAE - Year-over-year growth 2024-2029 (%)

12.7.3 South Africa - Market size and forecast 2024-2029

Chart on South Africa - Market size and forecast 2024-2029 ($ million)
Data Table on South Africa - Market size and forecast 2024-2029 ($ million)
Chart on South Africa - Year-over-year growth 2024-2029 (%)
Data Table on South Africa - Year-over-year growth 2024-2029 (%)

12.7.4 Israel - Market size and forecast 2024-2029

Chart on Israel - Market size and forecast 2024-2029 ($ million)
Data Table on Israel - Market size and forecast 2024-2029 ($ million)
Chart on Israel - Year-over-year growth 2024-2029 (%)
Data Table on Israel - Year-over-year growth 2024-2029 (%)

12.7.5 Turkey - Market size and forecast 2024-2029

Chart on Turkey - Market size and forecast 2024-2029 ($ million)
Data Table on Turkey - Market size and forecast 2024-2029 ($ million)
Chart on Turkey - Year-over-year growth 2024-2029 (%)
Data Table on Turkey - Year-over-year growth 2024-2029 (%)

12.8 Market opportunity by geography

Market opportunity by geography ($ million)
Data Tables on Market opportunity by geography ($ million)

13. Drivers, Challenges, and Opportunity

13.1 Market drivers

Growing demand for delta robots in packaging applications
Need to ensure safety of workers in industrial units
Technological advances in delta robots

13.2 Market challenges

Availability of substitute products
High capital expenditure affects adoption of delta robots by SMEs
Technical limitations adversely affecting industrial applications

13.3 Impact of drivers and challenges

Impact of drivers and challenges in 2024 and 2029

13.4 Market opportunities

Increasing focus on reducing overall size of delta robots
Advanced software and control systems in delta robots to improve performance
Development of vision integrated delta robots

14. Competitive Landscape

14.1 Overview

14.2

Overview on criticality of inputs and factors of differentiation

14.3 Landscape disruption

Overview on factors of disruption

14.4 Industry risks

Impact of key risks on business

15. Competitive Analysis

15.1 Companies profiled

Companies covered

15.2 Company ranking index

15.3 Market positioning of companies

Matrix on companies position and classification

15.4 Acrome Robotik

Acrome Robotik - Overview
Acrome Robotik - Product / Service
Acrome Robotik - Key offerings
SWOT

15.5 Cama 1 S.p.A.

Cama 1 S.p.A. - Overview
Cama 1 S.p.A. - Product / Service
Cama 1 S.p.A. - Key offerings
SWOT

15.6 Codian Robotics BV

Codian Robotics BV - Overview
Codian Robotics BV - Product / Service
Codian Robotics BV - Key offerings
SWOT

15.7 Delta Electronics Inc.

Delta Electronics Inc. - Overview
Delta Electronics Inc. - Business segments
Delta Electronics Inc. - Key news
Delta Electronics Inc. - Key offerings
Delta Electronics Inc. - Segment focus
SWOT

15.8 DENSO Corp.

DENSO Corp. - Overview
DENSO Corp. - Business segments
DENSO Corp. - Key news
DENSO Corp. - Key offerings
DENSO Corp. - Segment focus
SWOT

15.9 FANUC Corp.

FANUC Corp. - Overview
FANUC Corp. - Product / Service
FANUC Corp. - Key news
FANUC Corp. - Key offerings
SWOT

15.10 GSK CNC Equipment Co. Ltd.

GSK CNC Equipment Co. Ltd. - Overview
GSK CNC Equipment Co. Ltd. - Product / Service
GSK CNC Equipment Co. Ltd. - Key offerings
SWOT

15.11 Hiwin Technologies Corp.

Hiwin Technologies Corp. - Overview
Hiwin Technologies Corp. - Product / Service
Hiwin Technologies Corp. - Key offerings
SWOT

15.12 igus GmbH

igus GmbH - Overview
igus GmbH - Product / Service
igus GmbH - Key offerings
SWOT

15.13 Kawasaki Heavy Industries Ltd.

Kawasaki Heavy Industries Ltd. - Overview
Kawasaki Heavy Industries Ltd. - Business segments
Kawasaki Heavy Industries Ltd. - Key news
Kawasaki Heavy Industries Ltd. - Key offerings
Kawasaki Heavy Industries Ltd. - Segment focus
SWOT

15.14 OMRON Corp.

OMRON Corp. - Overview
OMRON Corp. - Business segments
OMRON Corp. - Key news
OMRON Corp. - Key offerings
OMRON Corp. - Segment focus
SWOT

15.15 ONExia Inc.

ONExia Inc. - Overview
ONExia Inc. - Product / Service
ONExia Inc. - Key offerings
SWOT

15.16 Robert Bosch GmbH

Robert Bosch GmbH - Overview
Robert Bosch GmbH - Product / Service
Robert Bosch GmbH - Key news
Robert Bosch GmbH - Key offerings
SWOT

15.17 Seiko Epson Corp.

Seiko Epson Corp. - Overview
Seiko Epson Corp. - Business segments
Seiko Epson Corp. - Key news
Seiko Epson Corp. - Key offerings
Seiko Epson Corp. - Segment focus
SWOT

15.18 Yaskawa Electric Corp.

Yaskawa Electric Corp. - Overview
Yaskawa Electric Corp. - Business segments
Yaskawa Electric Corp. - Key news
Yaskawa Electric Corp. - Key offerings
Yaskawa Electric Corp. - Segment focus
SWOT

16. Appendix

16.1 Scope of the report

Market definition
Objectives
Notes and caveats

16.2 Inclusions and exclusions checklist

Inclusions checklist
Exclusions checklist

16.3 Currency conversion rates for US$

16.4 Research methodology

16.5 Data procurement

Information sources

16.6 Data validation

16.7 Validation techniques employed for market sizing

16.8 Data synthesis

16.9 360 degree market analysis

16.10 List of abbreviations

Research Methodology

Technavio presents a detailed picture of the market by way of study, synthesis, and summation of data from multiple sources. The analysts have presented the various facets of the market with a particular focus on identifying the key industry influencers. The data thus presented is comprehensive, reliable, and the result of extensive research, both primary and secondary.

INFORMATION SOURCES

Primary sources

  • Manufacturers and suppliers
  • Channel partners
  • Industry experts
  • Strategic decision makers

Secondary sources

  • Industry journals and periodicals
  • Government data
  • Financial reports of key industry players
  • Historical data
  • Press releases

DATA ANALYSIS

Data Synthesis

  • Collation of data
  • Estimation of key figures
  • Analysis of derived insights

Data Validation

  • Triangulation with data models
  • Reference against proprietary databases
  • Corroboration with industry experts

REPORT WRITING

Qualitative

  • Market drivers
  • Market challenges
  • Market trends
  • Five forces analysis

Quantitative

  • Market size and forecast
  • Market segmentation
  • Geographical insights
  • Competitive landscape

Interested in this report?

Get your sample now to see our research methodology and insights!

Download Now

Frequently Asked Questions

Delta Robots market growth will increase by USD 2119.8 million during 2025-2029 .

The Delta Robots market is expected to grow at a CAGR of 16.8% during 2025-2029 .

Delta Robots market is segmented by Type (4 Axis, 6 Axis, 3 Axis) End-user (Food and beverages, Electrical and electronics, Pharmaceuticals) Application (Pick and place, Palletizing and packaging, Assembly, Material handling, Others)

Acrome Robotik, Cama 1 S.p.A., Codian Robotics BV, Delta Electronics Inc., DENSO Corp., FANUC Corp., GSK CNC Equipment Co. Ltd., Hiwin Technologies Corp., igus GmbH, Kawasaki Heavy Industries Ltd., MIDEA Group Co. Ltd., NACHI FUJIKOSHI Corp., OMRON Corp., ONExia Inc., Robert Bosch GmbH, Seiko Epson Corp., Yaskawa Electric Corp. are a few of the key vendors in the Delta Robots market.

APAC will register the highest growth rate of 51% among the other regions. Therefore, the Delta Robots market in APAC is expected to garner significant business opportunities for the vendors during the forecast period.

China, Japan, India, South Korea, Australia, Indonesia, Germany, UK, France, Italy, The Netherlands, Spain, US, Canada, Mexico, Brazil, Argentina, Colombia, Saudi Arabia, UAE, South Africa, Israel, Turkey

  • Growing demand for delta robots in packaging applications is the driving factor this market.

The Delta Robots market vendors should focus on grabbing business opportunities from the Type segment as it accounted for the largest market share in the base year.