
Dental Cleansing Tablet Market Size 2025-2029
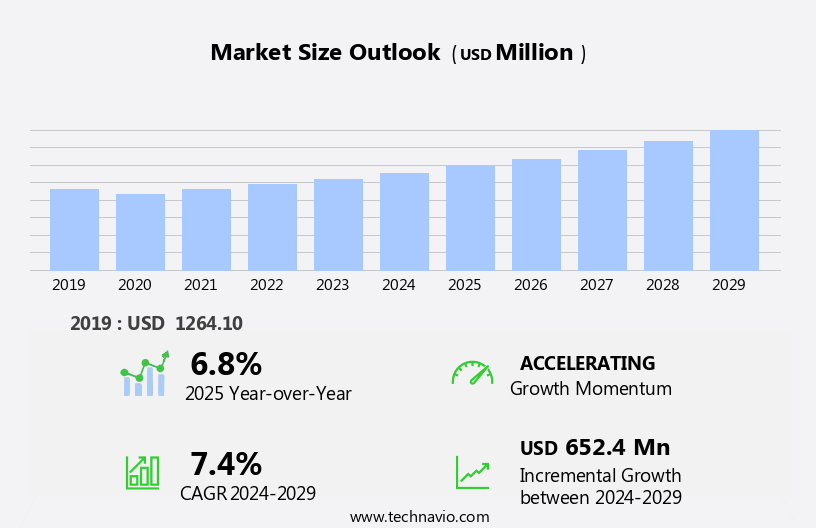
The dental cleansing tablet market size is forecast to increase by USD 652.4 million at a CAGR of 7.4% between 2024 and 2029.
- The Dental Cleansing Tablets market is witnessing significant growth, driven by the increasing trend towards product innovation and portfolio extension. Companies are investing heavily in research and development to launch new and improved dental cleansing tablet offerings, catering to diverse consumer preferences and oral health needs. Another key trend influencing the market is the rising popularity of private-label brands. Consumers are increasingly opting for cost-effective and high-quality private-label dental cleansing tablets, posing a challenge for established brands. Additionally, the use of oral care substitutes, such as natural and organic alternatives, is on the rise. This shift towards more natural and sustainable oral care solutions presents both opportunities and challenges for market participants.
- Companies can capitalize on this trend by offering eco-friendly and effective dental cleansing tablets, while also addressing the need for consistent quality and affordability. However, navigating the competitive landscape and ensuring regulatory compliance will be crucial for market success. Overall, the Dental Cleansing Tablets market is poised for growth, with companies that prioritize innovation, sustainability, and consumer-centricity well-positioned to capture market share. Ethical sourcing and saliva stimulation are also essential for maintaining oral hygiene.
What will be the Size of the Dental Cleansing Tablet Market during the forecast period?
Explore in-depth regional segment analysis with market size data - historical 2019-2023 and forecasts 2025-2029 - in the full report.
Request Free Sample
- The market is experiencing significant activity and trends, driven by growing concerns over tooth decay and periodontal disease. These conditions are linked to biofilm formation, enamel erosion, and gum recession. Hydrogen peroxide and baking soda are popular ingredients for cleansing tablets due to their cavity prevention properties. However, environmental impact is a rising concern, leading to the adoption of sustainable dentistry practices. Sustainable options include dental sealants made from biocompatible materials and green packaging.
- Dental floss picks and dental calculus removal are other areas of focus, with anti-microbial agents and essential oils providing added benefits. Dry mouth is a common issue, leading to the use of anti-microbial agents and saliva stimulation agents in dental products. Overall, the market is dynamic, with a focus on oral health education, cavity prevention, and sustainable practices. Anti-inflammatory agents, essential oils, and tongue cleaners are additional ingredients gaining popularity. Antibiotic resistance poses a significant threat, necessitating the development of alternative infection control strategies.
How is this Dental Cleansing Tablet Industry segmented?
The dental cleansing tablet industry research report provides comprehensive data (region-wise segment analysis), with forecasts and estimates in "USD million" for the period 2025-2029, as well as historical data from 2019-2023 for the following segments.
- Distribution Channel
- Offline
- Online
- Product
- Denture cleansing tablet
- Toothpaste tablet
- Product Type
- Whitening tablet
- Effervescent tablets
- Antibacterial tablets
- Fluoride tablets
- Others
- Geography
- North America
- US
- Canada
- Europe
- France
- Germany
- Italy
- UK
- APAC
- China
- India
- Japan
- South America
- Brazil
- Rest of World (ROW)
- North America
By Distribution Channel Insights
The offline segment is estimated to witness significant growth during the forecast period. The global dental cleansing tablets market is driven by the growing emphasis on preventative oral care and consumer preferences for convenient, portable solutions. Quality control measures ensure effective fluoride delivery and address the needs of sensitive teeth and gum health. Price sensitivity remains a significant factor, leading to increased online shopping and retail sales. Social media engagement and digital marketing strategies are essential for brand loyalty and reaching consumers. Emerging technologies, such as artificial intelligence and oral cancer screening, are transforming oral health products. Oral care professionals and dental clinics continue to recommend single-dose packets for their ease of use and effectiveness in plaque removal and tartar control.
Clinical trials and dental hygienists utilize X-ray imaging and diagnostic tools to assess dental care routines and identify potential issues. Pharmaceutical development and ingredient sourcing prioritize natural ingredients and sugar reduction, while antibacterial properties remain crucial. Dental insurance and distribution channels expand access to dental implants, dental crowns, and dental care services. Product differentiation and packaging design cater to various consumer needs and preferences, with sustainable packaging gaining popularity. Advertising campaigns and manufacturing processes prioritize fresh breath and effective plaque removal. Dental research and dental research institutions continue to drive innovation and advancements in oral health solutions.
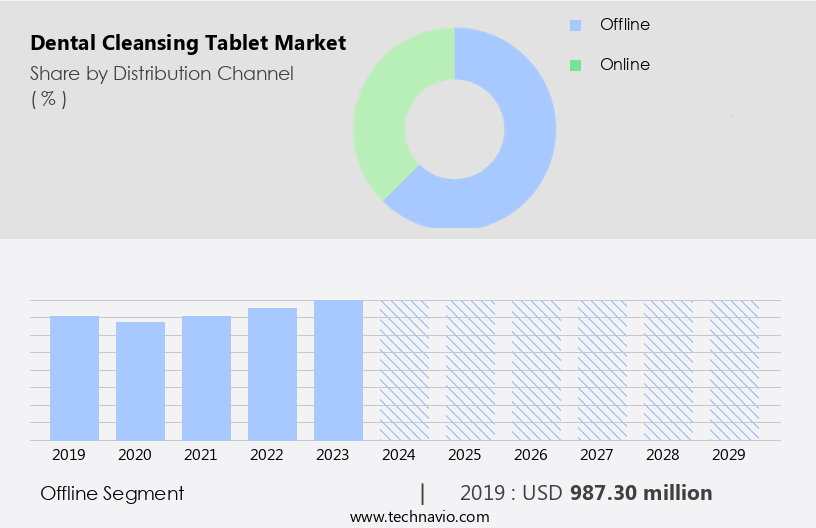
The Offline segment was valued at USD 987.30 million in 2019 and showed a gradual increase during the forecast period.
The Dental Cleansing Tablet Market is growing with increasing demand for innovative oral care solutions. Products incorporating activated charcoal enhance stain removal, while advancements in oral irrigators improve gum health. The use of tongue cleaners is gaining traction, promoting complete hygiene beyond traditional brushing. Addressing concerns like tooth sensitivity, these tablets provide gentle yet effective cleansing, reducing discomfort for users. Formulated to combat dental plaque, they support long-term oral health maintenance. Rising awareness through oral hygiene education and public health programs is driving market expansion, encouraging consumers to adopt preventive dental care measures. Product life cycle and digital health trends are influencing the market, with remote monitoring and anti-microbial agents in interdental brushes and oral irrigators becoming increasingly popular.
Regional Analysis
North America is estimated to contribute 33% to the growth of the global market during the forecast period. Technavio's analysts have elaborately explained the regional trends and drivers that shape the market during the forecast period.
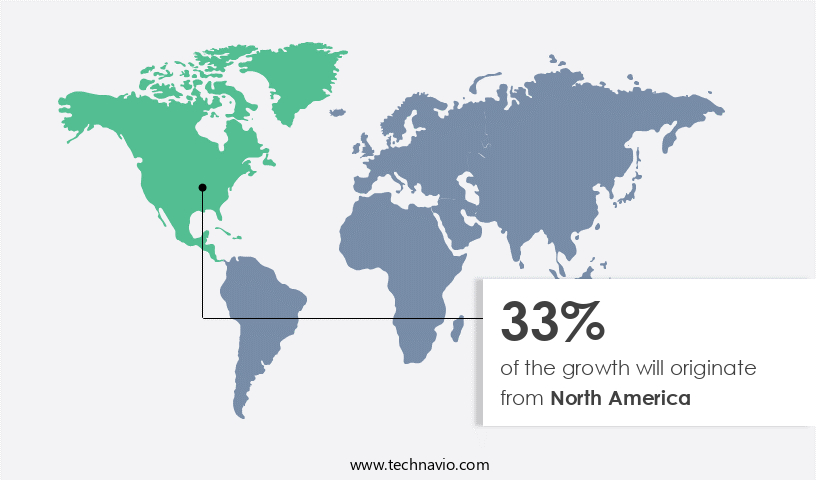
In the dynamic market for dental cleansing tablets, preventative care and consumer preferences play a significant role. North America, with its advanced healthcare infrastructure and heightened oral hygiene awareness, remains a dominant region. The US and Canada are key players, with a focus on improving dental care accessibility. Dental caries persists as a common issue among adults and children in the US, fueling the demand for effective oral hygiene solutions. A noteworthy trend is the increasing popularity of private-label brands, with pharmacy chains like Walgreens introducing their own dental cleansing tablets, such as Walgreens Denture Cleanser Tablets. This trend is further driven by the growing number of individuals using dentures, particularly among the aging population.
Quality control and fluoride delivery are essential considerations for manufacturers, catering to consumers with sensitive teeth and gum health concerns. Price sensitivity is another factor influencing market dynamics, with brands offering affordable options and sustainable packaging. Social media engagement and digital marketing are essential tools for reaching consumers, while emerging technologies like artificial intelligence and oral cancer screening are transforming the industry. Oral health products, oral care professionals, clinical trials, dental hygienists, x-ray imaging, diagnostic tools, and dental research continue to shape the market landscape. Dental insurance, distribution channels, tartar control, retail sales, online shopping, and dental implants are other significant factors influencing market growth.
Product differentiation, plaque removal, and dental cleansing tablets are at the forefront of innovation, with packaging design, ingredient sourcing, natural ingredients, brushing technique, customer reviews, sugar reduction, and antibacterial properties being key areas of focus. Pharmaceutical development, dental crowns, advertising campaigns, and the manufacturing process are also critical aspects of the market. Dental clinics continue to be a crucial distribution channel, offering professional recommendations and customized oral care solutions. Antimicrobial technologies, including antimicrobial coatings and irrigation solutions, are also gaining traction.
Market Dynamics
Our researchers analyzed the data with 2024 as the base year, along with the key drivers, trends, and challenges. A holistic analysis of drivers will help companies refine their marketing strategies to gain a competitive advantage.
What are the Dental Cleansing Tablet market drivers leading to the rise in the adoption of Industry?
- Product innovation and portfolio extension are essential drivers for market growth. By continuously introducing new and improved offerings, companies can expand their product lines and cater to diverse customer needs, thereby fueling market expansion. The market is experiencing growth in 2024, fueled by advancements in product innovation and consumer preferences. Manufacturers are introducing new flavors and functionalities to cater to diverse consumer needs. Innovations include the use of natural ingredients, improved functionality, and sustainable packaging. Lush Retail is a notable player, offering toothpaste tablets in various flavors like lemon-lime, spearmint, triple mint, cola, and lemon-menthol.
- Quality control remains a priority, with companies focusing on fluoride delivery and gum health. Price sensitivity is also a consideration, with emerging technologies and oral health products offering affordable alternatives. Social media engagement is increasing, with companies leveraging digital platforms to promote oral hygiene and oral cancer screening. Overall, the market is poised for continued growth, driven by consumer demand for convenient, effective, and eco-friendly oral care solutions. Established companies, such as Johnson and Johnson, Prestige Consumer Healthcare, GlaxoSmithKline, and Reckitt Benckiser Group, continue to provide effective denture cleansing tablets. Polident, a GlaxoSmithKline brand, offers products like Polident 3-Minute Denture Cleanser and Polident Smokers Denture Cleanser, ensuring quick and efficient cleaning.
What are the Dental Cleansing Tablet market trends shaping the Industry?
- The rising preference for private-label brands represents a significant market trend. This trend signifies a growing number of consumers opting for these brands over established ones due to factors such as affordability, quality, and unique offerings. The market is witnessing growth due to the rising demand for affordable and effective oral hygiene solutions. Private-label brands are gaining popularity in this market, driven by discount stores' commitment to delivering value to consumers. This trend is leading to the expansion of private-label dental cleansing tablets across various distribution channels, including supermarkets, hypermarkets, drug stores, and online platforms.
- Clinical trials and research in whitening agents and diagnostic tools are further driving market growth. Digital marketing, artificial intelligence, and x-ray imaging are also being integrated into dental care, enhancing the customer experience. Overall, the market is expected to continue its growth trajectory, driven by these market dynamics. Distributors are focusing on optimizing procurement processes and maintaining stringent quality control measures to ensure product reliability. Oral care professionals, such as dental hygienists, are also recognizing the benefits of dental cleansing tablets, leading to their increasing use in dental care routines.
How does Dental Cleansing Tablet market face challenges during its growth?
- The escalating adoption of oral care alternatives poses a significant challenge to the expansion of the industry. The market faces challenges from the dominance of traditional oral care products, such as toothpaste and toothbrushes. However, the market is not without growth opportunities. Factors like fresh breath, tartar control, and plaque removal continue to drive demand for dental cleansing tablets. Product differentiation through sustainable packaging and online shopping channels is also a growing trend. Dental insurance coverage for oral care products, including dental cleansing tablets, is another potential growth driver. Despite these opportunities, the market's expansion is hindered by the prices of dental cleansing tablets compared to traditional oral care products. To remain competitive, companies are focusing on product efficacy and innovation.
- Multi-benefit dental cleansing tablets, which offer tartar control, plaque removal, and other oral health benefits, are gaining popularity. Additionally, toothpaste tablets catering to specific oral concerns, such as sensitive teeth, are experiencing strong growth. Companies in the oral care industry are shifting towards customized and value-added product offerings to meet the evolving needs of consumers. Dental implants and other advanced dental solutions are also driving demand for effective oral care products, including dental cleansing tablets. Antibiotic resistance poses a significant threat, necessitating the development of alternative infection control strategies.
Exclusive Customer Landscape
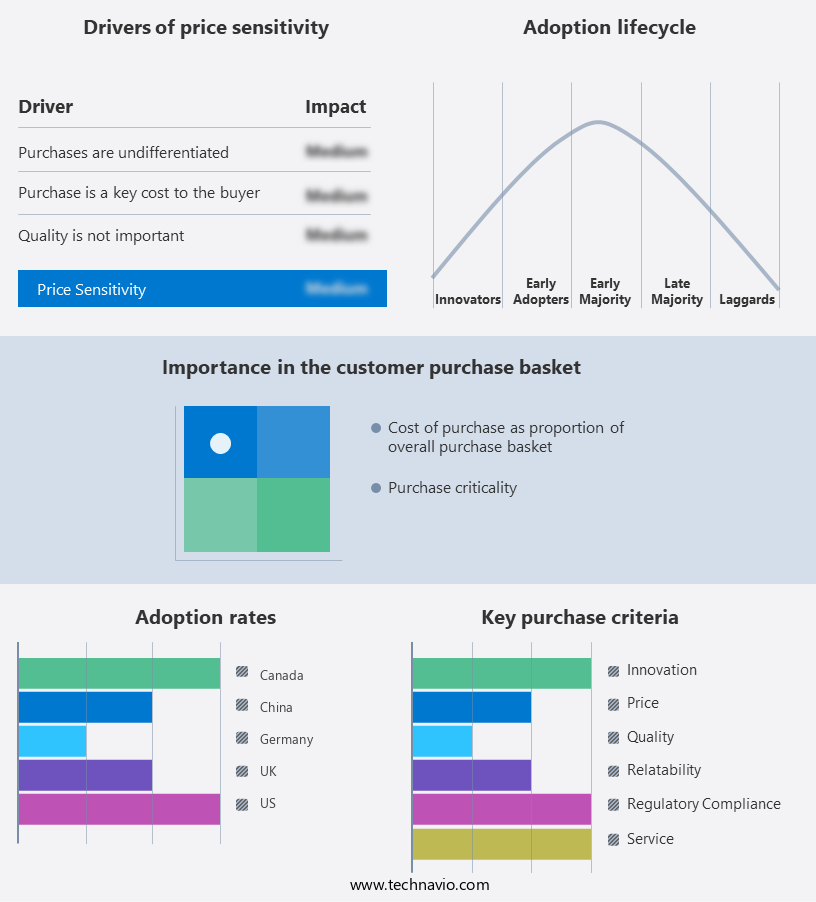
The dental cleansing tablet market forecasting report includes the adoption lifecycle of the market, covering from the innovator's stage to the laggard's stage. It focuses on adoption rates in different regions based on penetration. Furthermore, the dental cleansing tablet market report also includes key purchase criteria and drivers of price sensitivity to help companies evaluate and develop their market growth analysis strategies.
Customer Landscape
Key Companies & Market Insights
Companies are implementing various strategies, such as strategic alliances, dental cleansing tablet market forecast, partnerships, mergers and acquisitions, geographical expansion, and product/service launches, to enhance their presence in the industry.
Archtek Inc. - The company introduces dental cleansing tablets as an innovative alternative to traditional toothpaste.
The industry research and growth report includes detailed analyses of the competitive landscape of the market and information about key companies, including:
- Archtek Inc.
- ChildLife
- Colgate Palmolive Co.
- Dentsply Sirona Inc.
- Denttabs innovative Zahnpflegegesellschaft GmbH
- Georganics Ltd.
- GlaxoSmithKline Plc
- Henry Schein Inc.
- Johnson and Johnson Services Inc.
- Nelson Naturals Inc.
- PARLA
- Pearlie White
- Reckitt Benckiser Group Plc
- The Humble Co.
- The Kind Lab
Qualitative and quantitative analysis of companies has been conducted to help clients understand the wider business environment as well as the strengths and weaknesses of key industry players. Data is qualitatively analyzed to categorize companies as pure play, category-focused, industry-focused, and diversified; it is quantitatively analyzed to categorize companies as dominant, leading, strong, tentative, and weak.
Recent Development and News in Dental Cleansing Tablet Market
- In March 2023, Colgate-Palmolive introduced a new dental cleansing tablet product line, "Colgate MaxFresh Toothpaste Tablets," which aims to reduce plastic waste by offering an eco-friendly alternative to traditional toothpaste tubes (Colgate-Palmolive Press Release, 2023).
- In October 2024, GlaxoSmithKline (GSK) and 3M collaborated to co-develop and commercialize a new dental cleansing tablet technology, combining GSK's oral health expertise with 3M's innovative adhesive technologies (GSK Press Release, 2024).
- In January 2025, Dentsply Sirona, a leading dental solutions provider, acquired DentTab, a Dutch dental cleansing tablet manufacturer, to expand its product portfolio and strengthen its position in the eco-friendly oral care market (Dentsply Sirona Press Release, 2025).
- In May 2025, the European Commission approved the use of dental cleansing tablets as a viable alternative to traditional toothpaste, paving the way for increased market penetration and growth in the European Union (European Commission Press Release, 2025).
Research Analyst Overview
The market continues to evolve, driven by shifting consumer preferences and advancements in oral health care. Preventative care remains a priority, with quality control and fluoride delivery key considerations for manufacturers. Sensitive teeth and gum health are major concerns for consumers, leading to price sensitivity and increased demand for effective, affordable solutions. Social media engagement and digital marketing strategies are essential for building brand loyalty and reaching consumers. Oral hygiene remains a focus, with emerging technologies and oral health products, such as oral cancer screening, whitening agents, and diagnostic tools, gaining popularity. Dental insurance and distribution channels continue to shape market dynamics, with retail sales and online shopping offering convenience and accessibility.
Sustainable packaging and growth projections are also important factors, as consumers increasingly demand eco-friendly solutions and manufacturers seek to expand their reach. Dental implants and product differentiation are key areas of innovation, with plaque removal and tartar control remaining critical functions. Packaging design, ingredient sourcing, natural ingredients, and brushing technique are all areas of ongoing research and development. Customer reviews, sugar reduction, and antibacterial properties are important considerations for consumers, as are dental care routine and dental clinics. Pharmaceutical development, dental research, and advertising campaigns are all driving innovation in the market. The manufacturing process, dental hygienist involvement, x-ray imaging, and dental care routine all play a role in the ongoing evolution of the market.
Clinical trials and dental research are essential for ensuring the safety and effectiveness of new products. Artificial intelligence and dental research are driving advancements in dental care, with dental crowns and dental braces benefiting from these innovations. The market is expected to continue growing, with new technologies and product offerings shaping the future of oral health care.
Dive into Technavio's robust research methodology, blending expert interviews, extensive data synthesis, and validated models for unparalleled Dental Cleansing Tablet Market insights. See full methodology.
|
Market Scope |
|
|
Report Coverage |
Details |
|
Page number |
217 |
|
Base year |
2024 |
|
Historic period |
2019-2023 |
|
Forecast period |
2025-2029 |
|
Growth momentum & CAGR |
Accelerate at a CAGR of 7.4% |
|
Market growth 2025-2029 |
USD 652.4 million |
|
Market structure |
Fragmented |
|
YoY growth 2024-2025(%) |
6.8 |
|
Key countries |
US, China, Germany, Canada, UK, France, Japan, Italy, India, and Brazil |
|
Competitive landscape |
Leading Companies, Market Positioning of Companies, Competitive Strategies, and Industry Risks |
What are the Key Data Covered in this Dental Cleansing Tablet Market Research and Growth Report?
- CAGR of the Dental Cleansing Tablet industry during the forecast period
- Detailed information on factors that will drive the growth and forecasting between 2025 and 2029
- Precise estimation of the size of the market and its contribution of the industry in focus to the parent market
- Accurate predictions about upcoming growth and trends and changes in consumer behaviour
- Growth of the market across North America, Europe, Asia, and Rest of World (ROW)
- Thorough analysis of the market's competitive landscape and detailed information about companies
- Comprehensive analysis of factors that will challenge the dental cleansing tablet market growth of industry companies
We can help! Our analysts can customize this dental cleansing tablet market research report to meet your requirements.
 RIA -
RIA - 
