Dentures Market Size 2024-2028
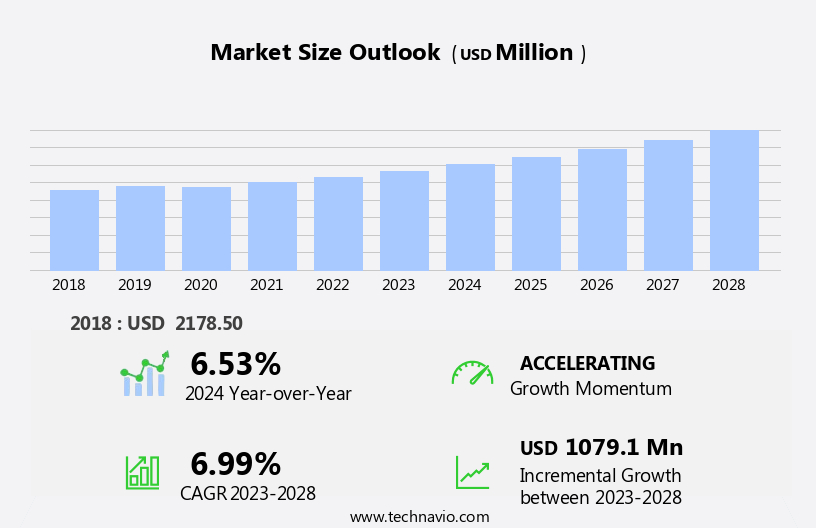
The dentures market size is forecast to increase by USD 1.08 billion, at a CAGR of 6.99% between 2023 and 2028.
- The market is characterized by a high demand for dental care solutions, driven by an aging population and increasing prevalence of tooth loss. This demand is further fueled by the growing trend of dental tourism, which offers affordable dental services in countries with lower costs. However, the market faces challenges, including the availability of alternatives such as dental implants and bridges, which may be perceived as more desirable options by some consumers. Additionally, advances in technology continue to influence the market, with innovations in materials and manufacturing processes leading to more comfortable and functional dentures.
- Companies in the market must navigate these trends and challenges to capitalize on opportunities and maintain a competitive edge. Strategic partnerships, product innovation, and cost competitiveness will be key differentiators for success in this dynamic market.
What will be the Size of the Dentures Market during the forecast period?
Explore in-depth regional segment analysis with market size data - historical 2018-2022 and forecasts 2024-2028 - in the full report.
Request Free Sample
The market continues to evolve, driven by advancements in technology and growing demand for superior oral health solutions. Oral hygiene remains a priority, with complete dentures integrating soft tissue management and customized fit through the use of intraoral scanners and bite registration. Maxillofacial prosthetics expand beyond traditional acrylic resin dentures, with implant-supported dentures and zirconia implants gaining popularity. CAD/CAM technology streamlines the manufacturing process, enabling faster turnaround times and increased precision. Stock dentures offer affordability, while custom dentures cater to individual needs. Intraoral scanners and digital dentistry facilitate more accurate impressions, reducing the need for impression trays and follow-up appointments.
Oral pathology and esthetic considerations are increasingly important, with denture materials and designs focusing on natural appearance and patient comfort. Bite registrations and occlusal adjustments ensure proper jaw relation and vertical dimension, ensuring optimal function and comfort. The market also accommodates various sectors, including geriatric dentistry, TMJ disorders, and implantology. Aftercare instructions and denture cleaners maintain the longevity of dentures, while dental software and treatment planning tools streamline the dental process. The ongoing unfolding of market activities includes ongoing research and development in areas such as bone grafting, sinus lifts, and 3D printing, providing new opportunities for innovation and growth.
The market continues to adapt and evolve, meeting the diverse needs of patients and the ever-changing landscape of dentistry.
How is this Dentures Industry segmented?
The dentures industry research report provides comprehensive data (region-wise segment analysis), with forecasts and estimates in "USD million" for the period 2024-2028, as well as historical data from 2018-2022 for the following segments.
- Product
- Partial dentures
- Complete dentures
- End-user
- Hospitals
- Dental clinics
- Others
- Material
- Alginates
- Vinyl polysiloxane
- Polyether
- Polysulphides
- Others
- Geography
- North America
- US
- Europe
- Germany
- UK
- APAC
- China
- Japan
- Rest of World (ROW)
- North America
By Product Insights
The partial dentures segment is estimated to witness significant growth during the forecast period.
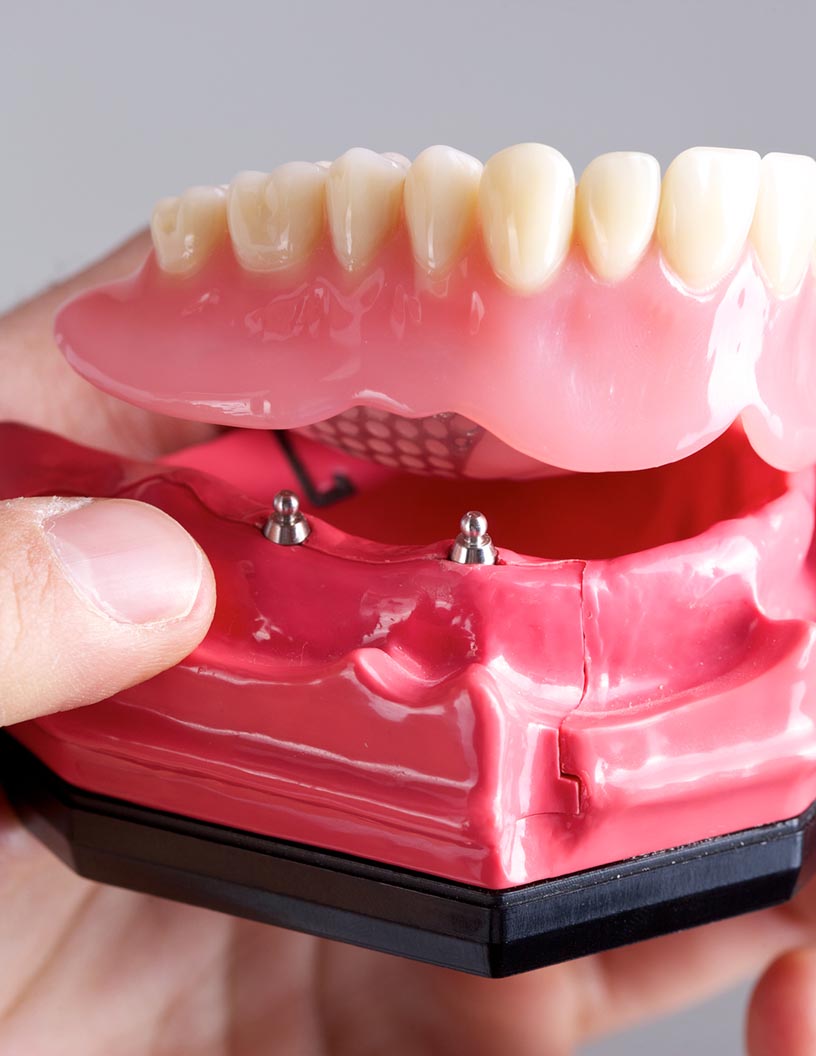
Partial dentures are removable prosthetic devices designed to replace missing teeth and support nearby natural teeth that lack the strength to hold bridges or when more than one or two teeth are absent. These dentures consist of artificial teeth attached to a pink or gum-colored base, which is connected to the remaining natural teeth using a metal framework, clasps, or connectors. In some instances, precision attachments are utilized to create a more aesthetically pleasing appearance than clasps provide. The manufacturing process of partial dentures involves a combination of metal and acrylic materials, resulting in a stronger structure than those made solely from acrylic.
Geriatric dentistry plays a significant role in the market, as the aging population requires an increased number of partial dentures due to tooth loss. Oral cancer screening is essential during the denture-making process to ensure early detection and treatment. Denture adhesives and relines are necessary for maintaining the denture's stability and comfort. Digital dentistry, including intraoral scanners and dental software, streamlines the denture-making process, while occlusal adjustments ensure proper bite alignment. Aesthetic considerations are essential for patient satisfaction, leading to the use of porcelain teeth and zirconia implants. Dental milling machines and CAD/CAM technology enable customized denture fabrication.
Oral pathology, TMJ disorders, and oral hygiene are crucial factors affecting denture usage and longevity. Aftercare instructions, including follow-up appointments and denture cleaning, are essential for maintaining the denture's functionality and longevity. Treatment planning, denture repairs, and patient education are integral aspects of the denture-making process. Innovations in technology include 3D printing, jaw relation recordings, bone grafting, and implant-supported dentures. Soft tissue management and ridge augmentation techniques enhance the denture's fit and durability. Valplast dentures and metal frameworks cater to various patient preferences and needs. Impression trays and impression materials are essential for creating accurate denture molds.
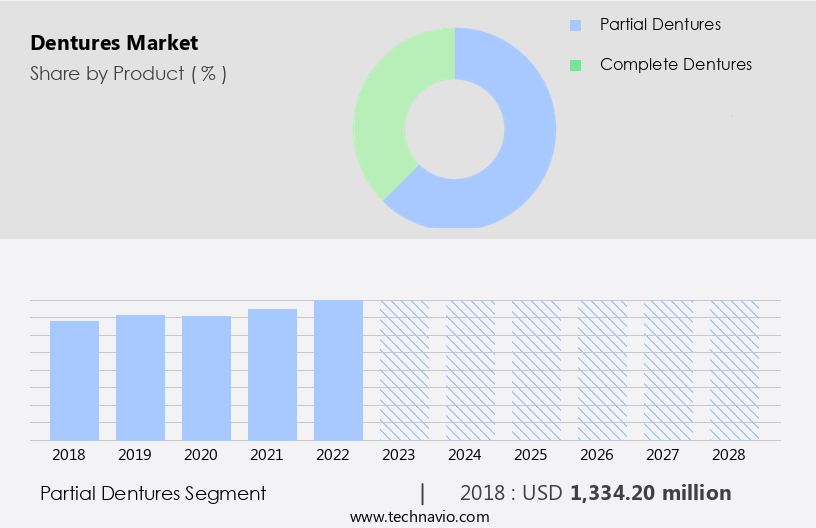
The Partial dentures segment was valued at USD 1.33 billion in 2018 and showed a gradual increase during the forecast period.
Regional Analysis
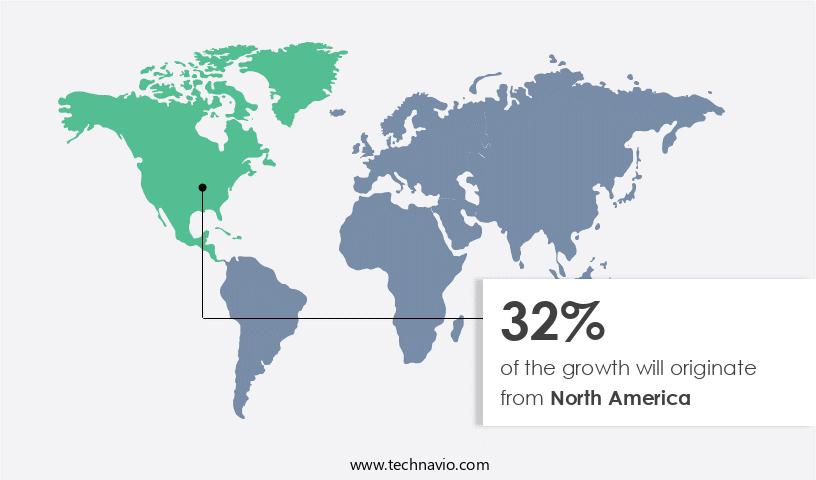
North America is estimated to contribute 32% to the growth of the global market during the forecast period. Technavio's analysts have elaborately explained the regional trends and drivers that shape the market during the forecast period.
The market experienced significant growth in 2020, with North America leading the revenue generation. The US, in particular, dominated the market due to extensive healthcare insurance coverage, increasing R&D expenditure among companies, and the widespread use of advanced technological products. The geriatric population in North America has seen a notable increase, making them more susceptible to edentulism and consequently driving demand for complete and partial flexible dentures. This trend is further fueled by the availability of various denture options, including porcelain teeth, metal dentures, and acrylic resin, catering to esthetic considerations and functional requirements.
Digital dentistry, such as intraoral scanners and dental software, has revolutionized the denture-making process, ensuring precision and accuracy. Oral cancer screening, a crucial aspect of dental care, is increasingly integrated into dental practices, ensuring early detection and treatment. Denture adhesives, relines, and denture soaks continue to be essential accessories for denture wearers. The market also incorporates innovative technologies like 3D printing, CAD/CAM technology, and implant-supported dentures, offering enhanced functionality and durability. Oral hygiene and aftercare instructions are emphasized to ensure the longevity of dentures. The market further caters to diverse patient needs through custom dentures, partial dentures, and implant-supported dentures, addressing various dental conditions, such as TMJ disorders and ridge augmentation.
Denture repairs, using metal frameworks and denture cleaners, are also part of the market landscape. Patient education plays a crucial role in the market, ensuring that individuals are well-informed about denture options, care, and maintenance.
Market Dynamics
Our researchers analyzed the data with 2023 as the base year, along with the key drivers, trends, and challenges. A holistic analysis of drivers will help companies refine their marketing strategies to gain a competitive advantage.
What are the key market drivers leading to the rise in the adoption of Dentures Industry?
- The high demand for dental care, driven by an increasing awareness of oral health and a growing population, serves as the primary market motivator.
- The demand for dental solutions, including dentures and partial dentures, is on the rise due to the increasing prevalence of oral diseases leading to tooth loss. Poor oral hygiene associated with gum disease can result in various health complications, such as preterm labor, diabetes, heart attacks, and strokes. In response, the dental industry continues to innovate and advance, integrating technology to meet consumer needs. This includes the use of dental milling machines for creating acrylic dentures, 3D printing for customized solutions, and dental software for improved patient care. Additionally, the integration of titanium implants and bone grafting techniques offer more durable and natural-looking alternatives.
- Furthermore, the emergence of teledentistry and computer-assisted technology provide greater access to dental care, particularly in underserved areas. Oral pathology, TMJ disorders, and jaw relation concerns are also being addressed through these technological advancements. Proper aftercare instructions are essential to ensure the longevity and effectiveness of these dental solutions.
What are the market trends shaping the Dentures Industry?
- Dental tourism is an emerging market trend, with an increasing number of individuals seeking affordable and high-quality dental care outside their home countries.
- The global market for dentures and maxillofacial prosthetics is witnessing significant growth due to the increasing prevalence of oral health issues and the rising demand for affordable dental solutions. Complete dentures remain a popular choice for individuals with missing teeth, while intraoral scanners and CAD/CAM technology enable the creation of custom dentures for improved fit and comfort. Maxillofacial prosthetics, including implant-supported dentures and ridge augmentation procedures, offer more stable and functional solutions for patients. Soft tissue management techniques ensure a natural appearance and improved oral hygiene. Emerging technologies, such as zirconia implants and implant-supported dentures, provide durable and esthetic alternatives to traditional dentures.
- Dental tourism, particularly in countries like Mexico, Brazil, India, Israel, Hungary, and Thailand, offers affordable dental solutions for people in developed countries, leading to increased competition among service providers. Providers like Nordic Medical Travel facilitate medical tourism by organizing travel and appointments, making dental care more accessible and convenient for international patients.
What challenges does the Dentures Industry face during its growth?
- The growth of the industry is significantly influenced by the limited availability of viable alternatives.
- The market faces restrictions due to the availability of alternatives like dental implants, dental bridges, overdentures, and hybrid dentures. Among these, dental implants are the most effective solution for missing teeth, providing a permanent and durable replacement. Implants are placed in the jaw bone, allowing the teeth to be restored and even used in conjunction with implant-supported dentures and dental bridges. Dental bridges consist of one or multiple prosthetic teeth attached to natural teeth or implants, preserving the mouth's structural integrity. Suitable for replacing 1-2 teeth, they offer durability and relatively lower costs compared to dentures. Flexible dentures, such as Valplast dentures, offer advantages like improved comfort and fit, making them a popular choice for some patients.
- Proper treatment planning, including the use of impression trays and impression materials, is crucial for ensuring a successful denture fitting. Patients require follow-up appointments for denture adjustments and repairs, ensuring their oral health and the longevity of their dentures. Denture cleaners are essential for maintaining oral hygiene and the longevity of dentures. Patient education plays a vital role in the success of denture treatment, ensuring patients understand the importance of proper care and maintenance.
Exclusive Customer Landscape
The dentures market forecasting report includes the adoption lifecycle of the market, covering from the innovator's stage to the laggard's stage. It focuses on adoption rates in different regions based on penetration. Furthermore, the dentures market report also includes key purchase criteria and drivers of price sensitivity to help companies evaluate and develop their market growth analysis strategies.

Customer Landscape
Key Companies & Market Insights
Companies are implementing various strategies, such as strategic alliances, dentures market forecast, partnerships, mergers and acquisitions, geographical expansion, and product/service launches, to enhance their presence in the industry.
Amann Girrbach AG - The Ceramill Full Denture System is a leading innovation in the field of denture technology.
The industry research and growth report includes detailed analyses of the competitive landscape of the market and information about key companies, including:
- Amann Girrbach AG
- Aspen Dental Management Inc.
- Coltene Whaledent AG
- Dental Manufacturing Spa
- DENTCA Inc.
- Dentsply Sirona Inc.
- Desktop Metal Inc.
- DIO Implant Co. Ltd.
- Global Dental Science LLC
- VITA Zahnfabrik
- Ivoclar Vivadent AG
- Keystone Industries
- Merz Dental GmbH
- Modern Dental Group Ltd.
- New Stetic SA
- Renishaw Plc
- Shandong Huge Dental Material Corp.
- Shofu Inc.
- Thommen Medical AG
- ZimVie Inc.
Qualitative and quantitative analysis of companies has been conducted to help clients understand the wider business environment as well as the strengths and weaknesses of key industry players. Data is qualitatively analyzed to categorize companies as pure play, category-focused, industry-focused, and diversified; it is quantitatively analyzed to categorize companies as dominant, leading, strong, tentative, and weak.
Recent Development and News in Dentures Market
- In January 2024, Dentsply Sirona, a leading dental solutions provider, announced the launch of its new complete denture line, "Ceraray CAD," at the International Dental Show in Cologne, Germany. This digitally manufactured denture solution utilizes CAD/CAM technology to create customized dentures with enhanced fit and functionality (Dentsply Sirona press release).
- In March 2024, 3M and Geistlich Pharma entered into a strategic partnership to co-develop and commercialize innovative dental implant solutions. This collaboration aims to combine 3M's dental and biomaterials expertise with Geistlich's implant systems and biomaterials (3M press release).
- In May 2024, Nobel Biocare, a leading dental solutions company, received FDA approval for its All-on-4® Treatment Concept with Brånemark System⢠implants. This approval marked a significant milestone in the market, as it expanded the indications for the treatment concept to include edentulous patients with severely resorbed jawbones (Nobel Biocare press release).
- In April 2025, Colosseum Dental Group, a European dental group, completed the acquisition of Dentalcorp, a Canadian dental services organization. This acquisition expanded Colosseum's presence in North America and strengthened its position as a global dental services provider (Colosseum Dental Group press release).
Research Analyst Overview
- The market encompasses a diverse range of products and technologies, with a focus on enhancing the quality of life for individuals with missing teeth. Key components of dentures include locator and bar attachments, precision attachments, and surgical techniques, which ensure proper implant placement and patient satisfaction. Infection control and material science are critical factors, with an emphasis on infection resistance, wear resistance, and mechanical properties of dental materials such as polymers and metals. Manufacturing processes play a pivotal role in producing high-quality dentures. Clinical trials are ongoing to evaluate the impact of denture design and material properties on soft tissue health and bone density.
- Alternative prosthetics, including magnetic attachments, are gaining popularity due to their advantages in retention and patient comfort. Surgical techniques for implant placement continue to evolve, with a focus on minimally invasive procedures and improved infection control. Material science research in polymer chemistry and dental materials is driving advancements in denture base design, resulting in increased fracture resistance and improved patient outcomes. Treatment alternatives, such as alternative prosthetics and surgical techniques, are transforming the market. Incorporating the latest advancements in material science and manufacturing processes, these innovations offer enhanced functionality, durability, and patient satisfaction. The market is characterized by a strong focus on quality control and infection control, with manufacturers investing in advanced technologies to ensure the highest standards of precision and safety.
- The market is expected to remain dynamic, with ongoing research and development in material science, manufacturing processes, and surgical techniques shaping the future of denture technology.
Dive into Technavio's robust research methodology, blending expert interviews, extensive data synthesis, and validated models for unparalleled Dentures Market insights. See full methodology.
|
Market Scope |
|
|
Report Coverage |
Details |
|
Page number |
188 |
|
Base year |
2023 |
|
Historic period |
2018-2022 |
|
Forecast period |
2024-2028 |
|
Growth momentum & CAGR |
Accelerate at a CAGR of 6.99% |
|
Market growth 2024-2028 |
USD 1079.1 million |
|
Market structure |
Fragmented |
|
YoY growth 2023-2024(%) |
6.53 |
|
Key countries |
US, Germany, China, UK, and Japan |
|
Competitive landscape |
Leading Companies, Market Positioning of Companies, Competitive Strategies, and Industry Risks |
What are the Key Data Covered in this Dentures Market Research and Growth Report?
- CAGR of the Dentures industry during the forecast period
- Detailed information on factors that will drive the growth and forecasting between 2024 and 2028
- Precise estimation of the size of the market and its contribution of the industry in focus to the parent market
- Accurate predictions about upcoming growth and trends and changes in consumer behaviour
- Growth of the market across North America, Europe, Asia, and Rest of World (ROW)
- Thorough analysis of the market's competitive landscape and detailed information about companies
- Comprehensive analysis of factors that will challenge the dentures market growth of industry companies
We can help! Our analysts can customize this dentures market research report to meet your requirements.
 RIA -
RIA - 
