Diagnostic Wearable Medical Devices Market Analysis North America, Europe, Asia, Rest of World (ROW) - US, UK, Germany, China, Japan - Size and Forecast 2024-2028

Diagnostic Wearable Medical Devices Market Analysis North America, Europe, Asia, Rest of World (ROW) - US, UK, Germany, China, Japan - Size and Forecast 2024-2028

Published: Feb 2024 174 Pages SKU: IRTNTR70808

Market Overview at a Glance

$8.76 B
Market Opportunity
15.69%
CAGR
14.82
YoY growth 2023-2024(%)

Diagnostic Wearable Medical Devices Market Size 2024-2028

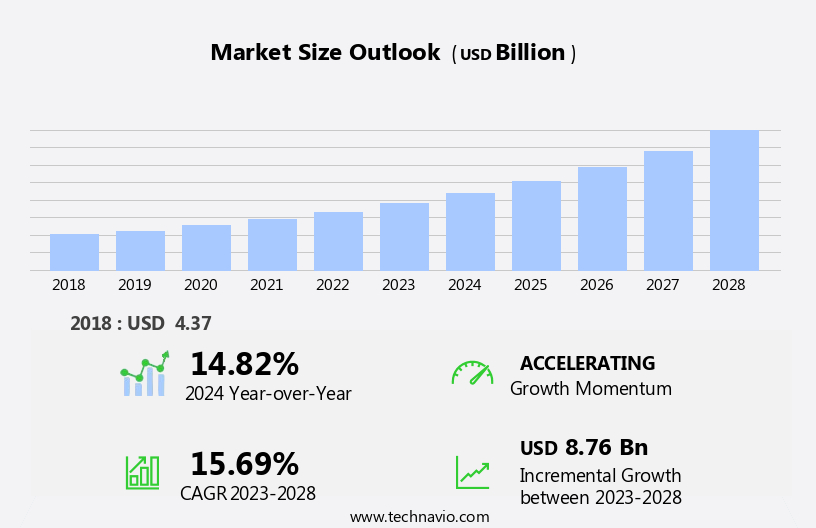
The diagnostic wearable medical devices market size is forecast to increase by USD 8.76 billion, at a CAGR of 15.69% between 2023 and 2028.

  • The market is experiencing significant growth, driven by the increasing prevalence of chronic diseases and the expanding utilization of these devices in the medical sector. The integration of advanced technologies, such as machine learning and artificial intelligence, is enabling these devices to deliver accurate and timely diagnoses, enhancing their appeal to both healthcare providers and patients. However, the market faces challenges related to user acceptance and adherence to diagnostic wearable medical devices. Patients may find the devices intrusive or uncomfortable, leading to reluctance to use them consistently.
  • Additionally, concerns regarding data privacy and security can hinder adoption. To capitalize on market opportunities and navigate these challenges effectively, companies must focus on designing user-friendly devices, addressing privacy concerns, and providing clear communication regarding the benefits and importance of consistent usage. By addressing these factors, they can foster trust and confidence in the technology, ultimately driving growth in the market.

What will be the Size of the Diagnostic Wearable Medical Devices Market during the forecast period?

Diagnostic Wearable Medical Devices Market Size

Explore in-depth regional segment analysis with market size data - historical 2018-2022 and forecasts 2024-2028 - in the full report.  
Request Free Sample

The market continues to evolve, integrating advanced technologies to monitor and analyze various health parameters. Blood oxygen saturation, electrocardiogram analysis, patient data encryption, electrodermal activity, sleep apnea detection, muscle activity monitoring, skin conductance, gyroscope data, temperature sensing, vital signs monitoring, body composition analysis, heart rate variability, and pulse oximetry are among the key features. Wearable sensors, wireless communication, and mobile app integration enable real-time data acquisition and analysis. Diagnostic algorithms and machine learning models facilitate accurate interpretation of the data, while telemedicine integration and remote patient monitoring expand access to healthcare services.

ECG monitoring, insulin delivery systems, drug delivery patches, and respiratory rate monitoring are some applications. Continuous innovation drives the market, with new technologies and applications unfolding, ensuring a dynamic and evolving landscape.

How is this Diagnostic Wearable Medical Devices Industry segmented?

The diagnostic wearable medical devices industry research report provides comprehensive data (region-wise segment analysis), with forecasts and estimates in "USD billion" for the period 2024-2028, as well as historical data from 2018-2022 for the following segments.

  • Device
    • Vital signs monitors
    • Sleep and activity monitors
    • Fetal and obstetric monitoring devices
    • Neuromonitoring devices
    • ECG monitors
  • Application
    • Home healthcare
    • Sports and fitness
    • Remote patient monitoring
  • Geography
    • North America
      • US
    • Europe
      • Germany
      • UK
    • APAC
      • China
      • Japan
    • Rest of World (ROW)

By Device Insights

The vital signs monitors segment is estimated to witness significant growth during the forecast period.

The market is witnessing significant growth, driven by the increasing preference for proactive health monitoring. Vital signs monitors, as a leading device type sub-segment, continuously track essential indicators like heart rate, blood pressure, oxygen saturation, and more. Market leaders, such as Apple and Fitbit, are introducing advanced diagnostic wearables with integrated vital signs monitoring capabilities, fueling market expansion. Consumers' growing demand for real-time health information is a primary growth driver. However, data privacy concerns, legal constraints, and accuracy limitations pose challenges. To address these concerns, the industry is transitioning towards customized healthcare, advanced sensor technology, and AI for data analysis.

Wearable sensors, including ECG monitors, respiratory rate monitors, and biometric data acquisition devices, are integral to this evolution. Additionally, telemedicine integration, insulin delivery systems, activity tracking, and machine learning models are revolutionizing healthcare, enabling remote patient monitoring and early disease detection. Wireless communication, cloud data storage, and health data analytics further enhance the value proposition of these devices. In conclusion, the market is poised for continued growth, driven by advancements in technology, consumer demand, and the shift towards personalized healthcare.

Diagnostic Wearable Medical Devices Market Size

Request Free Sample

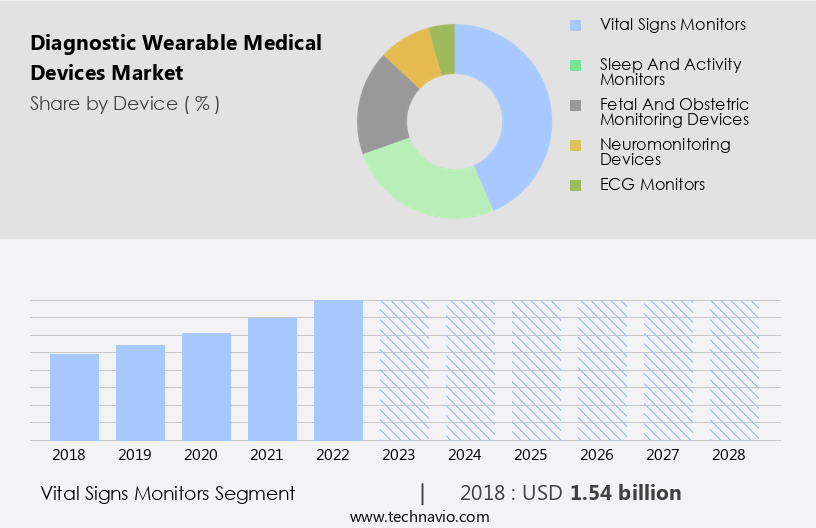
The Vital signs monitors segment was valued at USD 1.54 billion in 2018 and showed a gradual increase during the forecast period.

Regional Analysis

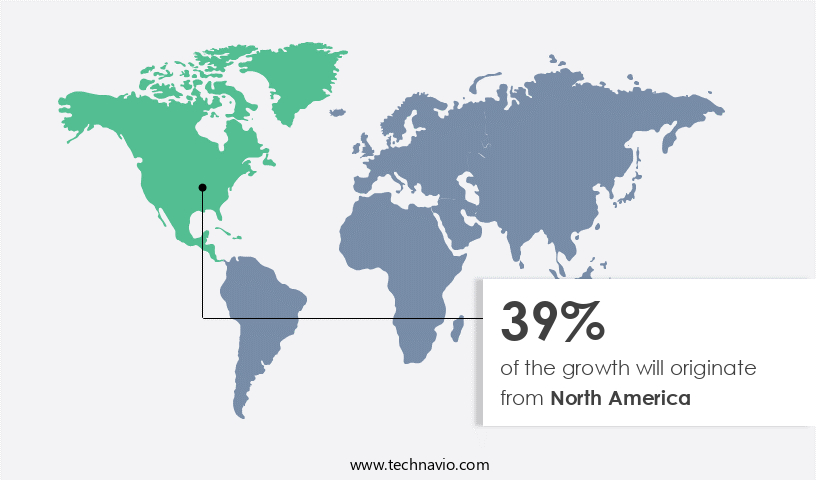
North America is estimated to contribute 39% to the growth of the global market during the forecast period. Technavio's analysts have elaborately explained the regional trends and drivers that shape the market during the forecast period.

Diagnostic Wearable Medical Devices Market Share by Geography

 Request Free Sample

In the dynamic landscape of healthcare technology, diagnostic wearable medical devices have emerged as a game-changer. These devices, which integrate fall detection, Bluetooth connectivity, data security protocols, mobile app integration, diagnostic algorithms, insulin delivery systems, activity tracking, telemedicine integration, ECG monitoring, remote patient monitoring, wearable sensors, respiratory rate monitoring, biometric data acquisition, drug delivery patches, cloud data storage, continuous glucose monitoring, blood oxygen saturation, electrocardiogram analysis, patient data encryption, electrodermal activity, sleep apnea detection, muscle activity monitoring, skin conductance, gyroscope data, temperature sensing, vital signs monitoring, body composition analysis, wireless communication, machine learning models, heart rate variability, pulse oximetry, health data analytics, and accelerometer data, are revolutionizing disease management and prevention.

The North American market, spearheaded by the US, dominates this sector due to a rising incidence of chronic diseases, increased prevalence of heart and respiratory disorders, and a growing awareness of health concerns. The future promises continuous diagnosis, seamless integration with healthcare systems, and personalized treatment plans.

Market Dynamics

Our researchers analyzed the data with 2023 as the base year, along with the key drivers, trends, and challenges. A holistic analysis of drivers will help companies refine their marketing strategies to gain a competitive advantage.

The market is experiencing significant growth as technology advances and the need for remote patient monitoring increases. Wearable sensors, a key component of these devices, collect valuable health data that can be interpreted to improve diagnostic accuracy. However, ensuring the accuracy of continuous glucose monitoring and other health readings is crucial, as patient data privacy and security are paramount. Remote monitoring systems must be integrated seamlessly to allow real-time analysis, while machine learning algorithms, such as those used for ECG analysis, can enhance diagnostic capabilities. Energy efficiency is another essential factor in wearable devices, as is telemedicine platform compatibility and biometric data encryption protocols. Patient compliance is improved through user-friendly designs, including those tailored to elderly patients, and algorithm bias mitigation techniques. Sensor miniaturization technologies enable more discreet and comfortable devices, while clinical validation and regulatory requirements ensure their effectiveness and safety. Data visualization and mobile app integration facilitate effective data management, and data interoperability and standardization enable seamless information exchange between devices and healthcare providers. Optimizing wearable device battery life and improving diagnostic algorithm accuracy through machine learning further enhance their value. As the market continues to evolve, these advancements will contribute to improved patient outcomes and more efficient healthcare systems.

What are the key market drivers leading to the rise in the adoption of Diagnostic Wearable Medical Devices Industry?

  • The rising incidence of chronic diseases serves as the primary catalyst for market growth. 
  • Diagnostic wearable medical devices have gained significant attention in the healthcare industry due to their ability to monitor and manage various chronic conditions in real-time. These devices, which include fall detection systems, insulin delivery systems, and activity trackers, among others, leverage Bluetooth connectivity and mobile app integration for seamless data transfer and analysis. Diagnostic algorithms integrated into these devices enable early detection and intervention, improving patient outcomes and reducing hospitalizations. The importance of data security protocols is paramount in this context, ensuring patient privacy and data confidentiality. Telemedicine integration further enhances the capabilities of these devices, enabling remote consultations and real-time monitoring, thereby improving accessibility and convenience.
  • Chronic diseases such as cardiovascular diseases (CVDs), chronic respiratory diseases, and diabetes continue to pose significant health challenges worldwide. According to the World Health Organization (WHO), nearly 1 billion people live with elevated blood pressure, resulting in approximately 9.4 million deaths annually, with over 50% attributable to stroke and the remaining to cardiac disorders. The global impact of CVDs is comparable to that of Alzheimer's disease, breast, cervical, prostate, and colorectal cancers combined. In response to these health concerns, diagnostic wearable medical devices are increasingly being adopted to improve patient care and reduce healthcare costs.
  • These devices offer a non-invasive, cost-effective, and convenient solution for managing chronic conditions, ultimately leading to better health outcomes.

What are the market trends shaping the Diagnostic Wearable Medical Devices Industry?

  • The use of diagnostic wearable medical devices is gaining significant traction in the medical sector, representing an emerging market trend. This technology enables continuous health monitoring and early detection of various health conditions, offering numerous benefits to both patients and healthcare providers.
  • The market is experiencing significant growth due to the integration of advanced technologies and increasing consumer demand for remote health monitoring. Companies are developing innovative solutions to cater to this trend, focusing on enhancing the functionality and usability of their devices. For instance, ECG monitoring wearables, such as those offered by Philips, utilize digital biosensors to record and transmit real-time biometric data to cloud-based platforms for remote patient monitoring. Similarly, wearable sensors for respiratory rate monitoring and continuous glucose monitoring enable individuals and healthcare professionals to closely monitor health conditions.
  • Furthermore, drug delivery patches and biometric data acquisition devices offer convenience and precision in managing various health issues. The market's future potential lies in the ability to provide accurate, real-time health information, enabling early intervention and improved patient outcomes.

What challenges does the Diagnostic Wearable Medical Devices Industry face during its growth?

  • The growth of the diagnostic wearable medical devices industry is significantly impacted by challenges related to user acceptance and adherence. This issue, which is of great concern, hinders the industry's expansion and underscores the need for effective strategies to address user apprehensions and ensure consistent use of these devices. 
  • The market faces acceptance challenges due to user discomfort and social stigma. Continuous monitoring devices, such as those for blood oxygen saturation or electrocardiogram analysis, may cause discomfort, leading to noncompliance. Individuals with chronic conditions, like diabetes, may avoid wearing continuous glucose monitoring devices due to persistent skin penetration. Wearable devices for mental health conditions can raise social and psychological concerns due to their visible nature.
  • Patient data encryption is crucial to address privacy concerns and build trust in the market. Advanced technologies like electrodermal activity, sleep apnea detection, muscle activity monitoring, skin conductance, and gyroscope data contribute to the market's growth. Ensuring user comfort and addressing privacy concerns are essential to drive market acceptance and growth.

Exclusive Customer Landscape

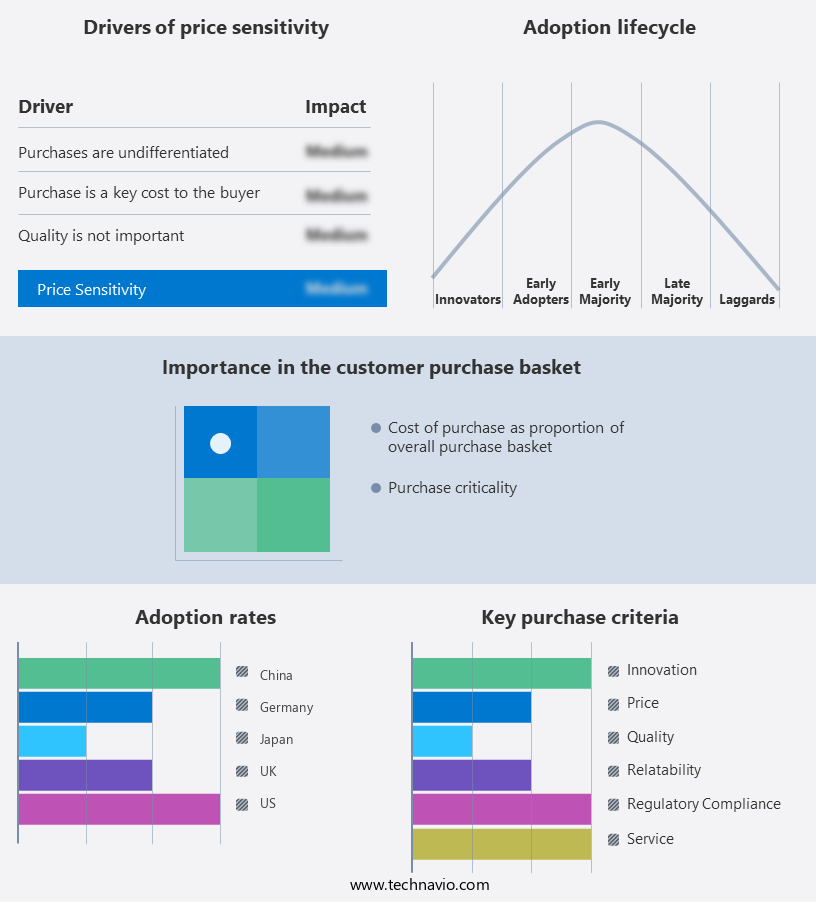
The diagnostic wearable medical devices market forecasting report includes the adoption lifecycle of the market, covering from the innovator's stage to the laggard's stage. It focuses on adoption rates in different regions based on penetration. Furthermore, the diagnostic wearable medical devices market report also includes key purchase criteria and drivers of price sensitivity to help companies evaluate and develop their market growth analysis strategies.

Diagnostic Wearable Medical Devices Market Share by Geography

 Customer Landscape

Key Companies & Market Insights

Companies are implementing various strategies, such as strategic alliances, diagnostic wearable medical devices market forecast, partnerships, mergers and acquisitions, geographical expansion, and product/service launches, to enhance their presence in the industry.

Activinsights Ltd. - This company specializes in medical wearable technology, producing devices like GENEActiv and Activinsights for monitoring and analyzing health data. 

The industry research and growth report includes detailed analyses of the competitive landscape of the market and information about key companies, including:

  • Activinsights Ltd.
  • AliveCor Inc.
  • Alphabet Inc.
  • Apple Inc.
  • Boyd Corp.
  • BTS Bioengineering Corp.
  • Cleveland Medical Devices Inc.
  • Dragerwerk AG and Co. KGaA
  • Johari Digital India Ltd.
  • Koninklijke Philips N.V.
  • Medtronic Plc
  • Meril Life Sciences Pvt. Ltd.
  • Molex LLC
  • Murata Vios, Inc.
  • OMRON Corp.
  • ResMed Inc.
  • Sanmina Corp.
  • VitalConnect Inc.
  • Wellue Health
  • Intelesens Ltd.

Qualitative and quantitative analysis of companies has been conducted to help clients understand the wider business environment as well as the strengths and weaknesses of key industry players. Data is qualitatively analyzed to categorize companies as pure play, category-focused, industry-focused, and diversified; it is quantitatively analyzed to categorize companies as dominant, leading, strong, tentative, and weak.

Recent Development and News in Diagnostic Wearable Medical Devices Market

  • In January 2024, Fitbit, a leading wearable technology company, announced the launch of its newest product, Fitbit Sense 2, featuring advanced health monitoring capabilities, including an Electrocardiogram (ECG) app and a Blood Oxygen Saturation (SpO2) sensor (Fitbit Press Release, 2024).
  • In March 2024, Apple and Abbott, a global healthcare leader, announced a strategic partnership to integrate Abbott's FreeStyle Libre glucose monitoring system with Apple Watch, enabling real-time glucose monitoring for diabetes patients (Apple Newsroom, 2024).
  • In April 2025, Siemens Healthineers, a leading medical technology company, completed the acquisition of Caradigm, a health analytics and population health management company, to expand its diagnostic and digital health offerings (Siemens Healthineers Press Release, 2025).
  • In May 2025, the U.S. Food and Drug Administration (FDA) granted clearance to Dexcom, a diabetes care company, for its G6 CGM system, which is the first continuous glucose monitoring system with a 10-day wear duration (Dexcom Press Release, 2025).

Research Analyst Overview

  • The market is experiencing significant advancements, driven by device miniaturization and the integration of algorithm validation for personalized healthcare. Chronic disease management is a primary focus, with data visualization tools and interoperability enabling seamless information exchange between devices and healthcare providers. Risk mitigation strategies, such as sensor calibration and data transmission protocols, ensure accurate and reliable data. Power consumption optimization and wearable comfort are essential considerations for patient compliance. FDA approval processes and clinical validation studies ensure regulatory compliance and patient safety features.
  • Medical grade materials and accuracy assessment are crucial for medical-grade devices, while predictive analytics and patient engagement tools facilitate early disease detection. Data privacy regulations and user interface design are essential for maintaining patient trust and ensuring healthcare data standards. Regulatory compliance, battery life extension, signal processing techniques, remote diagnostics, and precision medicine applications further expand the market's potential.

Dive into Technavio's robust research methodology, blending expert interviews, extensive data synthesis, and validated models for unparalleled Diagnostic Wearable Medical Devices Market insights. See full methodology.

Market Scope

Report Coverage

Details

Page number

174

Base year

2023

Historic period

2018-2022

Forecast period

2024-2028

Growth momentum & CAGR

Accelerate at a CAGR of 15.69%

Market growth 2024-2028

USD 8.76 billion

Market structure

Fragmented

YoY growth 2023-2024(%)

14.82

Key countries

US, UK, Germany, China, and Japan

Competitive landscape

Leading Companies, Market Positioning of Companies, Competitive Strategies, and Industry Risks

Request Free Sample

What are the Key Data Covered in this Diagnostic Wearable Medical Devices Market Research and Growth Report?

  • CAGR of the Diagnostic Wearable Medical Devices industry during the forecast period
  • Detailed information on factors that will drive the growth and forecasting between 2024 and 2028
  • Precise estimation of the size of the market and its contribution of the industry in focus to the parent market
  • Accurate predictions about upcoming growth and trends and changes in consumer behaviour
  • Growth of the market across North America, Europe, Asia, and Rest of World (ROW)
  • Thorough analysis of the market's competitive landscape and detailed information about companies
  • Comprehensive analysis of factors that will challenge the diagnostic wearable medical devices market growth of industry companies

We can help! Our analysts can customize this diagnostic wearable medical devices market research report to meet your requirements.

Get in touch

1 Executive Summary

  • 1.1 Market overview
    • Exhibit 01: Executive Summary – Chart on Market Overview
    • Exhibit 02: Executive Summary – Data Table on Market Overview
    • Exhibit 03: Executive Summary – Chart on Global Market Characteristics
    • Exhibit 04: Executive Summary – Chart on Market by Geography
    • Exhibit 05: Executive Summary – Chart on Market Segmentation by Device
    • Exhibit 06: Executive Summary – Chart on Market Segmentation by Application
    • Exhibit 07: Executive Summary – Chart on Incremental Growth
    • Exhibit 08: Executive Summary – Data Table on Incremental Growth
    • Exhibit 09: Executive Summary – Chart on Vendor Market Positioning

2 Market Landscape

  • 2.1 Market ecosystem
    • Exhibit 10: Parent market
    • Exhibit 11: Market Characteristics

3 Market Sizing

  • 3.1 Market definition
    • Exhibit 12: Offerings of vendors included in the market definition
  • 3.2 Market segment analysis
    • Exhibit 13: Market segments
  • 3.3 Market size 2023
    • 3.4 Market outlook: Forecast for 2023-2028
      • Exhibit 14: Chart on Global - Market size and forecast 2023-2028 ($ billion)
      • Exhibit 15: Data Table on Global - Market size and forecast 2023-2028 ($ billion)
      • Exhibit 16: Chart on Global Market: Year-over-year growth 2023-2028 (%)
      • Exhibit 17: Data Table on Global Market: Year-over-year growth 2023-2028 (%)

    4 Historic Market Size

    • 4.1 Global diagnostic wearable medical devices market 2018 - 2022
      • Exhibit 18: Historic Market Size – Data Table on global diagnostic wearable medical devices market 2018 - 2022 ($ billion)
    • 4.2 Device Segment Analysis 2018 - 2022
      • Exhibit 19: Historic Market Size – Device Segment 2018 - 2022 ($ billion)
    • 4.3 Application Segment Analysis 2018 - 2022
      • Exhibit 20: Historic Market Size – Application Segment 2018 - 2022 ($ billion)
    • 4.4 Geography Segment Analysis 2018 - 2022
      • Exhibit 21: Historic Market Size – Geography Segment 2018 - 2022 ($ billion)
    • 4.5 Country Segment Analysis 2018 - 2022
      • Exhibit 22: Historic Market Size – Country Segment 2018 - 2022 ($ billion)

    5 Five Forces Analysis

    • 5.1 Five forces summary
      • Exhibit 23: Five forces analysis - Comparison between 2023 and 2028
    • 5.2 Bargaining power of buyers
      • Exhibit 24: Chart on Bargaining power of buyers – Impact of key factors 2023 and 2028
    • 5.3 Bargaining power of suppliers
      • Exhibit 25: Bargaining power of suppliers – Impact of key factors in 2023 and 2028
    • 5.4 Threat of new entrants
      • Exhibit 26: Threat of new entrants – Impact of key factors in 2023 and 2028
    • 5.5 Threat of substitutes
      • Exhibit 27: Threat of substitutes – Impact of key factors in 2023 and 2028
    • 5.6 Threat of rivalry
      • Exhibit 28: Threat of rivalry – Impact of key factors in 2023 and 2028
    • 5.7 Market condition
      • Exhibit 29: Chart on Market condition - Five forces 2023 and 2028

    6 Market Segmentation by Device

    • 6.1 Market segments
      • Exhibit 30: Chart on Device - Market share 2023-2028 (%)
      • Exhibit 31: Data Table on Device - Market share 2023-2028 (%)
    • 6.2 Comparison by Device
      • Exhibit 32: Chart on Comparison by Device
      • Exhibit 33: Data Table on Comparison by Device
    • 6.3 Vital signs monitors - Market size and forecast 2023-2028
      • Exhibit 34: Chart on Vital signs monitors - Market size and forecast 2023-2028 ($ billion)
      • Exhibit 35: Data Table on Vital signs monitors - Market size and forecast 2023-2028 ($ billion)
      • Exhibit 36: Chart on Vital signs monitors - Year-over-year growth 2023-2028 (%)
      • Exhibit 37: Data Table on Vital signs monitors - Year-over-year growth 2023-2028 (%)
    • 6.4 Sleep and activity monitors - Market size and forecast 2023-2028
      • Exhibit 38: Chart on Sleep and activity monitors - Market size and forecast 2023-2028 ($ billion)
      • Exhibit 39: Data Table on Sleep and activity monitors - Market size and forecast 2023-2028 ($ billion)
      • Exhibit 40: Chart on Sleep and activity monitors - Year-over-year growth 2023-2028 (%)
      • Exhibit 41: Data Table on Sleep and activity monitors - Year-over-year growth 2023-2028 (%)
    • 6.5 Fetal and obstetric monitoring devices - Market size and forecast 2023-2028
      • Exhibit 42: Chart on Fetal and obstetric monitoring devices - Market size and forecast 2023-2028 ($ billion)
      • Exhibit 43: Data Table on Fetal and obstetric monitoring devices - Market size and forecast 2023-2028 ($ billion)
      • Exhibit 44: Chart on Fetal and obstetric monitoring devices - Year-over-year growth 2023-2028 (%)
      • Exhibit 45: Data Table on Fetal and obstetric monitoring devices - Year-over-year growth 2023-2028 (%)
    • 6.6 Neuromonitoring devices - Market size and forecast 2023-2028
      • Exhibit 46: Chart on Neuromonitoring devices - Market size and forecast 2023-2028 ($ billion)
      • Exhibit 47: Data Table on Neuromonitoring devices - Market size and forecast 2023-2028 ($ billion)
      • Exhibit 48: Chart on Neuromonitoring devices - Year-over-year growth 2023-2028 (%)
      • Exhibit 49: Data Table on Neuromonitoring devices - Year-over-year growth 2023-2028 (%)
    • 6.7 ECG monitors - Market size and forecast 2023-2028
      • Exhibit 50: Chart on ECG monitors - Market size and forecast 2023-2028 ($ billion)
      • Exhibit 51: Data Table on ECG monitors - Market size and forecast 2023-2028 ($ billion)
      • Exhibit 52: Chart on ECG monitors - Year-over-year growth 2023-2028 (%)
      • Exhibit 53: Data Table on ECG monitors - Year-over-year growth 2023-2028 (%)
    • 6.8 Market opportunity by Device
      • Exhibit 54: Market opportunity by Device ($ billion)
      • Exhibit 55: Data Table on Market opportunity by Device ($ billion)

    7 Market Segmentation by Application

    • 7.1 Market segments
      • Exhibit 56: Chart on Application - Market share 2023-2028 (%)
      • Exhibit 57: Data Table on Application - Market share 2023-2028 (%)
    • 7.2 Comparison by Application
      • Exhibit 58: Chart on Comparison by Application
      • Exhibit 59: Data Table on Comparison by Application
    • 7.3 Home healthcare - Market size and forecast 2023-2028
      • Exhibit 60: Chart on Home healthcare - Market size and forecast 2023-2028 ($ billion)
      • Exhibit 61: Data Table on Home healthcare - Market size and forecast 2023-2028 ($ billion)
      • Exhibit 62: Chart on Home healthcare - Year-over-year growth 2023-2028 (%)
      • Exhibit 63: Data Table on Home healthcare - Year-over-year growth 2023-2028 (%)
    • 7.4 Sports and fitness - Market size and forecast 2023-2028
      • Exhibit 64: Chart on Sports and fitness - Market size and forecast 2023-2028 ($ billion)
      • Exhibit 65: Data Table on Sports and fitness - Market size and forecast 2023-2028 ($ billion)
      • Exhibit 66: Chart on Sports and fitness - Year-over-year growth 2023-2028 (%)
      • Exhibit 67: Data Table on Sports and fitness - Year-over-year growth 2023-2028 (%)
    • 7.5 Remote patient monitoring - Market size and forecast 2023-2028
      • Exhibit 68: Chart on Remote patient monitoring - Market size and forecast 2023-2028 ($ billion)
      • Exhibit 69: Data Table on Remote patient monitoring - Market size and forecast 2023-2028 ($ billion)
      • Exhibit 70: Chart on Remote patient monitoring - Year-over-year growth 2023-2028 (%)
      • Exhibit 71: Data Table on Remote patient monitoring - Year-over-year growth 2023-2028 (%)
    • 7.6 Market opportunity by Application
      • Exhibit 72: Market opportunity by Application ($ billion)
      • Exhibit 73: Data Table on Market opportunity by Application ($ billion)

    8 Customer Landscape

    • 8.1 Customer landscape overview
      • Exhibit 74: Analysis of price sensitivity, lifecycle, customer purchase basket, adoption rates, and purchase criteria

    9 Geographic Landscape

    • 9.1 Geographic segmentation
      • Exhibit 75: Chart on Market share by geography 2023-2028 (%)
      • Exhibit 76: Data Table on Market share by geography 2023-2028 (%)
    • 9.2 Geographic comparison
      • Exhibit 77: Chart on Geographic comparison
      • Exhibit 78: Data Table on Geographic comparison
    • 9.3 North America - Market size and forecast 2023-2028
      • Exhibit 79: Chart on North America - Market size and forecast 2023-2028 ($ billion)
      • Exhibit 80: Data Table on North America - Market size and forecast 2023-2028 ($ billion)
      • Exhibit 81: Chart on North America - Year-over-year growth 2023-2028 (%)
      • Exhibit 82: Data Table on North America - Year-over-year growth 2023-2028 (%)
    • 9.4 Europe - Market size and forecast 2023-2028
      • Exhibit 83: Chart on Europe - Market size and forecast 2023-2028 ($ billion)
      • Exhibit 84: Data Table on Europe - Market size and forecast 2023-2028 ($ billion)
      • Exhibit 85: Chart on Europe - Year-over-year growth 2023-2028 (%)
      • Exhibit 86: Data Table on Europe - Year-over-year growth 2023-2028 (%)
    • 9.5 Asia - Market size and forecast 2023-2028
      • Exhibit 87: Chart on Asia - Market size and forecast 2023-2028 ($ billion)
      • Exhibit 88: Data Table on Asia - Market size and forecast 2023-2028 ($ billion)
      • Exhibit 89: Chart on Asia - Year-over-year growth 2023-2028 (%)
      • Exhibit 90: Data Table on Asia - Year-over-year growth 2023-2028 (%)
    • 9.6 Rest of World (ROW) - Market size and forecast 2023-2028
      • Exhibit 91: Chart on Rest of World (ROW) - Market size and forecast 2023-2028 ($ billion)
      • Exhibit 92: Data Table on Rest of World (ROW) - Market size and forecast 2023-2028 ($ billion)
      • Exhibit 93: Chart on Rest of World (ROW) - Year-over-year growth 2023-2028 (%)
      • Exhibit 94: Data Table on Rest of World (ROW) - Year-over-year growth 2023-2028 (%)
    • 9.7 US - Market size and forecast 2023-2028
      • Exhibit 95: Chart on US - Market size and forecast 2023-2028 ($ billion)
      • Exhibit 96: Data Table on US - Market size and forecast 2023-2028 ($ billion)
      • Exhibit 97: Chart on US - Year-over-year growth 2023-2028 (%)
      • Exhibit 98: Data Table on US - Year-over-year growth 2023-2028 (%)
    • 9.8 China - Market size and forecast 2023-2028
      • Exhibit 99: Chart on China - Market size and forecast 2023-2028 ($ billion)
      • Exhibit 100: Data Table on China - Market size and forecast 2023-2028 ($ billion)
      • Exhibit 101: Chart on China - Year-over-year growth 2023-2028 (%)
      • Exhibit 102: Data Table on China - Year-over-year growth 2023-2028 (%)
    • 9.9 UK - Market size and forecast 2023-2028
      • Exhibit 103: Chart on UK - Market size and forecast 2023-2028 ($ billion)
      • Exhibit 104: Data Table on UK - Market size and forecast 2023-2028 ($ billion)
      • Exhibit 105: Chart on UK - Year-over-year growth 2023-2028 (%)
      • Exhibit 106: Data Table on UK - Year-over-year growth 2023-2028 (%)
    • 9.10 Germany - Market size and forecast 2023-2028
      • Exhibit 107: Chart on Germany - Market size and forecast 2023-2028 ($ billion)
      • Exhibit 108: Data Table on Germany - Market size and forecast 2023-2028 ($ billion)
      • Exhibit 109: Chart on Germany - Year-over-year growth 2023-2028 (%)
      • Exhibit 110: Data Table on Germany - Year-over-year growth 2023-2028 (%)
    • 9.11 Japan - Market size and forecast 2023-2028
      • Exhibit 111: Chart on Japan - Market size and forecast 2023-2028 ($ billion)
      • Exhibit 112: Data Table on Japan - Market size and forecast 2023-2028 ($ billion)
      • Exhibit 113: Chart on Japan - Year-over-year growth 2023-2028 (%)
      • Exhibit 114: Data Table on Japan - Year-over-year growth 2023-2028 (%)
    • 9.12 Market opportunity by geography
      • Exhibit 115: Market opportunity by geography ($ billion)
      • Exhibit 116: Data Tables on Market opportunity by geography ($ billion)

    10 Drivers, Challenges, and Trends

    • 10.1 Market drivers
      • 10.2 Market challenges
        • 10.3 Impact of drivers and challenges
          • Exhibit 117: Impact of drivers and challenges in 2023 and 2028
        • 10.4 Market trends

          11 Vendor Landscape

          • 11.1 Overview
            • 11.2 Vendor landscape
              • Exhibit 118: Overview on Criticality of inputs and Factors of differentiation
            • 11.3 Landscape disruption
              • Exhibit 119: Overview on factors of disruption
            • 11.4 Industry risks
              • Exhibit 120: Impact of key risks on business

            12 Vendor Analysis

            • 12.1 Vendors covered
              • Exhibit 121: Vendors covered
            • 12.2 Market positioning of vendors
              • Exhibit 122: Matrix on vendor position and classification
            • 12.3 Activinsights Ltd.
              • Exhibit 123: Activinsights Ltd. - Overview
              • Exhibit 124: Activinsights Ltd. - Product / Service
              • Exhibit 125: Activinsights Ltd. - Key offerings
            • 12.4 AliveCor Inc.
              • Exhibit 126: AliveCor Inc. - Overview
              • Exhibit 127: AliveCor Inc. - Product / Service
              • Exhibit 128: AliveCor Inc. - Key offerings
            • 12.5 Alphabet Inc.
              • Exhibit 129: Alphabet Inc. - Overview
              • Exhibit 130: Alphabet Inc. - Business segments
              • Exhibit 131: Alphabet Inc. - Key news
              • Exhibit 132: Alphabet Inc. - Key offerings
              • Exhibit 133: Alphabet Inc. - Segment focus
            • 12.6 BTS Bioengineering Corp.
              • Exhibit 134: BTS Bioengineering Corp. - Overview
              • Exhibit 135: BTS Bioengineering Corp. - Product / Service
              • Exhibit 136: BTS Bioengineering Corp. - Key offerings
            • 12.7 Cleveland Medical Devices Inc.
              • Exhibit 137: Cleveland Medical Devices Inc. - Overview
              • Exhibit 138: Cleveland Medical Devices Inc. - Product / Service
              • Exhibit 139: Cleveland Medical Devices Inc. - Key offerings
            • 12.8 Dragerwerk AG and Co. KGaA
              • Exhibit 140: Dragerwerk AG and Co. KGaA - Overview
              • Exhibit 141: Dragerwerk AG and Co. KGaA - Business segments
              • Exhibit 142: Dragerwerk AG and Co. KGaA - Key offerings
              • Exhibit 143: Dragerwerk AG and Co. KGaA - Segment focus
            • 12.9 Intelesens Ltd.
              • Exhibit 144: Intelesens Ltd. - Overview
              • Exhibit 145: Intelesens Ltd. - Product / Service
              • Exhibit 146: Intelesens Ltd. - Key offerings
            • 12.10 Koninklijke Philips N.V.
              • Exhibit 147: Koninklijke Philips N.V. - Overview
              • Exhibit 148: Koninklijke Philips N.V. - Business segments
              • Exhibit 149: Koninklijke Philips N.V. - Key news
              • Exhibit 150: Koninklijke Philips N.V. - Key offerings
              • Exhibit 151: Koninklijke Philips N.V. - Segment focus
            • 12.11 Medtronic Plc
              • Exhibit 152: Medtronic Plc - Overview
              • Exhibit 153: Medtronic Plc - Business segments
              • Exhibit 154: Medtronic Plc - Key news
              • Exhibit 155: Medtronic Plc - Key offerings
              • Exhibit 156: Medtronic Plc - Segment focus
            • 12.12 Molex LLC
              • Exhibit 157: Molex LLC - Overview
              • Exhibit 158: Molex LLC - Product / Service
              • Exhibit 159: Molex LLC - Key offerings
            • 12.13 Murata Vios, Inc.
              • Exhibit 160: Murata Vios, Inc. - Overview
              • Exhibit 161: Murata Vios, Inc. - Product / Service
              • Exhibit 162: Murata Vios, Inc. - Key offerings
            • 12.14 OMRON Corp.
              • Exhibit 163: OMRON Corp. - Overview
              • Exhibit 164: OMRON Corp. - Business segments
              • Exhibit 165: OMRON Corp. - Key news
              • Exhibit 166: OMRON Corp. - Key offerings
              • Exhibit 167: OMRON Corp. - Segment focus
            • 12.15 ResMed Inc.
              • Exhibit 168: ResMed Inc. - Overview
              • Exhibit 169: ResMed Inc. - Business segments
              • Exhibit 170: ResMed Inc. - Key news
              • Exhibit 171: ResMed Inc. - Key offerings
              • Exhibit 172: ResMed Inc. - Segment focus
            • 12.16 VitalConnect Inc.
              • Exhibit 173: VitalConnect Inc. - Overview
              • Exhibit 174: VitalConnect Inc. - Product / Service
              • Exhibit 175: VitalConnect Inc. - Key offerings
            • 12.17 Wellue Health
              • Exhibit 176: Wellue Health - Overview
              • Exhibit 177: Wellue Health - Product / Service
              • Exhibit 178: Wellue Health - Key offerings

            13 Appendix

            • 13.1 Scope of the report
              • 13.2 Inclusions and exclusions checklist
                • Exhibit 179: Inclusions checklist
                • Exhibit 180: Exclusions checklist
              • 13.3 Currency conversion rates for US$
                • Exhibit 181: Currency conversion rates for US$
              • 13.4 Research methodology
                • Exhibit 182: Research methodology
                • Exhibit 183: Validation techniques employed for market sizing
                • Exhibit 184: Information sources
              • 13.5 List of abbreviations
                • Exhibit 185: List of abbreviations

              Research Methodology

              Technavio presents a detailed picture of the market by way of study, synthesis, and summation of data from multiple sources. The analysts have presented the various facets of the market with a particular focus on identifying the key industry influencers. The data thus presented is comprehensive, reliable, and the result of extensive research, both primary and secondary.

              INFORMATION SOURCES

              Primary sources

              • Manufacturers and suppliers
              • Channel partners
              • Industry experts
              • Strategic decision makers

              Secondary sources

              • Industry journals and periodicals
              • Government data
              • Financial reports of key industry players
              • Historical data
              • Press releases

              DATA ANALYSIS

              Data Synthesis

              • Collation of data
              • Estimation of key figures
              • Analysis of derived insights

              Data Validation

              • Triangulation with data models
              • Reference against proprietary databases
              • Corroboration with industry experts

              REPORT WRITING

              Qualitative

              • Market drivers
              • Market challenges
              • Market trends
              • Five forces analysis

              Quantitative

              • Market size and forecast
              • Market segmentation
              • Geographical insights
              • Competitive landscape

              Interested in this report?

              Get your sample now to see our research methodology and insights!

              Download Now

              Frequently Asked Questions

              Diagnostic Wearable Medical Devices market growth will increase by $ 8.76 bn during 2024-2028.

              The Diagnostic Wearable Medical Devices market is expected to grow at a CAGR of 15.69% during 2024-2028.

              Diagnostic Wearable Medical Devices market is segmented by Device( Vital signs monitors, Sleep and activity monitors, Fetal and obstetric monitoring devices, Neuromonitoring devices, ECG monitors) Application( Home healthcare, Sports and fitness, Remote patient monitoring, Neuromonitoring devices, ECG monitors)

              Activinsights Ltd., AliveCor Inc., Alphabet Inc., Apple Inc., Boyd Corp., BTS Bioengineering Corp., Cleveland Medical Devices Inc., Dragerwerk AG and Co. KGaA, Johari Digital India Ltd., Koninklijke Philips N.V., Medtronic Plc, Meril Life Sciences Pvt. Ltd., Molex LLC, Murata Vios, Inc., OMRON Corp., ResMed Inc., Sanmina Corp., VitalConnect Inc., Wellue Health, Intelesens Ltd. are a few of the key vendors in the Diagnostic Wearable Medical Devices market.

              North America will register the highest growth rate of 39% among the other regions. Therefore, the Diagnostic Wearable Medical Devices market in North America is expected to garner significant business opportunities for the vendors during the forecast period.

              US, UK, Germany, China, Japan

              • Increasing prevalence of chronic diseasesA sedentary lifestyle negatively affects the homeostasis of the body is the driving factor this market.
              • making people susceptible to many chronic illnesses is the driving factor this market.
              • such as CVDs is the driving factor this market.
              • diabetes is the driving factor this market.
              • and sleep apnea. Treatment of all these diseases has become critical is the driving factor this market.
              • leading to hospitalization. Among chronic diseases is the driving factor this market.
              • CVD is the leading cause is the driving factor this market.
              • followed by chronic respiratory diseases and diabetes. According to the WHO is the driving factor this market.
              • nearly 970 million people worldwide have elevated blood pressure is the driving factor this market.
              • of which 9.4 million die each year. This includes 51% of deaths because of stroke and the rest due to cardiac disorders. According to the Sudden Cardiac Arrest Foundation is the driving factor this market.
              • the number of fatalities caused worldwide by CVDs is almost as much as those caused by Alzheimers disease and breast is the driving factor this market.
              • cervical is the driving factor this market.
              • prostate is the driving factor this market.
              • and colorectal cancers combined. In 2021 is the driving factor this market.
              • the WHO estimated that globally is the driving factor this market.
              • there were nearly 1 billion people aged 60 and above is the driving factor this market.
              • which is expected to double by 2050. Notably is the driving factor this market.
              • chronic diseases are more common in the elderly is the driving factor this market.
              • particularly those over the age of 65. In 2021 is the driving factor this market.
              • according to the National Center for Biotechnology Information (NCBI) is the driving factor this market.
              • it was estimated that sleep apnea affected over 936 million people worldwide and 24 million people in the US. These chronic diseases require self-care diagnostic wearable medical devices to monitor the severity of patients medical conditions daily and maintain medical health records. Individuals are choosing diagnostic wearable medical devices to monitor vital signs at regular intervals to avoid future complications related to various chronic conditions.  Therefore is the driving factor this market.
              • the increasing population base with chronic conditions and an aging population can augment the demand for diagnostic wearable medical devices is the driving factor this market.
              • which in turn is expected to drive the growth of the global diagnostic wearable medical devices market during the forecast period.  is the driving factor this market.

              The Diagnostic Wearable Medical Devices market vendors should focus on grabbing business opportunities from the Vital signs monitors segment as it accounted for the largest market share in the base year.