Wheel Loaders Market Analysis, Size, and Forecast 2026-2030: APAC (China, India, and Japan), North America (US, Canada, and Mexico), Europe (Germany, UK, and France), South America (Brazil and Argentina), Middle East and Africa (Saudi Arabia, UAE, and South Africa), and Rest of World (ROW)

Wheel Loaders Market Analysis, Size, and Forecast 2026-2030:
APAC (China, India, and Japan), North America (US, Canada, and Mexico), Europe (Germany, UK, and France), South America (Brazil and Argentina), Middle East and Africa (Saudi Arabia, UAE, and South Africa), and Rest of World (ROW)

Published: Apr 2026 297 Pages SKU: IRTNTR40660

Market Overview at a Glance

$31.46 B
Market Opportunity
10%
CAGR 2025 - 2030
34.9%
APAC Growth
$27.59 B
Construction segment 2024

Wheel Loaders Market Size 2026-2030

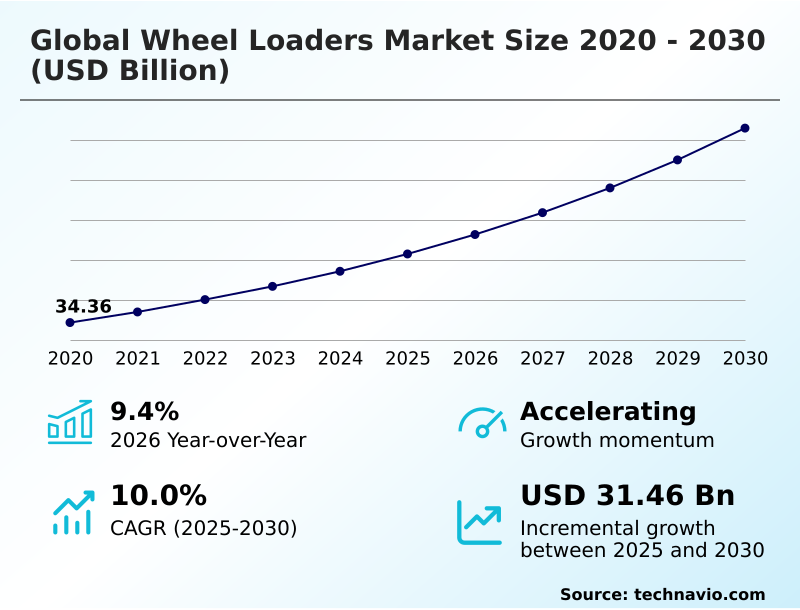
The wheel loaders market size is valued to increase by USD 31.46 billion, at a CAGR of 10% from 2025 to 2030. Expansion of global infrastructure and urbanization initiatives will drive the wheel loaders market.

Major Market Trends & Insights

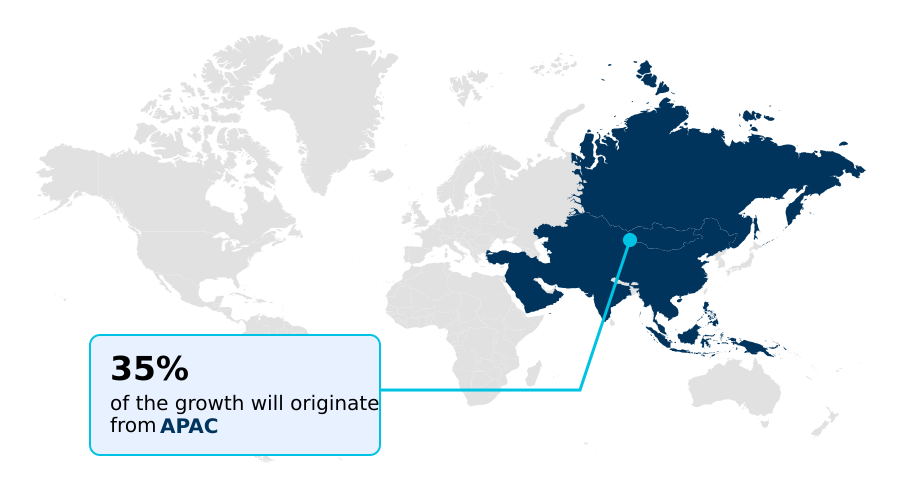
  • APAC dominated the market and accounted for a 34.9% growth during the forecast period.
  • By End-user - Construction segment was valued at USD 27.59 billion in 2024
  • By Power Output - More than 80 HP segment accounted for the largest market revenue share in 2024

Market Size & Forecast

  • Market Opportunities: USD 48.61 billion
  • Market Future Opportunities: USD 31.46 billion
  • CAGR from 2025 to 2030 : 10%

Market Summary

  • The wheel loaders market is undergoing a significant transformation, driven by technological advancement and evolving end-user requirements. A primary driver is the global expansion of infrastructure projects, which necessitates efficient and powerful earthmoving equipment. Concurrently, a major trend is the shift toward sustainability, with manufacturers increasingly developing hybrid powertrain architectures and fully electric models to comply with stricter emissions standards.
  • This transition to green technology is particularly evident in urban construction, where reduced noise and zero tailpipe emissions are critical.
  • For instance, a logistics firm managing a large urban distribution center might deploy a fleet of electric compact wheel loaders for indoor and outdoor material handling, leveraging their quiet operation for 24/7 schedules while using advanced telematics systems to monitor battery status and optimize charging cycles, thereby reducing operational costs and environmental impact.
  • However, the industry faces challenges from supply chain disruptions affecting the availability of critical components like semiconductors and high-grade steel, alongside a persistent shortage of skilled operators capable of managing technologically advanced machinery. The integration of industrial AI, remote-control operation, and predictive maintenance capabilities represents the industry's response, aiming to boost productivity and safety while mitigating labor gaps.

What will be the Size of the Wheel Loaders Market during the forecast period?

Get Key Insights on Market Forecast (PDF) Request Free Sample

How is the Wheel Loaders Market Segmented?

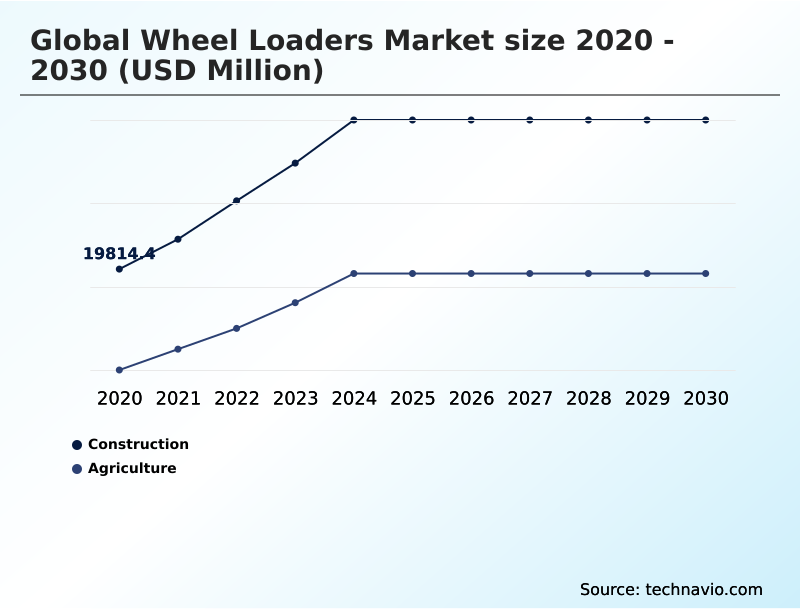
The wheel loaders industry research report provides comprehensive data (region-wise segment analysis), with forecasts and estimates in "USD million" for the period 2026-2030, as well as historical data from 2020-2024 for the following segments.

  • End-user
    • Construction
    • Agriculture
  • Power output
    • More than 80 HP
    • 40 to 80 HP
    • Less than 40 HP
  • Product type
    • Medium
    • Large
    • Compact
  • Geography
    • APAC
      • China
      • India
      • Japan
    • North America
      • US
      • Canada
      • Mexico
    • Europe
      • Germany
      • UK
      • France
    • South America
      • Brazil
      • Argentina
    • Middle East and Africa
      • Saudi Arabia
      • UAE
      • South Africa
    • Rest of World (ROW)

By End-user Insights

The construction segment is estimated to witness significant growth during the forecast period.

The construction segment remains the primary end-user, with a significant shift toward specialized machinery for urban redevelopment. Demand is centered on high-efficiency equipment that integrates digital solutions to optimize site productivity and reduce idle times.

This includes the adoption of compact wheel loaders for confined urban spaces and larger earthmoving equipment for major infrastructure projects. Modern intelligent machine control systems are a key focus, improving grading accuracy by over 25% and contributing to operational sustainability.

The adoption of semi-autonomous features and zero-emission construction machinery is accelerating, driven by the need for precision engineering in data-driven construction environments.

This evolution addresses both the total cost of ownership and the increasing complexity of large-scale civil engineering projects, demanding high-performance heavy loaders and advanced site preparation machinery.

Request Free Sample

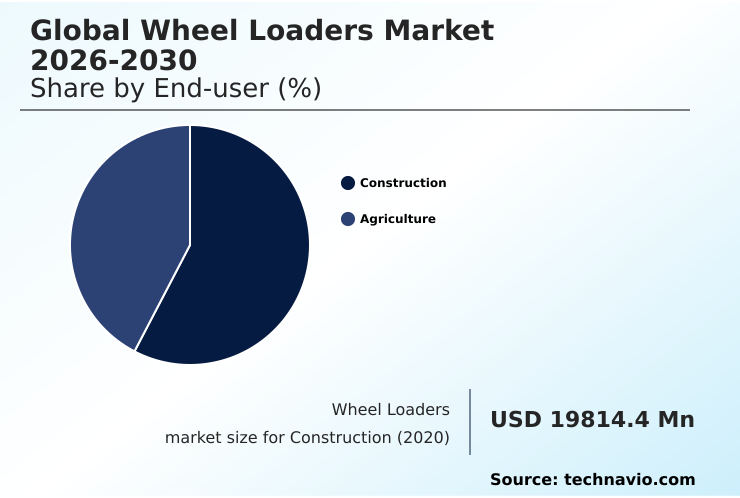
The Construction segment was valued at USD 27.59 billion in 2024 and showed a gradual increase during the forecast period.

Request Free Sample

Regional Analysis

APAC is estimated to contribute 34.9% to the growth of the global market during the forecast period.Technavio’s analysts have elaborately explained the regional trends and drivers that shape the market during the forecast period.

See How Wheel Loaders Market Demand is Rising in APAC Request Free Sample

The geographic landscape is characterized by diverse regional demands and technological adoption rates. APAC leads market expansion, contributing nearly 35% of the incremental growth, driven by massive infrastructure projects in China and India where robust, cost-effective machinery is essential.

In contrast, North America and Europe focus on advanced technology, adopting large wheel loaders and sophisticated joystick steering for quarrying and upgrading public works with sustainable energy infrastructure.

European markets, in particular, pioneer the use of bio-hydraulic oils and circular economy practices.

In South America, a pilot program for hybrid-electric wheel loaders demonstrated a 20% extension in battery life, highlighting the region's focus on operational efficiency in high-altitude mining operations.

This global variance requires manufacturers to offer a diverse portfolio, from heritage-sensitive compact units for urban projects to high-performance heavy loaders for resource extraction.

Market Dynamics

Our researchers analyzed the data with 2025 as the base year, along with the key drivers, trends, and challenges. A holistic analysis of drivers will help companies refine their marketing strategies to gain a competitive advantage.

  • Strategic decision-making for fleet acquisition requires a thorough analysis of both immediate and long-term factors. A fleet manager must evaluate the benefits of telematics in wheel loaders, which can improve asset utilization and enable predictive maintenance for wheel loader fleets.
  • The choice between traditional diesel and emerging technologies involves weighing the initial cost of ownership for electric wheel loaders against their lower operational expenses and ability to meet tightening emission standards. For urban projects, electric wheel loaders for urban construction are becoming essential. In parallel, heavy industries are exploring autonomous wheel loaders in mining to enhance safety and productivity.
  • Key performance considerations include improving wheel loader cycle times and reducing wheel loader fuel consumption, which is directly tied to wheel loader hydraulic system efficiency. Incorporating advanced operator comfort and ergonomic design, alongside robust wheel loader operator safety features, is crucial for retention and performance.
  • Fleets using telematics for wheel loader fleet management have reported fuel savings of up to 15% compared to unmonitored operations, showcasing how technology directly impacts profitability. This detailed assessment ensures that investments in machinery for applications in waste management or infrastructure are both effective and sustainable.

What are the key market drivers leading to the rise in the adoption of Wheel Loaders Industry?

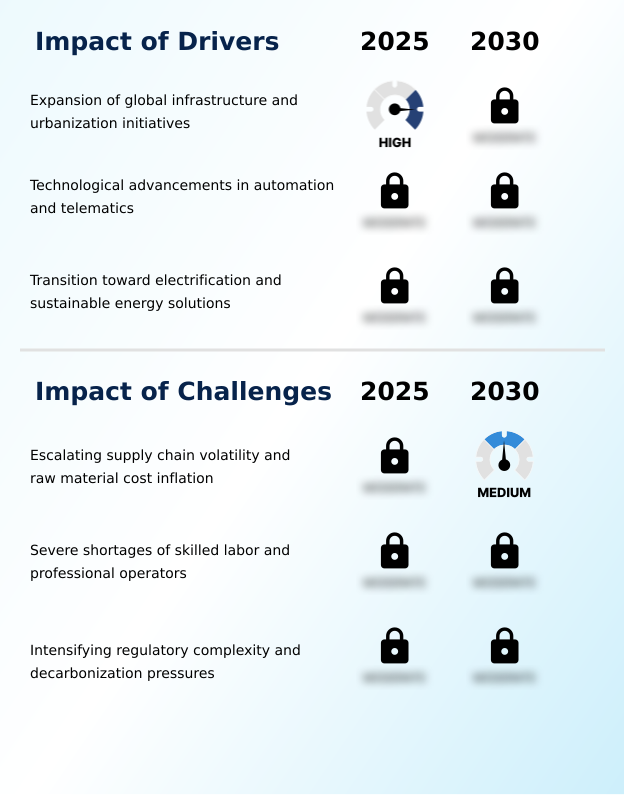
  • The expansion of global infrastructure and urbanization initiatives serves as the key driver for market growth.

  • Market growth is fundamentally driven by large-scale infrastructure development and the industry-wide adoption of digital technologies. The integration of advanced telematics systems and smart hydraulics allows for real-time monitoring of fuel consumption and mechanical health, directly supporting predictive maintenance.
  • This shift toward intelligent machinery, featuring automated bucket leveling, is especially prevalent where contractors seek to improve output. New engine technologies are delivering tangible benefits, with some models achieving a 5% improvement in fuel efficiency.
  • This push for efficiency is coupled with a focus on enhancing operator safety through features like intelligent speed control.
  • The demand for such advancements ensures that wheel loaders remain essential components of modern construction, especially as the industry grapples with significant skilled labor shortages.

What are the market trends shaping the Wheel Loaders Industry?

  • The integration of artificial intelligence and autonomous operating systems is a significant upcoming trend. This is reshaping the market by enhancing operational efficiency and precision.

  • The market is rapidly evolving with the integration of intelligent technologies and sustainable power sources. A dominant trend is the proliferation of hybrid powertrain architectures and remote-control operation, which are becoming critical for enhancing site safety and efficiency. Advanced sensors and industrial AI are enabling automated payload measurement and augmented reality overlays in operator cabins, transforming data-driven construction practices.
  • In high-altitude mining operations, regenerative braking systems have been shown to extend battery life by nearly 20%, significantly improving the viability of electric models. Concurrently, the adoption of on-board weighing systems and advanced diagnostic tools is streamlining material handling and maintenance, solidifying the shift towards a more connected and autonomous job site.

What challenges does the Wheel Loaders Industry face during its growth?

  • Escalating supply chain volatility and raw material cost inflation present a key challenge affecting the industry's growth.

  • The market faces significant headwinds from supply chain instability and evolving regulatory pressures. Structural issues have led to logistical bottlenecks, with shipping disruptions contributing to a 30% surge in freight costs for critical components, complicating regionalized sourcing strategies. This volatility directly impacts production cycles for machinery reliant on high-grade steel and hydraulic components.
  • Furthermore, the industry is navigating intensifying decarbonization pressures, which demand substantial investment in new technologies while managing the complexities of a multi-tiered regulatory landscape. The transition toward electrification also introduces challenges in scaling production of zero-emission portfolios, particularly concerning the volatile pricing of essential raw materials. These factors collectively test manufacturers' ability to maintain profitability while advancing technological innovation.

Exclusive Technavio Analysis on Customer Landscape

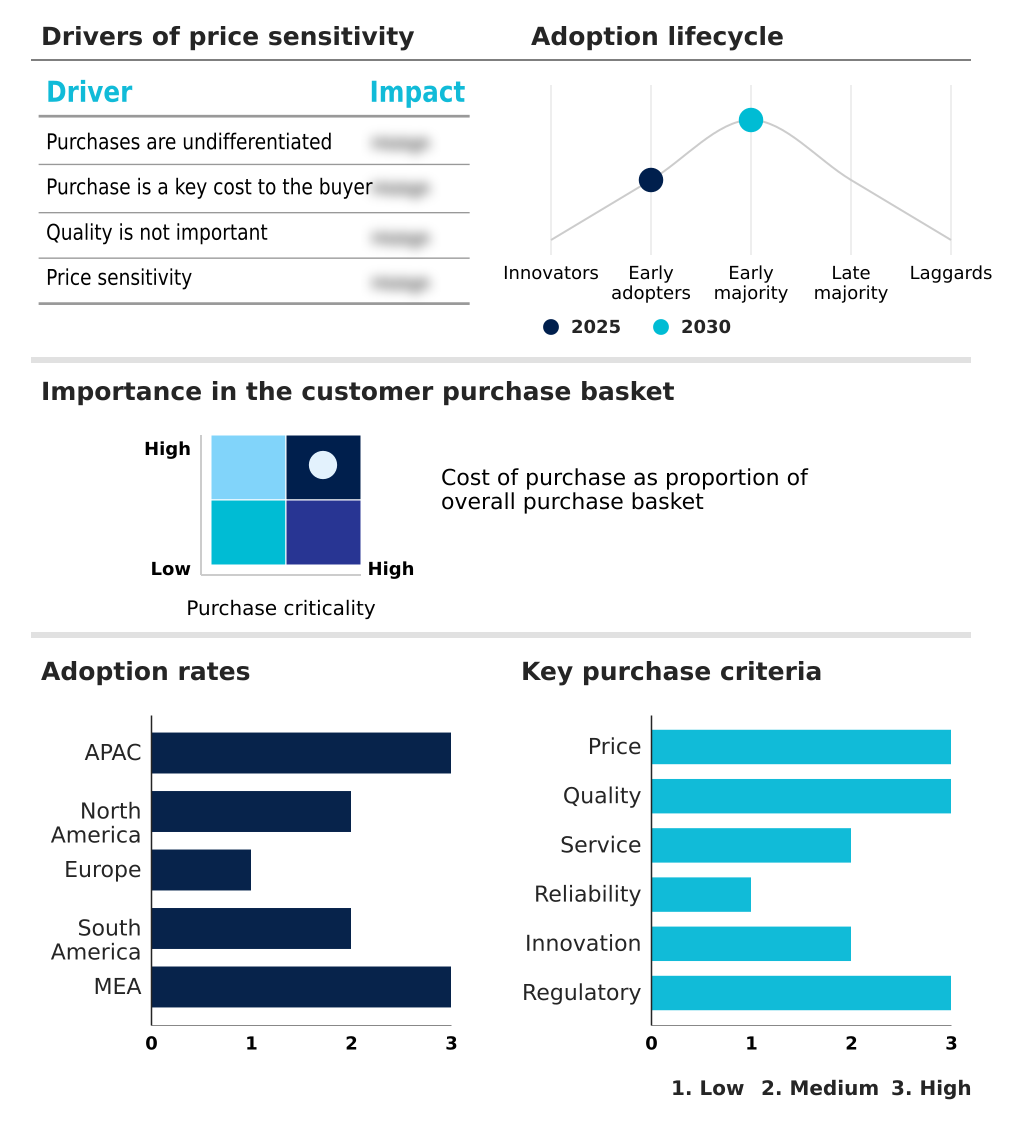
The wheel loaders market forecasting report includes the adoption lifecycle of the market, covering from the innovator’s stage to the laggard’s stage. It focuses on adoption rates in different regions based on penetration. Furthermore, the wheel loaders market report also includes key purchase criteria and drivers of price sensitivity to help companies evaluate and develop their market growth analysis strategies.

Customer Landscape of Wheel Loaders Industry

Competitive Landscape

Companies are implementing various strategies, such as strategic alliances, wheel loaders market forecast, partnerships, mergers and acquisitions, geographical expansion, and product/service launches, to enhance their presence in the industry.

CASE Construction - A focused portfolio of wheel loaders serves key applications in construction, mining, and energy, with models engineered for diverse operational demands.

The industry research and growth report includes detailed analyses of the competitive landscape of the market and information about key companies, including:

  • CASE Construction
  • Caterpillar Inc.
  • CNH Industrial N.V.
  • Deere and Co.
  • Doosan Corp.
  • HD Hyundai Construction
  • Hitachi Construction Machinery
  • J C Bamford Excavators Ltd.
  • Komatsu Ltd.
  • Kubota Corp.
  • Liebherr International AG
  • Liugong Machinery Co. Ltd.
  • Manitou BF SA
  • Sany Heavy Industry Co. Ltd.
  • SDLG Construction Machinery
  • Terex Corp.
  • Volvo Construction Equipment
  • Wacker Neuson SE
  • Weichei Lovol Heavy Industry
  • Xuzhou Construction Machinery

Qualitative and quantitative analysis of companies has been conducted to help clients understand the wider business environment as well as the strengths and weaknesses of key industry players. Data is qualitatively analyzed to categorize companies as pure play, category-focused, industry-focused, and diversified; it is quantitatively analyzed to categorize companies as dominant, leading, strong, tentative, and weak.

Recent Development and News in Wheel loaders market

  • In October, 2024, Volvo Construction Equipment announced the launch of its L120 Electric wheel loader in the Middle East, confirming its operational reliability in extreme heat conditions following rigorous field testing in the UAE.
  • In January, 2025, Caterpillar Inc. showcased its Cat 972 Wheel Loader at CES 2025, featuring an Extended Range Electrified Machine hybrid retrofit demonstrator, highlighting a new approach to electrification without requiring DC fast-charging infrastructure.
  • In February, 2025, Liebherr-Werk Bischofshofen GmbH announced it would unveil its Autonomous Operations system for driverless wheel loader operation and an L 566 H hydrogen-engine large wheel loader prototype at Bauma 2025.
  • In April, 2025, Volvo Construction Equipment announced the introduction of its new generation of wheel loaders, launching five models from the L150 to the L260, engineered to enhance productivity, operator comfort, and safety.

Dive into Technavio’s robust research methodology, blending expert interviews, extensive data synthesis, and validated models for unparalleled Wheel Loaders Market insights. See full methodology.

Market Scope
Page number 297
Base year 2025
Historic period 2020-2024
Forecast period 2026-2030
Growth momentum & CAGR Accelerate at a CAGR of 10%
Market growth 2026-2030 USD 31457.4 million
Market structure Fragmented
YoY growth 2025-2026(%) 9.4%
Key countries China, India, Japan, South Korea, Indonesia, Australia, US, Canada, Mexico, Germany, UK, France, Italy, Spain, Russia, Brazil, Argentina, Chile, Saudi Arabia, UAE, South Africa, Turkey and Egypt
Competitive landscape Leading Companies, Market Positioning of Companies, Competitive Strategies, and Industry Risks

Request Free Sample

Research Analyst Overview

  • The wheel loaders market is pivoting toward a new operational paradigm defined by technological sophistication and sustainability mandates. Boardroom-level strategy is now centered on balancing investments in next-generation platforms, such as those utilizing lithium-ion battery technology or hydrogen fuel cells, against the optimization of existing diesel fleets through advanced exhaust after-treatment systems.
  • The integration of autonomous operating systems, predictive maintenance protocols, and digital fleet management is no longer a niche but a core competitive differentiator. From heavy-duty quarrying operations and mining operations to agricultural logistics and site preparation machinery, the demand is for intelligent, connected equipment. High-capacity charging stations, 360-degree camera systems, and rear object identification are becoming standard safety requirements.
  • The latest generation of load-sensing hydraulics has demonstrated the ability to reduce cycle times by over 10% in material handling applications. This evolution impacts every category, including compact wheel loaders, medium wheel loaders, and large wheel loaders, all while being governed by the core principles of high breakout force and robust articulated steering mechanisms.
  • Innovations in joystick steering, high-flow hydraulic systems, and specialized cooling systems are further refining performance for heavy-duty filtration and cold-weather performance scenarios.

What are the Key Data Covered in this Wheel Loaders Market Research and Growth Report?

  • What is the expected growth of the Wheel Loaders Market between 2026 and 2030?

    • USD 31.46 billion, at a CAGR of 10%

  • What segmentation does the market report cover?

    • The report is segmented by End-user (Construction, and Agriculture), Power Output (More than 80 HP, 40 to 80 HP, and Less than 40 HP), Product Type (Medium, Large, and Compact) and Geography (APAC, North America, Europe, South America, Middle East and Africa)

  • Which regions are analyzed in the report?

    • APAC, North America, Europe, South America and Middle East and Africa

  • What are the key growth drivers and market challenges?

    • Expansion of global infrastructure and urbanization initiatives, Escalating supply chain volatility and raw material cost inflation

  • Who are the major players in the Wheel Loaders Market?

    • CASE Construction, Caterpillar Inc., CNH Industrial N.V., Deere and Co., Doosan Corp., HD Hyundai Construction, Hitachi Construction Machinery, J C Bamford Excavators Ltd., Komatsu Ltd., Kubota Corp., Liebherr International AG, Liugong Machinery Co. Ltd., Manitou BF SA, Sany Heavy Industry Co. Ltd., SDLG Construction Machinery, Terex Corp., Volvo Construction Equipment, Wacker Neuson SE, Weichei Lovol Heavy Industry and Xuzhou Construction Machinery

Market Research Insights

  • Market dynamics are shaped by a strategic push toward operational sustainability and data-driven construction. The adoption of operator assist technologies is accelerating, with regenerative braking systems in some hybrid models extending battery life by nearly 20% in high-altitude mining operations. This enhances the value proposition beyond initial procurement, directly impacting the total cost of ownership.
  • However, significant challenges persist; shipping disruptions have contributed to a 30% surge in freight costs for some components, complicating regionalized sourcing strategies.
  • Furthermore, a critical shortage of skilled labor, with an estimated need for 349,000 new workers in the US construction sector alone, underscores the urgency for firms to invest in technologies that improve productivity and align with corporate social responsibility goals.

We can help! Our analysts can customize this wheel loaders market research report to meet your requirements.

Get in touch

1. Executive Summary

1.1 Market overview

Executive Summary - Chart on Market Overview
Executive Summary - Data Table on Market Overview
Executive Summary - Chart on Global Market Characteristics
Executive Summary - Chart on Market by Geography
Executive Summary - Chart on Market Segmentation by End-user
Executive Summary - Chart on Market Segmentation by Power Output
Executive Summary - Chart on Market Segmentation by Product Type
Executive Summary - Chart on Incremental Growth
Executive Summary - Data Table on Incremental Growth
Executive Summary - Chart on Company Market Positioning

2. Technavio Analysis

2.1 Analysis of price sensitivity, lifecycle, customer purchase basket, adoption rates, and purchase criteria

2.2 Criticality of inputs and Factors of differentiation

Chart on Overview on criticality of inputs and factors of differentiation

2.3 Factors of disruption

Chart on Overview on factors of disruption

2.4 Impact of drivers and challenges

Chart on Impact of drivers and challenges in 2025 and 2030

3. Market Landscape

3.1 Market ecosystem

Chart on Parent Market
Data Table on - Parent Market

3.2 Market characteristics

Chart on Market characteristics analysis

3.3 Value chain analysis

Chart on Value chain analysis

4. Market Sizing

4.1 Market definition

Data Table on Offerings of companies included in the market definition

4.2 Market segment analysis

Market segments

4.3 Market size 2025

4.4 Market outlook: Forecast for 2025-2030

Chart on Global - Market size and forecast 2025-2030 ($ million)
Data Table on Global - Market size and forecast 2025-2030 ($ million)
Chart on Global Market: Year-over-year growth 2025-2030 (%)
Data Table on Global Market: Year-over-year growth 2025-2030 (%)

5. Historic Market Size

5.1 Global Wheel Loaders Market 2020 - 2024

Historic Market Size - Data Table on Global Wheel Loaders Market 2020 - 2024 ($ million)

5.2 End-user segment analysis 2020 - 2024

Historic Market Size - End-user Segment 2020 - 2024 ($ million)

5.3 Power Output segment analysis 2020 - 2024

Historic Market Size - Power Output Segment 2020 - 2024 ($ million)

5.4 Product Type segment analysis 2020 - 2024

Historic Market Size - Product Type Segment 2020 - 2024 ($ million)

5.5 Geography segment analysis 2020 - 2024

Historic Market Size - Geography Segment 2020 - 2024 ($ million)

5.6 Country segment analysis 2020 - 2024

Historic Market Size - Country Segment 2020 - 2024 ($ million)

6. Qualitative Analysis

6.1 Impact of AI on global wheel loaders market

6.2 Impact of geopolitical conflict on global wheel loaders market

7. Five Forces Analysis

7.1 Five forces summary

Five forces analysis - Comparison between 2025 and 2030

7.2 Bargaining power of buyers

Bargaining power of buyers - Impact of key factors 2025 and 2030

7.3 Bargaining power of suppliers

Bargaining power of suppliers - Impact of key factors in 2025 and 2030

7.4 Threat of new entrants

Threat of new entrants - Impact of key factors in 2025 and 2030

7.5 Threat of substitutes

Threat of substitutes - Impact of key factors in 2025 and 2030

7.6 Threat of rivalry

Threat of rivalry - Impact of key factors in 2025 and 2030

7.7 Market condition

Chart on Market condition - Five forces 2025 and 2030

8. Market Segmentation by End-user

8.1 Market segments

Chart on End-user - Market share 2025-2030 (%)
Data Table on End-user - Market share 2025-2030 (%)

8.2 Comparison by End-user

Chart on Comparison by End-user
Data Table on Comparison by End-user

8.3 Construction - Market size and forecast 2025-2030

Chart on Construction - Market size and forecast 2025-2030 ($ million)
Data Table on Construction - Market size and forecast 2025-2030 ($ million)
Chart on Construction - Year-over-year growth 2025-2030 (%)
Data Table on Construction - Year-over-year growth 2025-2030 (%)

8.4 Agriculture - Market size and forecast 2025-2030

Chart on Agriculture - Market size and forecast 2025-2030 ($ million)
Data Table on Agriculture - Market size and forecast 2025-2030 ($ million)
Chart on Agriculture - Year-over-year growth 2025-2030 (%)
Data Table on Agriculture - Year-over-year growth 2025-2030 (%)

8.5 Market opportunity by End-user

Market opportunity by End-user ($ million)
Data Table on Market opportunity by End-user ($ million)

9. Market Segmentation by Power Output

9.1 Market segments

Chart on Power Output - Market share 2025-2030 (%)
Data Table on Power Output - Market share 2025-2030 (%)

9.2 Comparison by Power Output

Chart on Comparison by Power Output
Data Table on Comparison by Power Output

9.3 More than 80 HP - Market size and forecast 2025-2030

Chart on More than 80 HP - Market size and forecast 2025-2030 ($ million)
Data Table on More than 80 HP - Market size and forecast 2025-2030 ($ million)
Chart on More than 80 HP - Year-over-year growth 2025-2030 (%)
Data Table on More than 80 HP - Year-over-year growth 2025-2030 (%)

9.4 40 to 80 HP - Market size and forecast 2025-2030

Chart on 40 to 80 HP - Market size and forecast 2025-2030 ($ million)
Data Table on 40 to 80 HP - Market size and forecast 2025-2030 ($ million)
Chart on 40 to 80 HP - Year-over-year growth 2025-2030 (%)
Data Table on 40 to 80 HP - Year-over-year growth 2025-2030 (%)

9.5 Less than 40 HP - Market size and forecast 2025-2030

Chart on Less than 40 HP - Market size and forecast 2025-2030 ($ million)
Data Table on Less than 40 HP - Market size and forecast 2025-2030 ($ million)
Chart on Less than 40 HP - Year-over-year growth 2025-2030 (%)
Data Table on Less than 40 HP - Year-over-year growth 2025-2030 (%)

9.6 Market opportunity by Power Output

Market opportunity by Power Output ($ million)
Data Table on Market opportunity by Power Output ($ million)

10. Market Segmentation by Product Type

10.1 Market segments

Chart on Product Type - Market share 2025-2030 (%)
Data Table on Product Type - Market share 2025-2030 (%)

10.2 Comparison by Product Type

Chart on Comparison by Product Type
Data Table on Comparison by Product Type

10.3 Medium - Market size and forecast 2025-2030

Chart on Medium - Market size and forecast 2025-2030 ($ million)
Data Table on Medium - Market size and forecast 2025-2030 ($ million)
Chart on Medium - Year-over-year growth 2025-2030 (%)
Data Table on Medium - Year-over-year growth 2025-2030 (%)

10.4 Large - Market size and forecast 2025-2030

Chart on Large - Market size and forecast 2025-2030 ($ million)
Data Table on Large - Market size and forecast 2025-2030 ($ million)
Chart on Large - Year-over-year growth 2025-2030 (%)
Data Table on Large - Year-over-year growth 2025-2030 (%)

10.5 Compact - Market size and forecast 2025-2030

Chart on Compact - Market size and forecast 2025-2030 ($ million)
Data Table on Compact - Market size and forecast 2025-2030 ($ million)
Chart on Compact - Year-over-year growth 2025-2030 (%)
Data Table on Compact - Year-over-year growth 2025-2030 (%)

10.6 Market opportunity by Product Type

Market opportunity by Product Type ($ million)
Data Table on Market opportunity by Product Type ($ million)

11. Customer Landscape

11.1 Customer landscape overview

Analysis of price sensitivity, lifecycle, customer purchase basket, adoption rates, and purchase criteria

12. Geographic Landscape

12.1 Geographic segmentation

Chart on Market share by geography 2025-2030 (%)
Data Table on Market share by geography 2025-2030 (%)

12.2 Geographic comparison

Chart on Geographic comparison
Data Table on Geographic comparison

12.3 APAC - Market size and forecast 2025-2030

Chart on APAC - Market size and forecast 2025-2030 ($ million)
Data Table on APAC - Market size and forecast 2025-2030 ($ million)
Chart on APAC - Year-over-year growth 2025-2030 (%)
Data Table on APAC - Year-over-year growth 2025-2030 (%)
Chart on Regional Comparison - APAC
Data Table on Regional Comparison - APAC

12.3.1 China - Market size and forecast 2025-2030

Chart on China - Market size and forecast 2025-2030 ($ million)
Data Table on China - Market size and forecast 2025-2030 ($ million)
Chart on China - Year-over-year growth 2025-2030 (%)
Data Table on China - Year-over-year growth 2025-2030 (%)

12.3.2 India - Market size and forecast 2025-2030

Chart on India - Market size and forecast 2025-2030 ($ million)
Data Table on India - Market size and forecast 2025-2030 ($ million)
Chart on India - Year-over-year growth 2025-2030 (%)
Data Table on India - Year-over-year growth 2025-2030 (%)

12.3.3 Japan - Market size and forecast 2025-2030

Chart on Japan - Market size and forecast 2025-2030 ($ million)
Data Table on Japan - Market size and forecast 2025-2030 ($ million)
Chart on Japan - Year-over-year growth 2025-2030 (%)
Data Table on Japan - Year-over-year growth 2025-2030 (%)

12.3.4 South Korea - Market size and forecast 2025-2030

Chart on South Korea - Market size and forecast 2025-2030 ($ million)
Data Table on South Korea - Market size and forecast 2025-2030 ($ million)
Chart on South Korea - Year-over-year growth 2025-2030 (%)
Data Table on South Korea - Year-over-year growth 2025-2030 (%)

12.3.5 Indonesia - Market size and forecast 2025-2030

Chart on Indonesia - Market size and forecast 2025-2030 ($ million)
Data Table on Indonesia - Market size and forecast 2025-2030 ($ million)
Chart on Indonesia - Year-over-year growth 2025-2030 (%)
Data Table on Indonesia - Year-over-year growth 2025-2030 (%)

12.3.6 Australia - Market size and forecast 2025-2030

Chart on Australia - Market size and forecast 2025-2030 ($ million)
Data Table on Australia - Market size and forecast 2025-2030 ($ million)
Chart on Australia - Year-over-year growth 2025-2030 (%)
Data Table on Australia - Year-over-year growth 2025-2030 (%)

12.4 North America - Market size and forecast 2025-2030

Chart on North America - Market size and forecast 2025-2030 ($ million)
Data Table on North America - Market size and forecast 2025-2030 ($ million)
Chart on North America - Year-over-year growth 2025-2030 (%)
Data Table on North America - Year-over-year growth 2025-2030 (%)
Chart on Regional Comparison - North America
Data Table on Regional Comparison - North America

12.4.1 US - Market size and forecast 2025-2030

Chart on US - Market size and forecast 2025-2030 ($ million)
Data Table on US - Market size and forecast 2025-2030 ($ million)
Chart on US - Year-over-year growth 2025-2030 (%)
Data Table on US - Year-over-year growth 2025-2030 (%)

12.4.2 Canada - Market size and forecast 2025-2030

Chart on Canada - Market size and forecast 2025-2030 ($ million)
Data Table on Canada - Market size and forecast 2025-2030 ($ million)
Chart on Canada - Year-over-year growth 2025-2030 (%)
Data Table on Canada - Year-over-year growth 2025-2030 (%)

12.4.3 Mexico - Market size and forecast 2025-2030

Chart on Mexico - Market size and forecast 2025-2030 ($ million)
Data Table on Mexico - Market size and forecast 2025-2030 ($ million)
Chart on Mexico - Year-over-year growth 2025-2030 (%)
Data Table on Mexico - Year-over-year growth 2025-2030 (%)

12.5 Europe - Market size and forecast 2025-2030

Chart on Europe - Market size and forecast 2025-2030 ($ million)
Data Table on Europe - Market size and forecast 2025-2030 ($ million)
Chart on Europe - Year-over-year growth 2025-2030 (%)
Data Table on Europe - Year-over-year growth 2025-2030 (%)
Chart on Regional Comparison - Europe
Data Table on Regional Comparison - Europe

12.5.1 Germany - Market size and forecast 2025-2030

Chart on Germany - Market size and forecast 2025-2030 ($ million)
Data Table on Germany - Market size and forecast 2025-2030 ($ million)
Chart on Germany - Year-over-year growth 2025-2030 (%)
Data Table on Germany - Year-over-year growth 2025-2030 (%)

12.5.2 UK - Market size and forecast 2025-2030

Chart on UK - Market size and forecast 2025-2030 ($ million)
Data Table on UK - Market size and forecast 2025-2030 ($ million)
Chart on UK - Year-over-year growth 2025-2030 (%)
Data Table on UK - Year-over-year growth 2025-2030 (%)

12.5.3 France - Market size and forecast 2025-2030

Chart on France - Market size and forecast 2025-2030 ($ million)
Data Table on France - Market size and forecast 2025-2030 ($ million)
Chart on France - Year-over-year growth 2025-2030 (%)
Data Table on France - Year-over-year growth 2025-2030 (%)

12.5.4 Italy - Market size and forecast 2025-2030

Chart on Italy - Market size and forecast 2025-2030 ($ million)
Data Table on Italy - Market size and forecast 2025-2030 ($ million)
Chart on Italy - Year-over-year growth 2025-2030 (%)
Data Table on Italy - Year-over-year growth 2025-2030 (%)

12.5.5 Spain - Market size and forecast 2025-2030

Chart on Spain - Market size and forecast 2025-2030 ($ million)
Data Table on Spain - Market size and forecast 2025-2030 ($ million)
Chart on Spain - Year-over-year growth 2025-2030 (%)
Data Table on Spain - Year-over-year growth 2025-2030 (%)

12.5.6 Russia - Market size and forecast 2025-2030

Chart on Russia - Market size and forecast 2025-2030 ($ million)
Data Table on Russia - Market size and forecast 2025-2030 ($ million)
Chart on Russia - Year-over-year growth 2025-2030 (%)
Data Table on Russia - Year-over-year growth 2025-2030 (%)

12.6 South America - Market size and forecast 2025-2030

Chart on South America - Market size and forecast 2025-2030 ($ million)
Data Table on South America - Market size and forecast 2025-2030 ($ million)
Chart on South America - Year-over-year growth 2025-2030 (%)
Data Table on South America - Year-over-year growth 2025-2030 (%)
Chart on Regional Comparison - South America
Data Table on Regional Comparison - South America

12.6.1 Brazil - Market size and forecast 2025-2030

Chart on Brazil - Market size and forecast 2025-2030 ($ million)
Data Table on Brazil - Market size and forecast 2025-2030 ($ million)
Chart on Brazil - Year-over-year growth 2025-2030 (%)
Data Table on Brazil - Year-over-year growth 2025-2030 (%)

12.6.2 Argentina - Market size and forecast 2025-2030

Chart on Argentina - Market size and forecast 2025-2030 ($ million)
Data Table on Argentina - Market size and forecast 2025-2030 ($ million)
Chart on Argentina - Year-over-year growth 2025-2030 (%)
Data Table on Argentina - Year-over-year growth 2025-2030 (%)

12.6.3 Chile - Market size and forecast 2025-2030

Chart on Chile - Market size and forecast 2025-2030 ($ million)
Data Table on Chile - Market size and forecast 2025-2030 ($ million)
Chart on Chile - Year-over-year growth 2025-2030 (%)
Data Table on Chile - Year-over-year growth 2025-2030 (%)

12.7 Middle East and Africa - Market size and forecast 2025-2030

Chart on Middle East and Africa - Market size and forecast 2025-2030 ($ million)
Data Table on Middle East and Africa - Market size and forecast 2025-2030 ($ million)
Chart on Middle East and Africa - Year-over-year growth 2025-2030 (%)
Data Table on Middle East and Africa - Year-over-year growth 2025-2030 (%)
Chart on Regional Comparison - Middle East and Africa
Data Table on Regional Comparison - Middle East and Africa

12.7.1 Saudi Arabia - Market size and forecast 2025-2030

Chart on Saudi Arabia - Market size and forecast 2025-2030 ($ million)
Data Table on Saudi Arabia - Market size and forecast 2025-2030 ($ million)
Chart on Saudi Arabia - Year-over-year growth 2025-2030 (%)
Data Table on Saudi Arabia - Year-over-year growth 2025-2030 (%)

12.7.2 UAE - Market size and forecast 2025-2030

Chart on UAE - Market size and forecast 2025-2030 ($ million)
Data Table on UAE - Market size and forecast 2025-2030 ($ million)
Chart on UAE - Year-over-year growth 2025-2030 (%)
Data Table on UAE - Year-over-year growth 2025-2030 (%)

12.7.3 South Africa - Market size and forecast 2025-2030

Chart on South Africa - Market size and forecast 2025-2030 ($ million)
Data Table on South Africa - Market size and forecast 2025-2030 ($ million)
Chart on South Africa - Year-over-year growth 2025-2030 (%)
Data Table on South Africa - Year-over-year growth 2025-2030 (%)

12.7.4 Turkey - Market size and forecast 2025-2030

Chart on Turkey - Market size and forecast 2025-2030 ($ million)
Data Table on Turkey - Market size and forecast 2025-2030 ($ million)
Chart on Turkey - Year-over-year growth 2025-2030 (%)
Data Table on Turkey - Year-over-year growth 2025-2030 (%)

12.7.5 Egypt - Market size and forecast 2025-2030

Chart on Egypt - Market size and forecast 2025-2030 ($ million)
Data Table on Egypt - Market size and forecast 2025-2030 ($ million)
Chart on Egypt - Year-over-year growth 2025-2030 (%)
Data Table on Egypt - Year-over-year growth 2025-2030 (%)

12.8 Market opportunity by geography

Market opportunity by geography ($ million)
Data Tables on Market opportunity by geography ($ million)

13. Drivers, Challenges, and Opportunity

13.1 Market drivers

Expansion of global infrastructure and urbanization initiatives
Technological advancements in automation and telematics
Transition toward electrification and sustainable energy solutions

13.2 Market challenges

Escalating supply chain volatility and raw material cost inflation
Severe shortages of skilled labor and professional operators
Intensifying regulatory complexity and decarbonization pressures

13.3 Impact of drivers and challenges

Impact of drivers and challenges in 2025 and 2030

13.4 Market opportunities

Integration of AI and autonomous operation systems
Proliferation of electric and hybrid powertrain architectures
Expansion of telematics and digital fleet management solutions

14. Competitive Landscape

14.1 Overview

14.2

Overview on criticality of inputs and factors of differentiation

14.3 Landscape disruption

Overview on factors of disruption

14.4 Industry risks

Impact of key risks on business

15. Competitive Analysis

15.1 Companies profiled

Companies covered

15.2 Company ranking index

15.3 Market positioning of companies

Matrix on companies position and classification

15.4 Caterpillar Inc.

Caterpillar Inc. - Overview
Caterpillar Inc. - Business segments
Caterpillar Inc. - Key news
Caterpillar Inc. - Key offerings
Caterpillar Inc. - Segment focus
SWOT

15.5 CNH Industrial N.V.

CNH Industrial N.V. - Overview
CNH Industrial N.V. - Business segments
CNH Industrial N.V. - Key offerings
CNH Industrial N.V. - Segment focus
SWOT

15.6 Deere and Co.

Deere and Co. - Overview
Deere and Co. - Business segments
Deere and Co. - Key news
Deere and Co. - Key offerings
Deere and Co. - Segment focus
SWOT

15.7 Doosan Corp.

Doosan Corp. - Overview
Doosan Corp. - Business segments
Doosan Corp. - Key offerings
Doosan Corp. - Segment focus
SWOT

15.8 Hitachi Construction Machinery

Hitachi Construction Machinery - Overview
Hitachi Construction Machinery - Product / Service
Hitachi Construction Machinery - Key offerings
SWOT

15.9 J C Bamford Excavators Ltd.

J C Bamford Excavators Ltd. - Overview
J C Bamford Excavators Ltd. - Product / Service
J C Bamford Excavators Ltd. - Key offerings
SWOT

15.10 Komatsu Ltd.

Komatsu Ltd. - Overview
Komatsu Ltd. - Business segments
Komatsu Ltd. - Key offerings
Komatsu Ltd. - Segment focus
SWOT

15.11 Kubota Corp.

Kubota Corp. - Overview
Kubota Corp. - Business segments
Kubota Corp. - Key offerings
Kubota Corp. - Segment focus
SWOT

15.12 Liebherr International AG

Liebherr International AG - Overview
Liebherr International AG - Product / Service
Liebherr International AG - Key offerings
SWOT

15.13 Liugong Machinery Co. Ltd.

Liugong Machinery Co. Ltd. - Overview
Liugong Machinery Co. Ltd. - Business segments
Liugong Machinery Co. Ltd. - Key offerings
Liugong Machinery Co. Ltd. - Segment focus
SWOT

15.14 Sany Heavy Industry Co. Ltd.

Sany Heavy Industry Co. Ltd. - Overview
Sany Heavy Industry Co. Ltd. - Business segments
Sany Heavy Industry Co. Ltd. - Key offerings
Sany Heavy Industry Co. Ltd. - Segment focus
SWOT

15.15 Terex Corp.

Terex Corp. - Overview
Terex Corp. - Business segments
Terex Corp. - Key offerings
Terex Corp. - Segment focus
SWOT

15.16 Volvo Construction Equipment

Volvo Construction Equipment - Overview
Volvo Construction Equipment - Product / Service
Volvo Construction Equipment - Key offerings
SWOT

15.17 Weichei Lovol Heavy Industry

Weichei Lovol Heavy Industry - Overview
Weichei Lovol Heavy Industry - Product / Service
Weichei Lovol Heavy Industry - Key offerings
SWOT

15.18 Xuzhou Construction Machinery

Xuzhou Construction Machinery - Overview
Xuzhou Construction Machinery - Business segments
Xuzhou Construction Machinery - Key offerings
Xuzhou Construction Machinery - Segment focus
SWOT

16. Appendix

16.1 Scope of the report

Market definition
Objectives
Notes and caveats

16.2 Inclusions and exclusions checklist

Inclusions checklist
Exclusions checklist

16.3 Currency conversion rates for US$

16.4 Research methodology

16.5 Data procurement

Information sources

16.6 Data validation

16.7 Validation techniques employed for market sizing

16.8 Data synthesis

16.9 360 degree market analysis

16.10 List of abbreviations

Research Methodology

Technavio presents a detailed picture of the market by way of study, synthesis, and summation of data from multiple sources. The analysts have presented the various facets of the market with a particular focus on identifying the key industry influencers. The data thus presented is comprehensive, reliable, and the result of extensive research, both primary and secondary.

INFORMATION SOURCES

Primary sources

  • Manufacturers and suppliers
  • Channel partners
  • Industry experts
  • Strategic decision makers

Secondary sources

  • Industry journals and periodicals
  • Government data
  • Financial reports of key industry players
  • Historical data
  • Press releases

DATA ANALYSIS

Data Synthesis

  • Collation of data
  • Estimation of key figures
  • Analysis of derived insights

Data Validation

  • Triangulation with data models
  • Reference against proprietary databases
  • Corroboration with industry experts

REPORT WRITING

Qualitative

  • Market drivers
  • Market challenges
  • Market trends
  • Five forces analysis

Quantitative

  • Market size and forecast
  • Market segmentation
  • Geographical insights
  • Competitive landscape

Interested in this report?

Get your sample now to see our research methodology and insights!

Download Now

Frequently Asked Questions

Wheel Loaders market growth will increase by USD 31457.4 million during 2026-2030.

The Wheel Loaders market is expected to grow at a CAGR of 10% during 2026-2030.

Wheel Loaders market is segmented by End-user (Construction, Agriculture) Power output (More than 80 HP, 40 to 80 HP, Less than 40 HP) Product type (Medium, Large, Compact)

CASE Construction, Caterpillar Inc., CNH Industrial N.V., Deere and Co., Doosan Corp., HD Hyundai Construction, Hitachi Construction Machinery, J C Bamford Excavators Ltd., Komatsu Ltd., Kubota Corp., Liebherr International AG, Liugong Machinery Co. Ltd., Manitou BF SA, Sany Heavy Industry Co. Ltd., SDLG Construction Machinery, Terex Corp., Volvo Construction Equipment, Wacker Neuson SE, Weichei Lovol Heavy Industry, Xuzhou Construction Machinery are a few of the key vendors in the Wheel Loaders market.

APAC will register the highest growth rate of 34.9% among the other regions. Therefore, the Wheel Loaders market in APAC is expected to garner significant business opportunities for the vendors during the forecast period.

China, India, Japan, South Korea, Indonesia, Australia, US, Canada, Mexico, Germany, UK, France, Italy, Spain, Russia, Brazil, Argentina, Chile, Saudi Arabia, UAE, South Africa, Turkey, Egypt

  • Expansion of global infrastructure and urbanization initiatives is the driving factor this market.

The Wheel Loaders market vendors should focus on grabbing business opportunities from the End-user segment as it accounted for the largest market share in the base year.
RIA - Research AI Assistant
Ask RIA