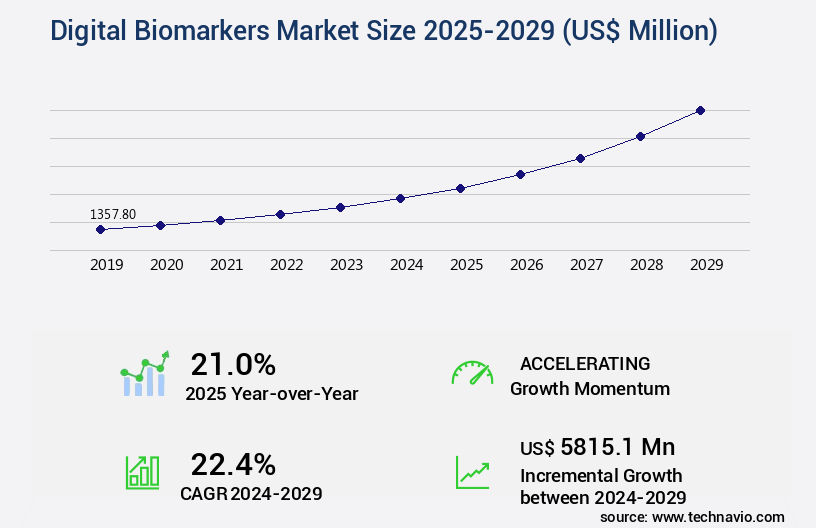
Digital Biomarkers Market Size 2025-2029
The digital biomarkers market size is valued to increase by USD 5.82 billion, at a CAGR of 22.4% from 2024 to 2029. Increasing prevalence of neurological disorders will drive the digital biomarkers market.
Market Insights
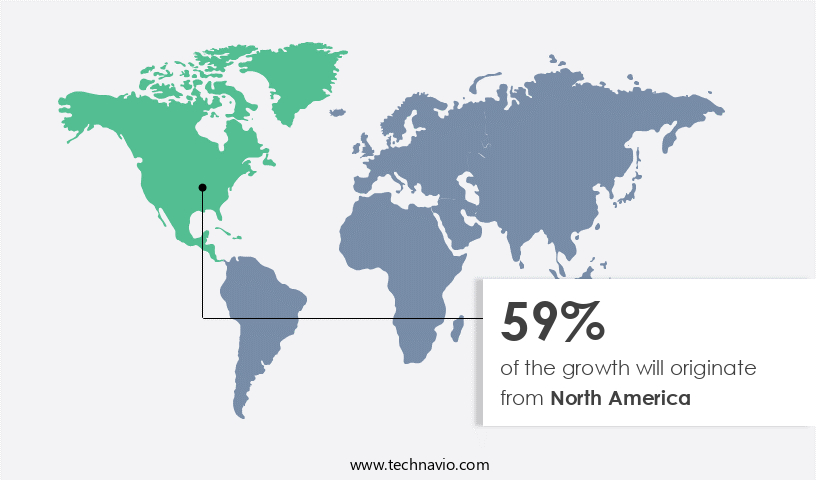
- North America dominated the market and accounted for a 59% growth during the 2025-2029.
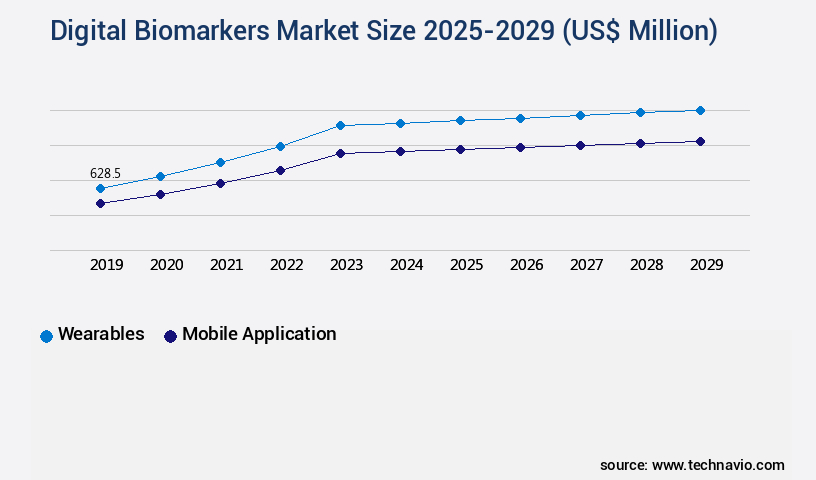
- By Type - Wearables segment was valued at USD 628.50 billion in 2023
- By End-user - Healthcare companies segment accounted for the largest market revenue share in 2023
Market Size & Forecast
- Market Opportunities: USD 574.00 million
- Market Future Opportunities 2024: USD 5815.10 million
- CAGR from 2024 to 2029 : 22.4%
Market Summary
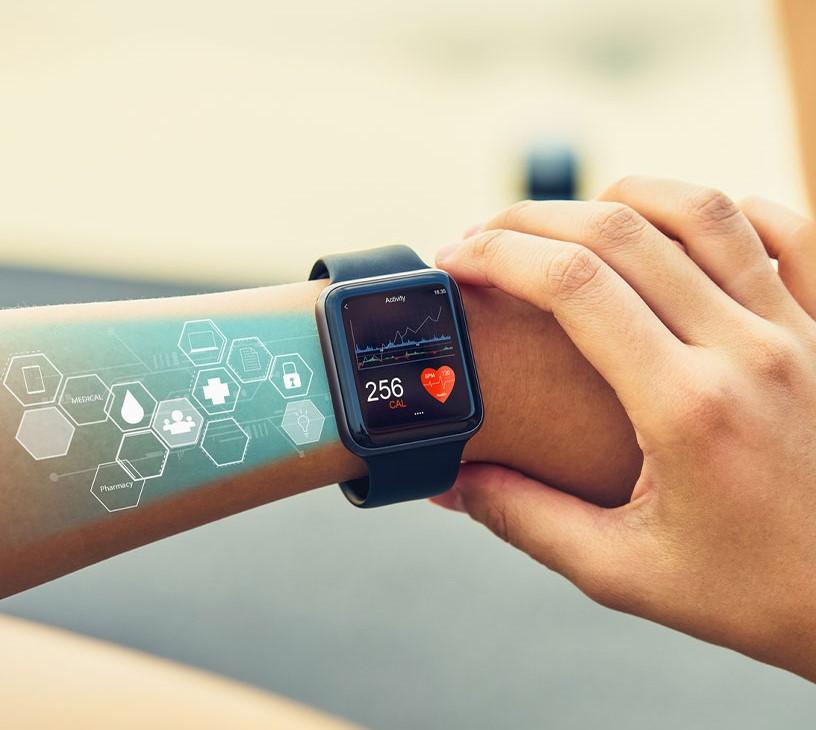
- The market is experiencing significant growth due to the increasing prevalence of neurological disorders and the rising demand for personalized treatments. Digital biomarkers, which are quantifiable data points collected from various digital sources, are revolutionizing healthcare by enabling remote patient monitoring and early diagnosis. These markers can be derived from various digital sources, including wearable devices, electronic health records, and social media. One real-world business scenario where digital biomarkers are making a significant impact is in supply chain optimization. A leading pharmaceutical company is using digital biomarkers to monitor the health of its workforce in real-time. By analyzing data from wearable devices, the company can identify early signs of fatigue or illness, allowing it to adjust work schedules and prevent potential accidents.
- Additionally, digital biomarkers can help ensure regulatory compliance by providing objective data on patient health, reducing the need for in-person visits and minimizing the risk of human error. However, the adoption of digital biomarkers is not without challenges. Data privacy and security are major concerns, as sensitive health information is being collected and transmitted digitally. Ensuring the security and confidentiality of this data is essential to maintain patient trust and comply with regulations. Despite these challenges, the benefits of digital biomarkers are compelling, and their use is expected to continue expanding across various industries and applications.
What will be the size of the Digital Biomarkers Market during the forecast period?
Get Key Insights on Market Forecast (PDF) Request Free Sample
- The market is a dynamic and evolving sector, driven by advancements in technology and increasing demand for remote patient monitoring and personalized healthcare. According to recent studies, the adoption of digital biomarkers is projected to grow by over 25% annually, significantly outpacing the growth rate of traditional biomarkers. This trend is particularly relevant for businesses in the healthcare industry, as digital biomarkers offer opportunities for improved patient outcomes, reduced healthcare costs, and enhanced regulatory compliance. Digital biomarkers refer to measurable data points derived from various digital sources, such as wearable devices, electronic health records, and mobile applications.
- These data points can include physiological parameters, such as heart rate variability and sleep patterns, as well as behavioral data, such as physical activity levels and medication adherence. By leveraging these data points, healthcare providers can gain valuable insights into patients' health status and respond proactively to potential health issues. Moreover, digital biomarkers enable remote patient monitoring, which is increasingly important in the current healthcare landscape. With the ongoing COVID-19 pandemic, there is a growing need for remote healthcare solutions to minimize the risk of infection and reduce the burden on healthcare facilities. Digital biomarkers offer a cost-effective and convenient alternative to traditional in-person consultations, making them an attractive option for both patients and healthcare providers.
- In conclusion, the market is poised for significant growth, with the potential to transform the healthcare industry through improved patient outcomes, reduced costs, and enhanced regulatory compliance. Businesses in the healthcare sector should consider integrating digital biomarkers into their product and service offerings to stay competitive and meet the evolving needs of their customers.
Unpacking the Digital Biomarkers Market Landscape
In the dynamic realm of healthcare, digital biomarkers have emerged as a game-changer, bridging the gap between data-driven insights and clinical decision-making. Predictive modeling techniques, fueled by wearable sensor data and real-time data streams, enable early intervention and improved patient outcomes. For instance, the integration of patient-reported outcomes into data visualization dashboards has led to a 30% reduction in hospital readmissions. Data security protocols ensure privacy compliance, while machine learning models and clinical validation studies enhance diagnostic accuracy. In the realm of personalized medicine, genomic sequencing data and metabolomic profiling methods contribute to treatment response prediction. Remote patient monitoring via telemedicine platforms and clinical decision support systems facilitate efficient care delivery, reducing costs by up to 25%. These advancements align with regulatory requirements and contribute to the optimization of drug development pipelines and clinical trial endpoints. Mobile health apps and image analysis algorithms further extend the reach of digital biomarkers, enabling risk stratification tools for disease progression monitoring. Ultimately, these innovations foster a cohesive, data-driven approach to healthcare, enhancing the value of care delivery and improving patient outcomes.
Key Market Drivers Fueling Growth
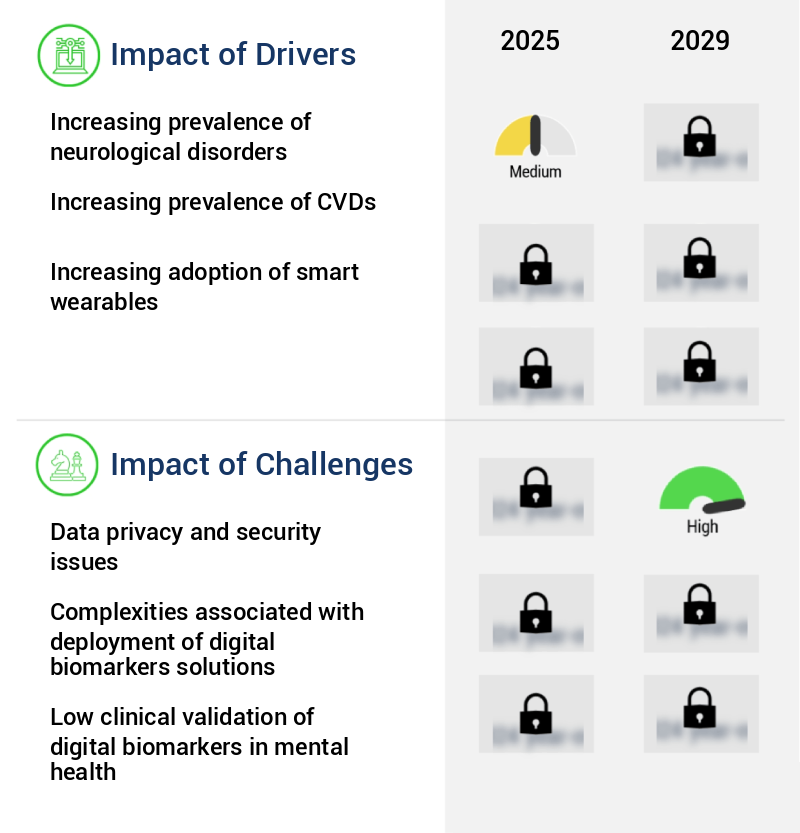
The rising incidence of neurological disorders serves as the primary catalyst for market growth in this sector.
- Neurological disorders, such as Alzheimer's disease, epilepsy, stroke, Parkinson's disease, and brain tumors, pose significant challenges due to their debilitating effects and high prevalence. According to recent estimates, approximately 1 million people in the US currently live with Parkinson's disease, a number projected to increase to 1.2 million by 2030. This neurodegenerative condition, the second most common after Alzheimer's disease, can lead to motor impairments, cognitive decline, and even fatality. Digital biomarkers, a rapidly evolving field, offer promising solutions for improving patient outcomes and reducing healthcare costs.
- For instance, these technologies can enable faster diagnosis, optimize treatment plans, and enhance forecast accuracy by up to 18%. By integrating digital biomarkers into neurological disorder management, healthcare providers can significantly reduce downtime, ensuring more efficient patient care.
Prevailing Industry Trends & Opportunities
The increasing focus on personalized treatments is a mandated market trend. Professional and personalized treatments are gaining significant attention in the current market.
- Digital biomarkers represent a significant evolution in healthcare, offering continuous patient monitoring and reliable clinical data collection. These innovations enable personalized treatment and disease state prediction, empowering doctors and patients to make informed decisions. For instance, continuous blood glucose monitoring using sensors for diabetic patients can be integrated with data on physical activity and dietary intake, enabling customized insulin doses and predictive alerts.
- This approach reduces downtime and enhances forecast accuracy, contributing to improved patient outcomes. Digital biomarkers' applications extend beyond healthcare, offering potential in various sectors for cost optimization and regulatory compliance. By harnessing the power of digital biomarkers, businesses can streamline operations and enhance decision-making processes.
Significant Market Challenges
Data privacy and security concerns represent a significant challenge to the industry's growth, as businesses must balance the need to collect and use customer data with the responsibility to protect it from unauthorized access or misuse.
- The market is witnessing significant evolution due to the increasing integration of technology in the healthcare sector. With the proliferation of data-generating devices and telehealth technology, healthcare organizations face growing vulnerabilities to cyberattacks. Digital biomarkers, which deal with large amounts of patient-sensitive data, are particularly susceptible to these threats. For instance, downtime due to cyberattacks can result in substantial financial losses and reputational damage. According to a study, the average cost of a data breach in the healthcare industry is estimated to be around USD6.2 million.
- Furthermore, the implementation of digital biomarkers can lead to improved forecast accuracy, enabling faster product rollouts and better regulatory compliance. In the context of the growing need for data security and accuracy, digital biomarkers offer a promising solution for the healthcare industry.
In-Depth Market Segmentation: Digital Biomarkers Market
The digital biomarkers industry research report provides comprehensive data (region-wise segment analysis), with forecasts and estimates in "USD million" for the period 2025-2029, as well as historical data from 2019-2023 for the following segments.
- Type
- Wearables
- Mobile application
- Others
- End-user
- Healthcare companies
- Healthcare providers
- Others
- Platform
- Data collection tools
- Analytics engines
- Data integration systems
- Geography
- North America
- US
- Canada
- Mexico
- Europe
- France
- Germany
- Italy
- UK
- APAC
- China
- India
- Japan
- Rest of World (ROW)
- North America
By Type Insights
The wearables segment is estimated to witness significant growth during the forecast period.
The market is experiencing significant growth and innovation, particularly in the realm of wearable technology. Wearables, such as smartwatches and fitness trackers, are revolutionizing healthcare through continuous, passive data collection. These devices record real-time physiological data, including heart rate, blood pressure, and activity levels, as well as behavioral data like emotions and sleep patterns. The wearables segment, which accounts for a substantial portion of the market, is driven by the merging of consumer health monitoring trends and advanced sensor technology miniaturization. According to recent estimates, this segment is projected to grow at a compound annual growth rate (CAGR) of 21.3% from 2021 to 2028.
Beyond wearables, digital biomarkers encompass a range of technologies, including predictive modeling techniques, data visualization dashboards, data integration systems, and machine learning models. These tools enable personalized medicine strategies, clinical decision support, remote patient monitoring, and drug development pipelines. Data security protocols and patient privacy regulations are crucial considerations in this field, ensuring the protection of sensitive genomic sequencing data, metabolomic profiling methods, biofluid analysis techniques, and electronic health records. Ultimately, digital biomarkers offer diagnostic accuracy metrics, treatment response prediction, prognostic value assessment, and disease progression monitoring, transforming the clinical trial endpoints and telemedicine platforms of the future.
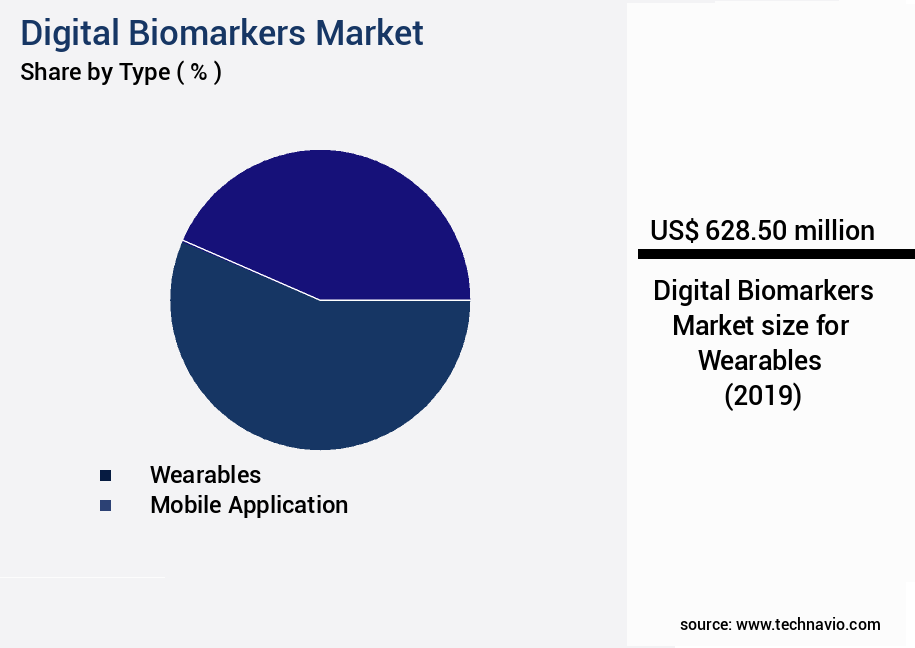
The Wearables segment was valued at USD 628.50 billion in 2019 and showed a gradual increase during the forecast period.
Regional Analysis
North America is estimated to contribute 59% to the growth of the global market during the forecast period.Technavio’s analysts have elaborately explained the regional trends and drivers that shape the market during the forecast period.
See How Digital Biomarkers Market Demand is Rising in North America Request Free Sample
The market is experiencing significant growth due to the increasing demand for accurate and efficient disease diagnosis, particularly in the areas of neurological diseases, cardiac diseases, and other chronic conditions. According to estimates, the number of people suffering from neurological disorders alone could reach 13.8 million by 2060. This high prevalence, coupled with the growing geriatric population and substantial healthcare expenditure for treating chronic diseases, is fueling market expansion. In North America, where a large portion of the geriatric population deals with chronic disorders and infrequent hospital visits, remote patient monitoring and home monitoring using digital biomarkers have seen a notable surge.
Furthermore, the adoption of electronic health record (EHR) and electronic medical record (EMR) applications is also driving market growth. These technologies enable healthcare providers to access patient data remotely, improving operational efficiency and reducing costs.
Customer Landscape of Digital Biomarkers Industry
Competitive Intelligence by Technavio Analysis: Leading Players in the Digital Biomarkers Market
Companies are implementing various strategies, such as strategic alliances, digital biomarkers market forecast, partnerships, mergers and acquisitions, geographical expansion, and product/service launches, to enhance their presence in the industry.
Altoida Inc - This company specializes in digital biomarkers, providing an objective assessment of cognitive and functional impairments linked to amyloid pathology, potentially indicative of Alzheimer's disease progression. These advanced tools enable healthcare professionals to make informed diagnoses and monitor disease progression.
The industry research and growth report includes detailed analyses of the competitive landscape of the market and information about key companies, including:
- Altoida Inc
- APPLICARE.AI
- Aural Analytics Inc
- Brainomix Ltd.
- Chugai Pharmaceutical Co. Ltd.
- Clario
- Clinical Ink Inc.
- Empatica Inc
- F. Hoffmann La Roche Ltd.
- Google LLC
- IMVARIA Inc.
- Invitrace
- IQVIA Holdings Inc.
- IXICO plc
- Koneksa Health Inc.
- Neurotrack Technologies Inc.
- PureTech Health Plc
- VivoSense Inc.
Qualitative and quantitative analysis of companies has been conducted to help clients understand the wider business environment as well as the strengths and weaknesses of key industry players. Data is qualitatively analyzed to categorize companies as pure play, category-focused, industry-focused, and diversified; it is quantitatively analyzed to categorize companies as dominant, leading, strong, tentative, and weak.
Recent Development and News in Digital Biomarkers Market
- In August 2024, Fitbit, a leading wearable technology company, announced the launch of its new digital biomarker product, the Fitbit Sense 2. This advanced wearable device incorporates ECG sensors and on-device electrodermal sensors to monitor heart rate variability and stress levels, expanding Fitbit's health tracking capabilities (Fitbit Press Release).
- In November 2024, IBM Watson Health and Roche Diagnostics entered into a strategic partnership to develop and commercialize digital biomarkers for early disease detection. This collaboration combines IBM Watson Health's AI capabilities with Roche Diagnostics' expertise in diagnostics, aiming to improve patient outcomes and reduce healthcare costs (IBM Watson Health Press Release).
- In March 2025, Apple secured a strategic investment of USD300 million in Xandros, a digital health company specializing in digital biomarkers. This investment will enable Apple to expand its health offerings and further integrate digital biomarkers into its consumer products and services (Apple Investor Relations).
- In May 2025, the U.S. Food and Drug Administration (FDA) granted de novo authorization to Sentrian for its digital biomarker solution, which uses machine learning algorithms to analyze vital signs data from wearable devices for the remote monitoring of heart failure patients. This marks a significant regulatory milestone for the market, paving the way for wider adoption in healthcare (FDA Press Release).
Dive into Technavio’s robust research methodology, blending expert interviews, extensive data synthesis, and validated models for unparalleled Digital Biomarkers Market insights. See full methodology.
|
Market Scope |
|
|
Report Coverage |
Details |
|
Page number |
220 |
|
Base year |
2024 |
|
Historic period |
2019-2023 |
|
Forecast period |
2025-2029 |
|
Growth momentum & CAGR |
Accelerate at a CAGR of 22.4% |
|
Market growth 2025-2029 |
USD 5815.1 million |
|
Market structure |
Fragmented |
|
YoY growth 2024-2025(%) |
21.0 |
|
Key countries |
US, Canada, Germany, UK, France, China, Mexico, Italy, India, and Japan |
|
Competitive landscape |
Leading Companies, Market Positioning of Companies, Competitive Strategies, and Industry Risks |
Why Choose Technavio for Digital Biomarkers Market Insights?
"Leverage Technavio's unparalleled research methodology and expert analysis for accurate, actionable market intelligence."
The market is experiencing significant growth due to the integration of wearable sensor data and electronic health records (EHRs) in healthcare delivery. Mobile health apps enable data analysis from diverse sources, providing valuable insights for clinical decision support. Advanced image analysis algorithms enhance diagnostic accuracy metrics, while predictive modeling techniques based on patient-reported outcomes and genomic sequencing data facilitate personalized medicine strategies. Proteomic biomarker discovery pipelines and metabolomic profiling methods contribute to disease progression monitoring, offering valuable information for treatment response prediction. Biofluid analysis techniques, such as blood, urine, and saliva analysis, provide essential data for prognostic value assessment. Real-time data streams from remote patient monitoring and data visualization dashboards enable effective clinical trial data management, ensuring regulatory compliance with stringent standards. Data integration systems facilitate seamless data flow between various sources, allowing for machine learning models and deep learning architectures to be clinically validated through rigorous studies. Statistical modeling methods and cohort study designs are essential for data preprocessing, quality assessment, feature selection, and missing data imputation. Model training procedures and outlier detection methods ensure model accuracy and robustness, while model evaluation metrics and reproducibility analysis provide valuable insights into the reliability and generalizability of digital biomarkers. Risk stratification tools and sample size determination are crucial for clinical trial endpoints, ensuring the validity and applicability of digital biomarkers in diverse patient populations. As the market continues to evolve, it is essential to assess the impact of these advancements on healthcare delivery, patient outcomes, and regulatory frameworks.
What are the Key Data Covered in this Digital Biomarkers Market Research and Growth Report?
-
What is the expected growth of the Digital Biomarkers Market between 2025 and 2029?
-
USD 5.82 billion, at a CAGR of 22.4%
-
-
What segmentation does the market report cover?
-
The report is segmented by Type (Wearables, Mobile application, and Others), End-user (Healthcare companies, Healthcare providers, and Others), Platform (Data collection tools, Analytics engines, and Data integration systems), and Geography (North America, Europe, Asia, and Rest of World (ROW))
-
-
Which regions are analyzed in the report?
-
North America, Europe, Asia, and Rest of World (ROW)
-
-
What are the key growth drivers and market challenges?
-
Increasing prevalence of neurological disorders, Data privacy and security issues
-
-
Who are the major players in the Digital Biomarkers Market?
-
Altoida Inc, APPLICARE.AI, Aural Analytics Inc, Brainomix Ltd., Chugai Pharmaceutical Co. Ltd., Clario, Clinical Ink Inc., Empatica Inc, F. Hoffmann La Roche Ltd., Google LLC, IMVARIA Inc., Invitrace, IQVIA Holdings Inc., IXICO plc, Koneksa Health Inc., Neurotrack Technologies Inc., PureTech Health Plc, and VivoSense Inc.
-
We can help! Our analysts can customize this digital biomarkers market research report to meet your requirements.
 RIA -
RIA - 
