
Digital Freight Brokerage Market Size 2026-2030
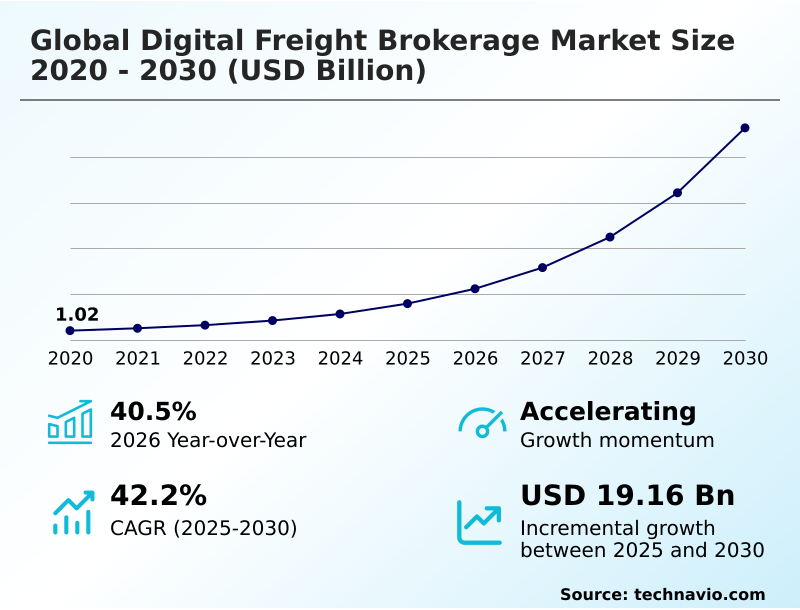
The digital freight brokerage market size is valued to increase by USD 19.16 billion, at a CAGR of 42.2% from 2025 to 2030. Increasing integration of AI and ML to automate core processes will drive the digital freight brokerage market.
Major Market Trends & Insights
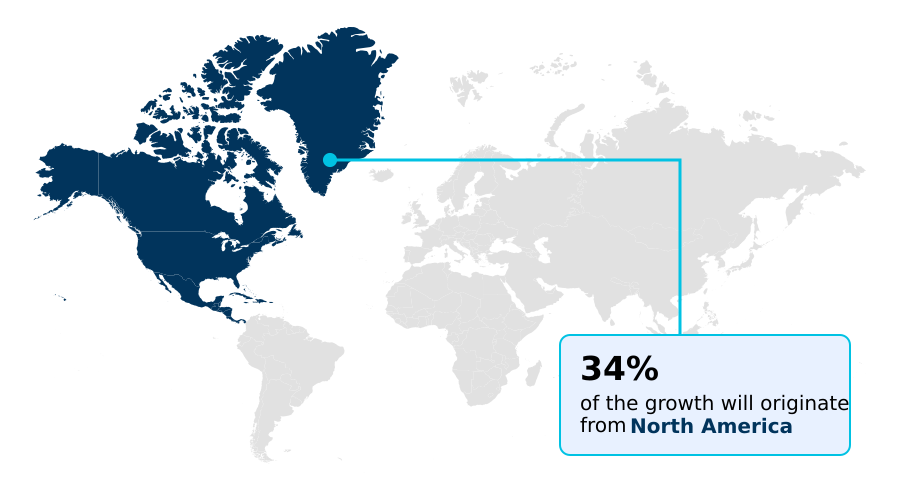
- North America dominated the market and accounted for a 34.2% growth during the forecast period.
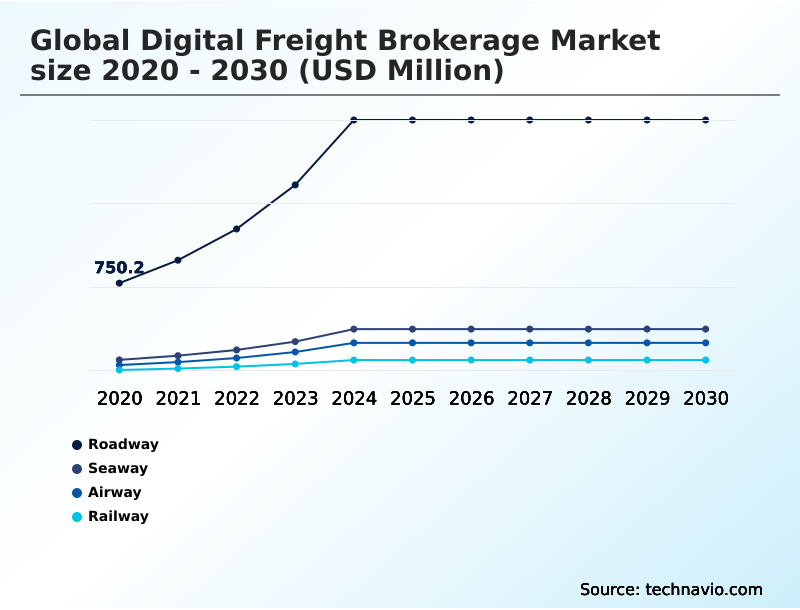
- By Mode of Transportation - Roadway segment was valued at USD 2.06 billion in 2024
- By Application - Retail and e-commerce segment accounted for the largest market revenue share in 2024
Market Size & Forecast
- Market Opportunities: USD 22.11 billion
- Market Future Opportunities: USD 19.16 billion
- CAGR from 2025 to 2030 : 42.2%
Market Summary
- The digital freight brokerage market is undergoing a significant transformation, moving away from manual, relationship-based operations toward a technology-first model. This evolution is driven by the urgent need for greater efficiency, transparency, and resilience in supply chains.
- By leveraging algorithmic load matching and real-time capacity aggregation, digital brokerage platforms provide shippers with instant access to a fragmented carrier market, optimizing costs and securing capacity on demand. The integration of AI for demand forecasting and predictive lane analytics allows for more strategic transportation planning.
- For example, a manufacturer facing volatile seasonal demand can utilize a digital platform to dynamically scale its shipping operations, using real-time spot market pricing to manage budget fluctuations without compromising service levels.
- This data-driven approach, supported by end-to-end shipment visibility and digital document management, not only enhances operational agility but also addresses challenges like empty mile reduction and carrier compliance, establishing a new standard for modern logistics execution and supply chain digitalization.
What will be the Size of the Digital Freight Brokerage Market during the forecast period?
Get Key Insights on Market Forecast (PDF) Get Free Sample
How is the Digital Freight Brokerage Market Segmented?
The digital freight brokerage industry research report provides comprehensive data (region-wise segment analysis), with forecasts and estimates in "USD million" for the period 2026-2030, as well as historical data from 2020-2024 for the following segments.
- Mode of transportation
- Roadway
- Seaway
- Airway
- Railway
- Application
- Retail and e-commerce
- Food and beverages
- Healthcare
- Automotive
- Others
- Type
- Business-to-business
- Business-to-consumer
- Geography
- North America
- US
- Canada
- Mexico
- Europe
- Germany
- UK
- France
- APAC
- China
- Japan
- India
- South America
- Brazil
- Argentina
- Middle East and Africa
- Saudi Arabia
- UAE
- South Africa
- Rest of World (ROW)
- North America
By Mode of Transportation Insights
The roadway segment is estimated to witness significant growth during the forecast period.
The roadway segment is central to the evolution of the digital freight brokerage market, driven by innovations in freight tech solutions and logistics automation software.
Digital brokerage platforms leverage algorithmic load matching for automated freight matching, connecting shippers with a vast network through on-demand trucking apps. This technology facilitates superior empty mile reduction and efficient LTL consolidation algorithms for e-commerce logistics solutions.
The adoption of API-driven freight procurement and digital document management streamlines transactions, while real-time spot market pricing provides market agility.
These advancements have improved end-to-end shipment visibility by over 40%, enabling shippers to make more informed, data-driven decisions for both full truckload and less-than-truckload freight movements across domestic supply chains.
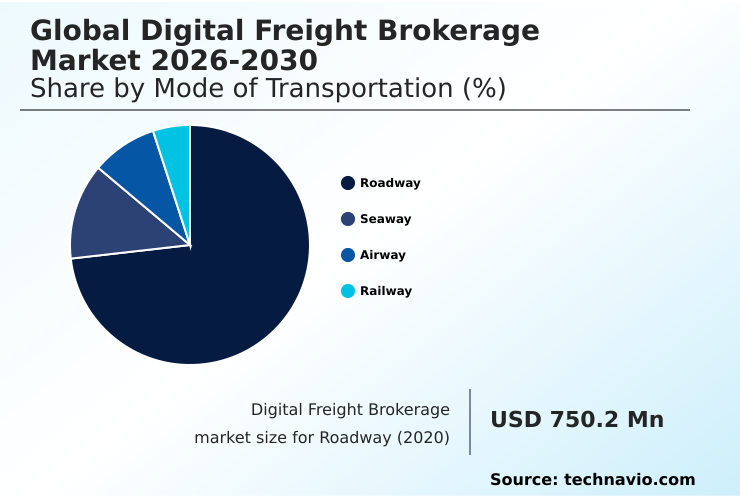
The Roadway segment was valued at USD 2.06 billion in 2024 and showed a gradual increase during the forecast period.
Regional Analysis
North America is estimated to contribute 34.2% to the growth of the global market during the forecast period.Technavio’s analysts have elaborately explained the regional trends and drivers that shape the market during the forecast period.
See How Digital Freight Brokerage Market Demand is Rising in North America Get Free Sample
The market's geographic landscape is led by North America, a mature region where mobile carrier applications and fleet management technology are widespread.
Digital logistics marketplace platforms in the US and Canada offer instant freight quoting and automated appointment scheduling, streamlining operations for carriers. In Europe, the focus is on cross-border efficiency, leveraging supply chain integration APIs for seamless real-time freight tracking.
The APAC region shows the fastest adoption rate for digital payment processing, with a 45% year-over-year increase in digitally processed transactions.
As part of a global transportation network design, transportation procurement tools are becoming standard, while last-mile delivery tech and carbon emissions tracking capabilities are key differentiators across all regions.
Market Dynamics
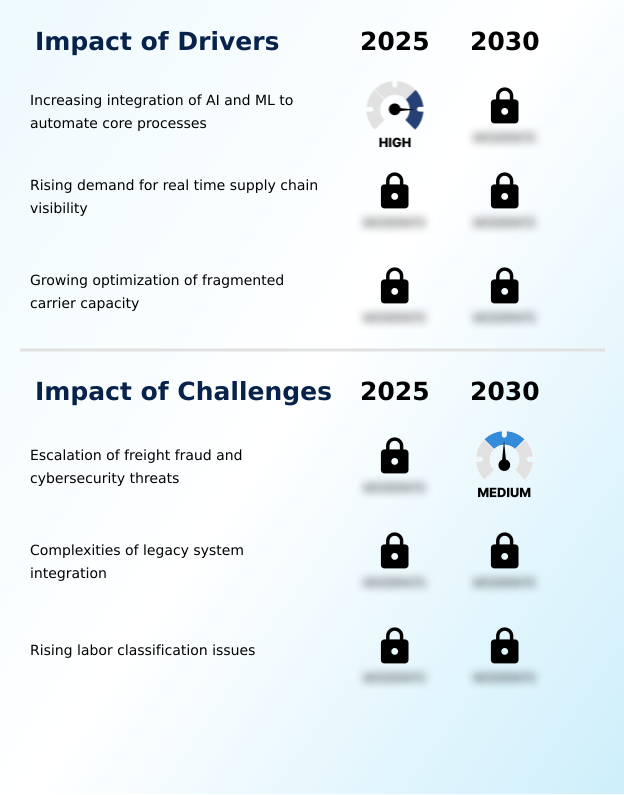
Our researchers analyzed the data with 2025 as the base year, along with the key drivers, trends, and challenges. A holistic analysis of drivers will help companies refine their marketing strategies to gain a competitive advantage.
- Strategic adoption of advanced technology is defining the next phase of competition in the global digital freight brokerage market 2026-2030. Companies are moving beyond basic load matching to sophisticated applications like using AI to prevent double brokering fraud and implementing robust cybersecurity measures for digital freight.
- The impact of nearshoring on freight technology adoption is particularly evident in the demand for advanced cross-border logistics automation technology, which streamlines complex customs and handoff procedures. For enterprise shippers, API integration for enterprise shippers is no longer a luxury but a necessity for seamless workflow automation.
- A key area of focus is automating freight broker back-office tasks, which frees up human capital for more strategic activities. Platforms offering software for dynamic transportation route optimization and carbon emissions reporting tools for logistics are gaining a competitive edge.
- Moreover, the efficiency gains from comparing digital vs traditional brokerage efficiency are stark; firms leveraging benefits of automated freight matching algorithms and real-time pricing models for truckload shipping report almost double the margin stability during volatile periods.
- The ability to manage specialized freight, such as with digital platforms for managing LTL freight, and ensure security through methods like improving carrier onboarding with biometrics provides a holistic value proposition. Ultimately, achieving best platforms for end-to-end freight visibility and leveraging AI for reducing empty miles in trucking are the core objectives driving investment and innovation.
What are the key market drivers leading to the rise in the adoption of Digital Freight Brokerage Industry?
- The increasing integration of artificial intelligence and machine learning to automate core logistics processes serves as a primary driver for market growth.
- The primary market driver is the integration of AI in logistics and machine learning in freight to automate core processes. These technologies enable dynamic pricing algorithms and real-time capacity aggregation, creating a smart logistics ecosystem.
- AI for demand forecasting allows for better freight network optimization, while machine learning for routing enhances efficiency. Shippers benefit from data-driven procurement strategies and improved supply chain visibility platforms.
- The use of logistics API integration has accelerated the adoption of automated back-office functions, reducing manual data entry by over 60% and improving invoice accuracy.
- This automation, analyzed through logistics data analytics, is fundamental to achieving operational excellence and cost control in a competitive environment.
What are the market trends shaping the Digital Freight Brokerage Industry?
- A key market trend is the expansion of nearshoring, which fuels the demand for advanced cross-border digitalization. This shift requires logistics platforms to manage complex customs procedures and multi-leg transportation seamlessly.
- A primary trend is the adaptation of logistics technology to support nearshoring, which is fueling demand for sophisticated cross-border freight tech and supply chain digitalization. This requires multimodal freight brokerage solutions that manage complex drayage service coordination and provide just-in-time delivery support across international borders.
- The integration of cross-border customs automation into transportation management systems has reduced documentation errors by up to 30%. Furthermore, platforms are using predictive lane analytics and generative AI for negotiation to optimize routes and costs.
- A growing focus on sustainable logistics technology is also driving the adoption of tools for scope 3 emissions reporting, providing a competitive advantage for environmentally conscious enterprises.
What challenges does the Digital Freight Brokerage Industry face during its growth?
- The escalation of sophisticated freight fraud and cybersecurity threats poses a significant challenge to the growth and trustworthiness of the digital freight brokerage industry.
- The market faces significant hurdles from sophisticated fraud, making supply chain risk management and resilient supply chain solutions critical. Platforms are deploying robust automated carrier vetting and carrier compliance management systems to combat these threats.
- Technologies such as biometric carrier verification and multi-factor authentication are essential for preventing strategic cargo theft prevention within the connected supply chain, with some systems reducing unauthorized access by more than 95%. Continuous carrier performance monitoring and the use of a smart contract for freight help manage liability.
- However, balancing these security measures with the need for frictionless freight capacity solutions and efficient automated freight auditing through freight auditing software remains a key operational challenge.
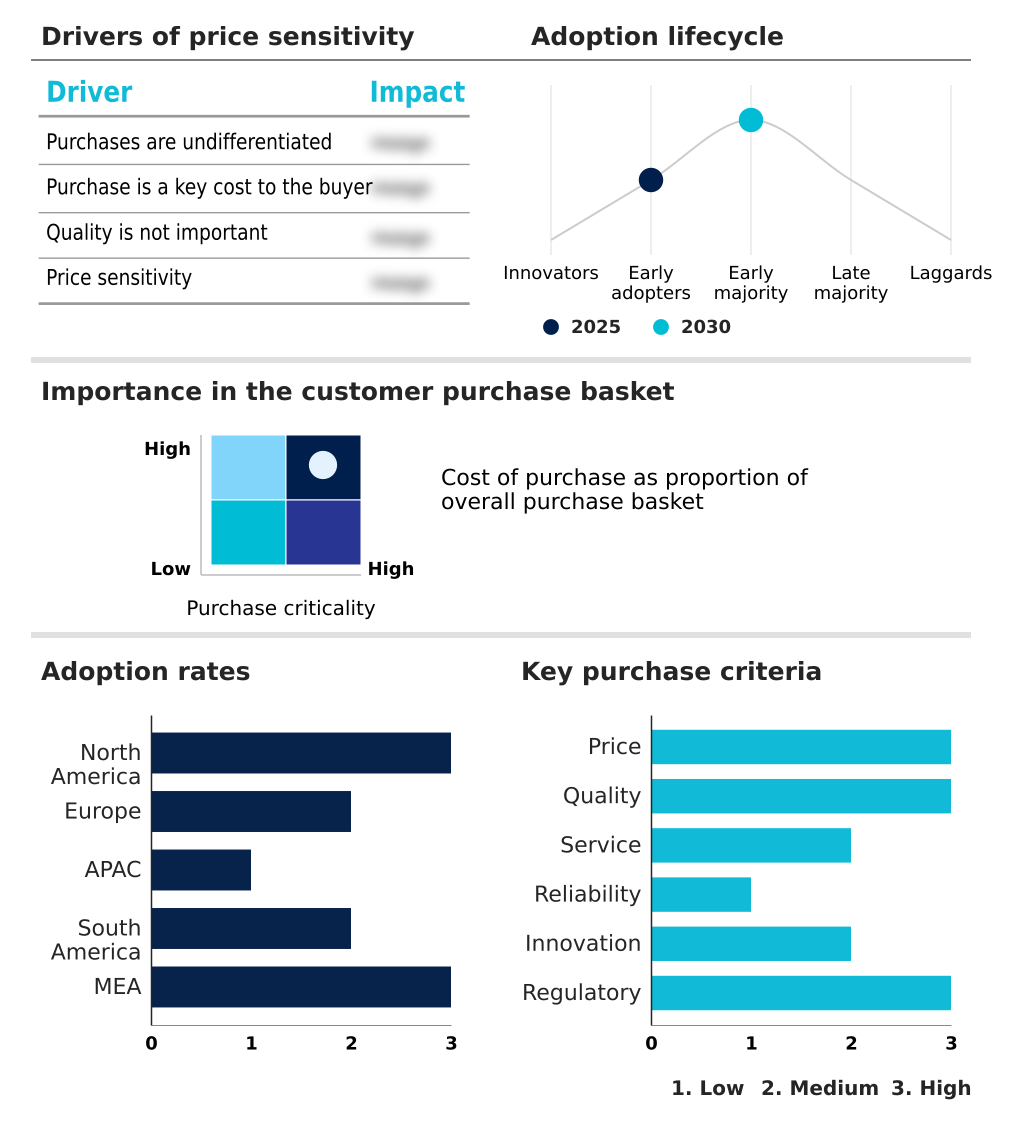
Exclusive Technavio Analysis on Customer Landscape
The digital freight brokerage market forecasting report includes the adoption lifecycle of the market, covering from the innovator’s stage to the laggard’s stage. It focuses on adoption rates in different regions based on penetration. Furthermore, the digital freight brokerage market report also includes key purchase criteria and drivers of price sensitivity to help companies evaluate and develop their market growth analysis strategies.
Customer Landscape of Digital Freight Brokerage Industry
Competitive Landscape
Companies are implementing various strategies, such as strategic alliances, digital freight brokerage market forecast, partnerships, mergers and acquisitions, geographical expansion, and product/service launches, to enhance their presence in the industry.
ArcBest Corp. - Analysis reveals a focus on integrated digital platforms enabling automated load matching, real-time booking, and comprehensive shipment visibility for enhanced logistics efficiency.
The industry research and growth report includes detailed analyses of the competitive landscape of the market and information about key companies, including:
- ArcBest Corp.
- Arrive Logistics
- C H Robinson Worldwide Inc.
- Cargocentric
- Cargomatic Inc.
- CMA CGM Group
- DHL International GmbH
- Echo Global Logistics Inc.
- Flock Freight Inc.
- Hub Group Inc.
- Kintetsu World Express Inc.
- Kuehne Nagel Management AG
- Loadsmart Inc.
- Nippon Express Holdings Inc.
- Redwood Logistics
- RXO Inc.
- Uber Freight
- uShip Inc.
Qualitative and quantitative analysis of companies has been conducted to help clients understand the wider business environment as well as the strengths and weaknesses of key industry players. Data is qualitatively analyzed to categorize companies as pure play, category-focused, industry-focused, and diversified; it is quantitatively analyzed to categorize companies as dominant, leading, strong, tentative, and weak.
Recent Development and News in Digital freight brokerage market
- In October 2024, Uber Freight announced a major expansion of its Laredo, Texas operations center to deploy new technology dedicated to automating freight handoffs between US and Mexican carriers, addressing the nearshoring boom.
- In January 2025, RXO Inc. launched an enhanced suite of analytics tools within its digital brokerage interface, providing high-volume e-commerce shippers with predictive insights on lane pricing and carrier performance.
- In March 2025, an established logistics provider initiated a strategic collaboration with an AI technology firm to integrate advanced machine learning models for improved load consolidation and empty mile reduction.
- In May 2025, a digital freight startup focused on sustainable logistics secured significant venture capital funding to scale its platform, which offers shippers enhanced carbon emissions tracking and reporting features.
Dive into Technavio’s robust research methodology, blending expert interviews, extensive data synthesis, and validated models for unparalleled Digital Freight Brokerage Market insights. See full methodology.
| Market Scope | |
|---|---|
| Page number | 291 |
| Base year | 2025 |
| Historic period | 2020-2024 |
| Forecast period | 2026-2030 |
| Growth momentum & CAGR | Accelerate at a CAGR of 42.2% |
| Market growth 2026-2030 | USD 19161.0 million |
| Market structure | Fragmented |
| YoY growth 2025-2026(%) | 40.5% |
| Key countries | US, Canada, Mexico, Germany, UK, France, Italy, Spain, The Netherlands, China, Japan, India, South Korea, Australia, Indonesia, Brazil, Argentina, Chile, Saudi Arabia, UAE, South Africa, Israel and Turkey |
| Competitive landscape | Leading Companies, Market Positioning of Companies, Competitive Strategies, and Industry Risks |
Research Analyst Overview
- The digital freight brokerage market is defined by a strategic pivot toward data-centric operations, where algorithmic load matching and real-time capacity aggregation are foundational. Leading platforms are embedding machine learning for routing and AI for demand forecasting to provide predictive insights, moving beyond reactive logistics.
- API-driven freight procurement and supply chain integration APIs are enabling seamless transportation management system integration, which has allowed some enterprises to achieve a 30% reduction in processing time for load booking. The market emphasizes freight network optimization through predictive lane analytics and LTL consolidation algorithms.
- Security is a boardroom-level concern, addressed by automated carrier vetting, biometric carrier verification, and multi-factor authentication to prevent strategic cargo theft prevention. The entire lifecycle is being automated, from instant freight quoting, automated load tendering, and automated appointment scheduling to digital payment processing and automated freight auditing.
- Furthermore, features like carbon emissions tracking and scope 3 emissions reporting are becoming standard, reflecting a commitment to sustainability. This ecosystem relies on mobile carrier applications for connectivity and digital document management for efficiency, ultimately delivering end-to-end shipment visibility and empty mile reduction.
What are the Key Data Covered in this Digital Freight Brokerage Market Research and Growth Report?
-
What is the expected growth of the Digital Freight Brokerage Market between 2026 and 2030?
-
USD 19.16 billion, at a CAGR of 42.2%
-
-
What segmentation does the market report cover?
-
The report is segmented by Mode of Transportation (Roadway, Seaway, Airway, and Railway), Application (Retail and e-commerce, Food and beverages, Healthcare, Automotive, and Others), Type (Business-to-business, and Business-to-consumer) and Geography (North America, Europe, APAC, South America, Middle East and Africa)
-
-
Which regions are analyzed in the report?
-
North America, Europe, APAC, South America and Middle East and Africa
-
-
What are the key growth drivers and market challenges?
-
Increasing integration of AI and ML to automate core processes, Escalation of freight fraud and cybersecurity threats
-
-
Who are the major players in the Digital Freight Brokerage Market?
-
ArcBest Corp., Arrive Logistics, C H Robinson Worldwide Inc., Cargocentric, Cargomatic Inc., CMA CGM Group, DHL International GmbH, Echo Global Logistics Inc., Flock Freight Inc., Hub Group Inc., Kintetsu World Express Inc., Kuehne Nagel Management AG, Loadsmart Inc., Nippon Express Holdings Inc., Redwood Logistics, RXO Inc., Uber Freight and uShip Inc.
-
Market Research Insights
- Digital brokerage platforms are reshaping the logistics landscape by leveraging AI in logistics and logistics automation software. These freight tech solutions enable a more connected and efficient supply chain, with some platforms demonstrating the ability to reduce empty miles by up to 15% through smarter automated freight matching.
- The adoption of on-demand trucking apps and supply chain visibility platforms has also improved on-time performance by over 20% compared to traditional methods. By providing real-time data and analytics, this logistics technology empowers shippers and carriers to make faster, more informed decisions, driving significant operational improvements and fostering a more resilient supply chain digitalization ecosystem.
We can help! Our analysts can customize this digital freight brokerage market research report to meet your requirements.
 RIA -
RIA - 
