Freight Brokerage Market Analysis, Size, and Forecast 2026-2030: APAC (China, Japan, and South Korea), Europe (Germany, France, and UK), North America (US, Canada, and Mexico), Middle East and Africa (UAE, Saudi Arabia, and South Africa), South America (Brazil and Argentina), and Rest of World (ROW)

Freight Brokerage Market Analysis, Size, and Forecast 2026-2030:
APAC (China, Japan, and South Korea), Europe (Germany, France, and UK), North America (US, Canada, and Mexico), Middle East and Africa (UAE, Saudi Arabia, and South Africa), South America (Brazil and Argentina), and Rest of World (ROW)

Published: Mar 2026 293 Pages SKU: IRTNTR40504

Market Overview at a Glance

$20.13 B
Market Opportunity
5.8%
CAGR 2025 - 2030
42.3%
APAC Growth
$21.00 B
LTL segment 2024

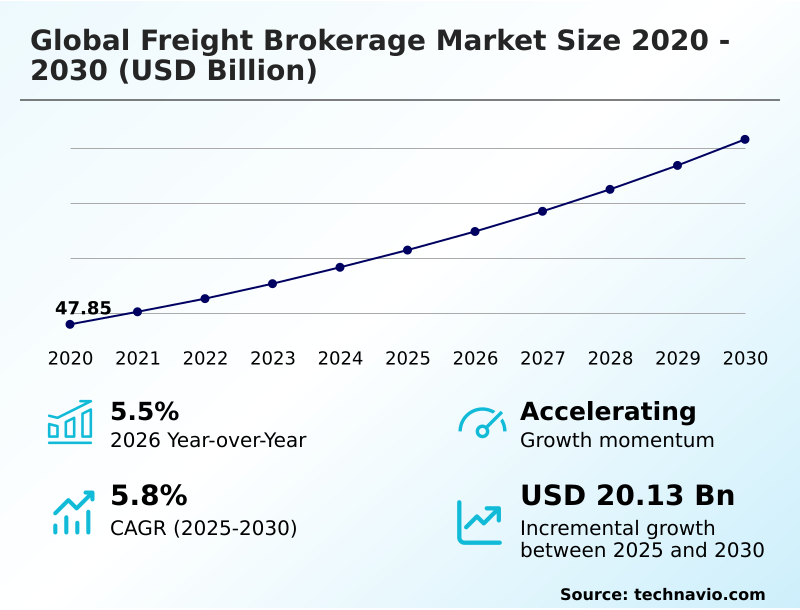
Freight Brokerage Market Size 2026-2030

The freight brokerage market size is valued to increase by USD 20.13 billion, at a CAGR of 5.8% from 2025 to 2030. Presence of FTAs and trade blocs at global level will drive the freight brokerage market.

Major Market Trends & Insights

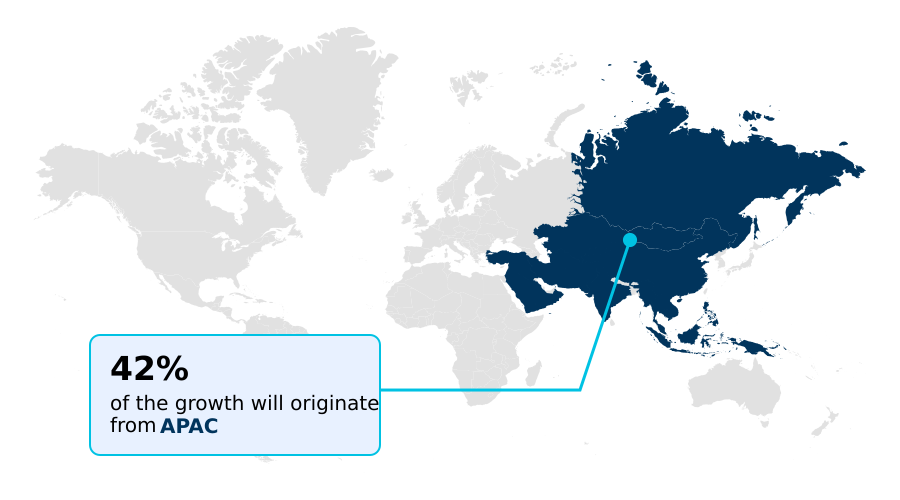
  • APAC dominated the market and accounted for a 42.3% growth during the forecast period.
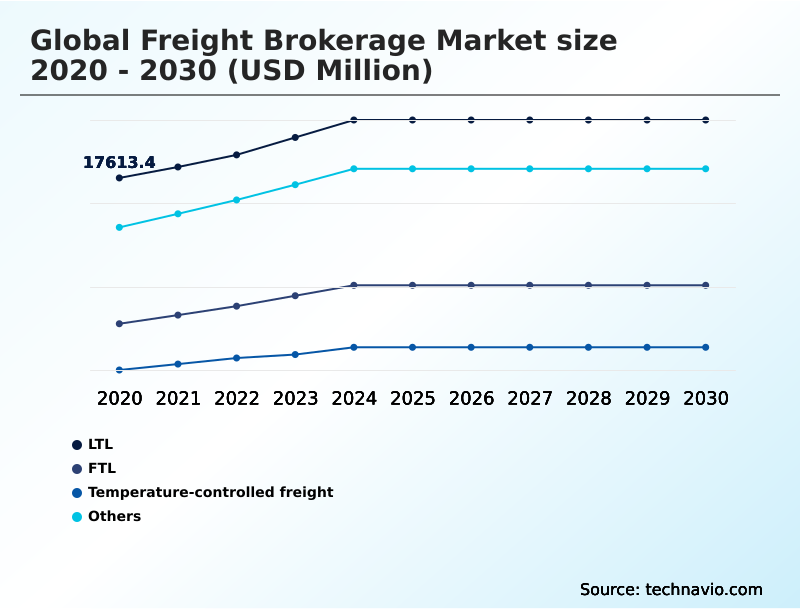
  • By Service - LTL segment was valued at USD 21.00 billion in 2024
  • By Mode of Transportation - Road segment accounted for the largest market revenue share in 2024

Market Size & Forecast

  • Market Opportunities: USD 33.63 billion
  • Market Future Opportunities: USD 20.13 billion
  • CAGR from 2025 to 2030 : 5.8%

Market Summary

  • The Freight Brokerage Market serves as a critical intermediary in logistics, connecting shippers with transport providers to facilitate the movement of goods. This market is defined by its role in optimizing supply chains through services like load matching, rate negotiation, and shipment tracking.
  • A key driver is the increasing adoption of digital freight platforms that provide real-time visibility and automate manual processes. For instance, a retail company can use a brokerage service for supply chain optimization, securing flexible less-than-truckload (LTL) and full-truckload (FTL) capacity to manage fluctuating inventory demands without owning assets. This allows for improved efficiency and cost control.
  • However, the industry faces challenges from carrier capacity constraints and the need for robust cybersecurity. The growth of e-commerce continues to fuel demand for sophisticated logistics services, including last-mile delivery and reverse logistics coordination. As technology evolves, the integration of predictive analytics and AI is becoming standard, enabling brokers to offer more proactive and resilient solutions.
  • This ongoing digital transformation is reshaping the competitive landscape, pushing providers to deliver greater value through enhanced data insights and seamless operational integration.

What will be the Size of the Freight Brokerage Market during the forecast period?

Get Key Insights on Market Forecast (PDF) Request Free Sample

How is the Freight Brokerage Market Segmented?

The freight brokerage industry research report provides comprehensive data (region-wise segment analysis), with forecasts and estimates in "USD million" for the period 2026-2030, as well as historical data from 2020-2024 for the following segments.

  • Service
    • LTL
    • FTL
    • Temperature-controlled freight
    • Others
  • Mode of transportation
    • Road
    • Inland waterways and coastal shipping
    • Others
  • Consumer
    • B2B
    • B2C
  • Geography
    • APAC
      • China
      • Japan
      • South Korea
    • Europe
      • Germany
      • France
      • UK
    • North America
      • US
      • Canada
      • Mexico
    • Middle East and Africa
      • UAE
      • Saudi Arabia
      • South Africa
    • South America
      • Brazil
      • Argentina
    • Rest of World (ROW)

By Service Insights

The ltl segment is estimated to witness significant growth during the forecast period.

The Less-than-Truckload (LTL) segment is fundamental to modern supply chains, enabling businesses to move smaller freight volumes efficiently.

Brokers add significant value by managing freight consolidation and coordinating multimodal transport options, which can improve transit times by over 15% compared to unmanaged shipments.

Effective LTL brokerage hinges on advanced transportation management system (TMS) integration and digital freight platforms for dynamic route optimization and real-time freight visibility.

Services extend to handling the bill of lading (BOL) and ensuring proof of delivery (POD), simplifying complex logistics.

Through tech-enabled brokerage and robust logistics network optimization, shippers gain access to flexible capacity and cost-effective shipment execution without the overhead of full-truckload commitments, supporting just-in-time inventory strategies.

Request Free Sample

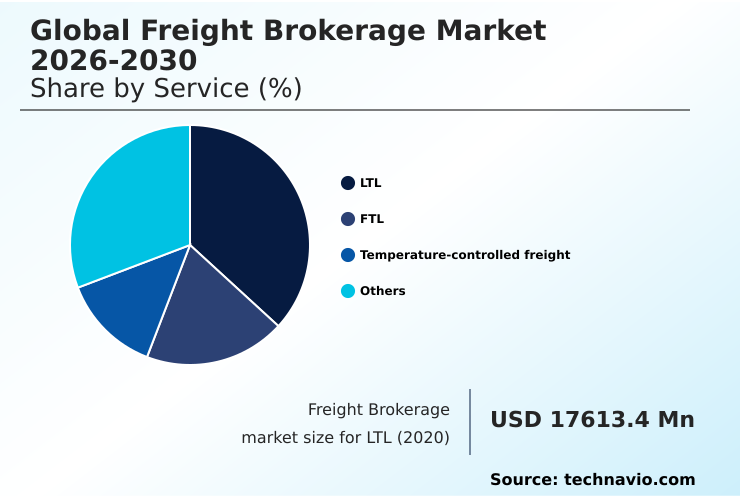
The LTL segment was valued at USD 21.00 billion in 2024 and showed a gradual increase during the forecast period.

Request Free Sample

Regional Analysis

APAC is estimated to contribute 42.3% to the growth of the global market during the forecast period.Technavio’s analysts have elaborately explained the regional trends and drivers that shape the market during the forecast period.

See How Freight Brokerage Market Demand is Rising in APAC Request Free Sample

The geographic landscape of the freight brokerage market is shaped by regional trade dynamics and infrastructure maturity, with APAC emerging as the primary growth engine, contributing 42.3% of the market's incremental growth.

This is driven by expanding manufacturing and e-commerce sectors that require sophisticated drayage services and cross-border logistics.

North America remains a substantial market, accounting for 22.34% of growth, with a focus on intermodal freight transportation and advanced freight audit and payment systems.

In Europe, the emphasis is on sustainable logistics and efficient carrier management within a complex regulatory framework.

Across all regions, predictive shipment ETAs and the adoption of freight tech are enhancing shipment execution and supply chain visibility, while automated documentation streamlines international trade flows.

Market Dynamics

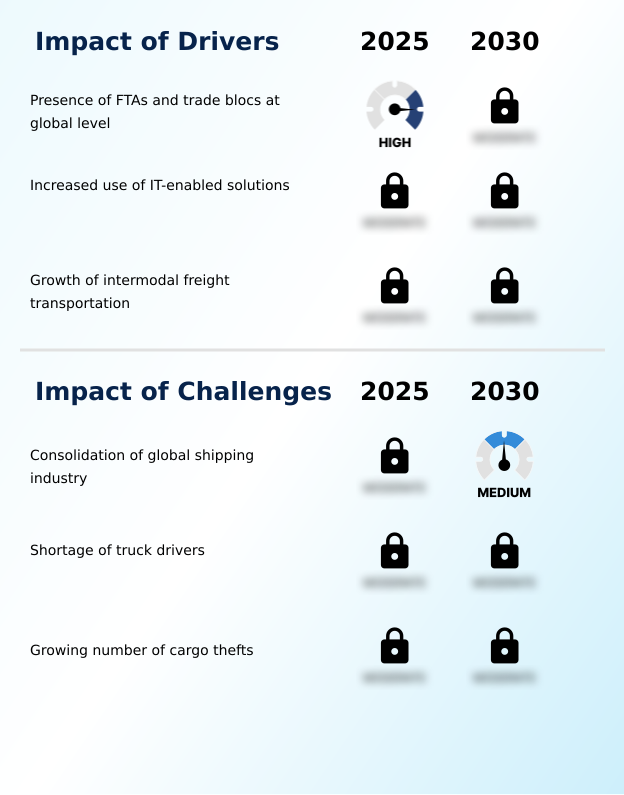
Our researchers analyzed the data with 2025 as the base year, along with the key drivers, trends, and challenges. A holistic analysis of drivers will help companies refine their marketing strategies to gain a competitive advantage.

  • The evolution of the global freight brokerage market 2026-2030 is increasingly defined by the strategic adoption of specialized technologies. Optimizing freight brokerage with AI is no longer a futuristic concept but a present-day reality, enabling predictive analytics for freight demand and more accurate rate negotiation.
  • Digital platforms now offer robust solutions for managing LTL freight consolidation services and ensuring FTL capacity and rate negotiation are transparent and efficient. For international trade, cross-border freight compliance solutions are being integrated directly into brokerage workflows, automating the tendering process and the handling of freight insurance claims digitally.
  • Technology for freight audit and payment streamlines financial operations, while a supply chain visibility platform integration provides the end-to-end tracking essential for modern logistics. This includes real-time freight tracking platforms and API for transportation management systems. In urban logistics, firms are focused on improving last-mile delivery efficiency.
  • Specialized areas like temperature-controlled pharma logistics, drayage service coordination at ports, and securing high-value cargo transport all benefit from these advancements. Strategies for backhaul optimization and better carrier performance and vetting standards are helping to reduce demurrage and detention fees.
  • For shippers, the ability to manage intermodal transport cost reduction and access digital freight matching for spot markets offers a significant competitive advantage, with companies using such integrated systems reporting a near 40% reduction in booking errors compared to manual methods.

What are the key market drivers leading to the rise in the adoption of Freight Brokerage Industry?

  • The presence of free trade agreements and trade blocs at a global level is a key driver for the market.

  • Market growth is significantly propelled by the adoption of IT-enabled solutions and the expansion of intermodal transport. The presence of free trade agreements facilitates smoother cross-border trade, increasing the demand for expert customs brokerage and compliance management.
  • Digitalization is a primary driver, with the rapid adoption of digital freight marketplaces and AI-driven platforms like Zayren transforming operations. These tools automate rate prediction and carrier vetting, improving pricing accuracy by over 15%.
  • The expansion of intermodal freight transportation, integrating rail and maritime with road transport, offers more cost-effective and resilient supply chain solutions.
  • This multimodal approach enables brokers to offer dynamic route planning and optimize logistics cost reduction, with integrated networks reporting a 10% improvement in overall transit efficiency.

What are the market trends shaping the Freight Brokerage Industry?

  • A key market trend is the rise in industrial production, which directly contributes to an increase in port container throughput volumes globally.

  • Key trends are reshaping the freight brokerage market, driven by industrial growth and the expansion of e-commerce. A significant rise in global manufacturing is increasing port container throughput, demanding more advanced freight forwarding and managed transportation services. This surge necessitates greater supply chain orchestration and logistics automation to handle higher volumes efficiently.
  • Brokers are adopting AI-powered load booking and predictive analytics to manage this complexity, with analytics improving demand forecasting accuracy by up to 18%. The exponential growth of online retail is fueling demand for agile last-mile delivery and sophisticated transportation procurement strategies.
  • This trend toward high-frequency, smaller shipments has accelerated the adoption of technologies that support real-time shipment tracking and exception management, where automated alerts can reduce issue resolution time by 30%.

What challenges does the Freight Brokerage Industry face during its growth?

  • The consolidation of the global shipping industry presents a key challenge affecting market growth.

  • The freight brokerage market faces significant structural challenges that demand strategic adaptation. The ongoing consolidation within the global shipping industry reduces carrier options, intensifying competition for freight capacity sourcing and complicating contract freight negotiations. This consolidation can lead to less transparent pricing and higher spot market rates.
  • A persistent shortage of truck drivers further strains capacity, impacting the load-to-truck ratio and increasing operational costs. Brokers must now invest more in carrier relationship management to secure reliable transport. Another pressing issue is the rise in cargo thefts, which necessitates stronger cargo security protocols and thorough carrier vetting.
  • The implementation of advanced security measures, while essential, increases operational expenses by 5-8% for high-value shipments, impacting overall freight spend management and profitability.

Exclusive Technavio Analysis on Customer Landscape

The freight brokerage market forecasting report includes the adoption lifecycle of the market, covering from the innovator’s stage to the laggard’s stage. It focuses on adoption rates in different regions based on penetration. Furthermore, the freight brokerage market report also includes key purchase criteria and drivers of price sensitivity to help companies evaluate and develop their market growth analysis strategies.

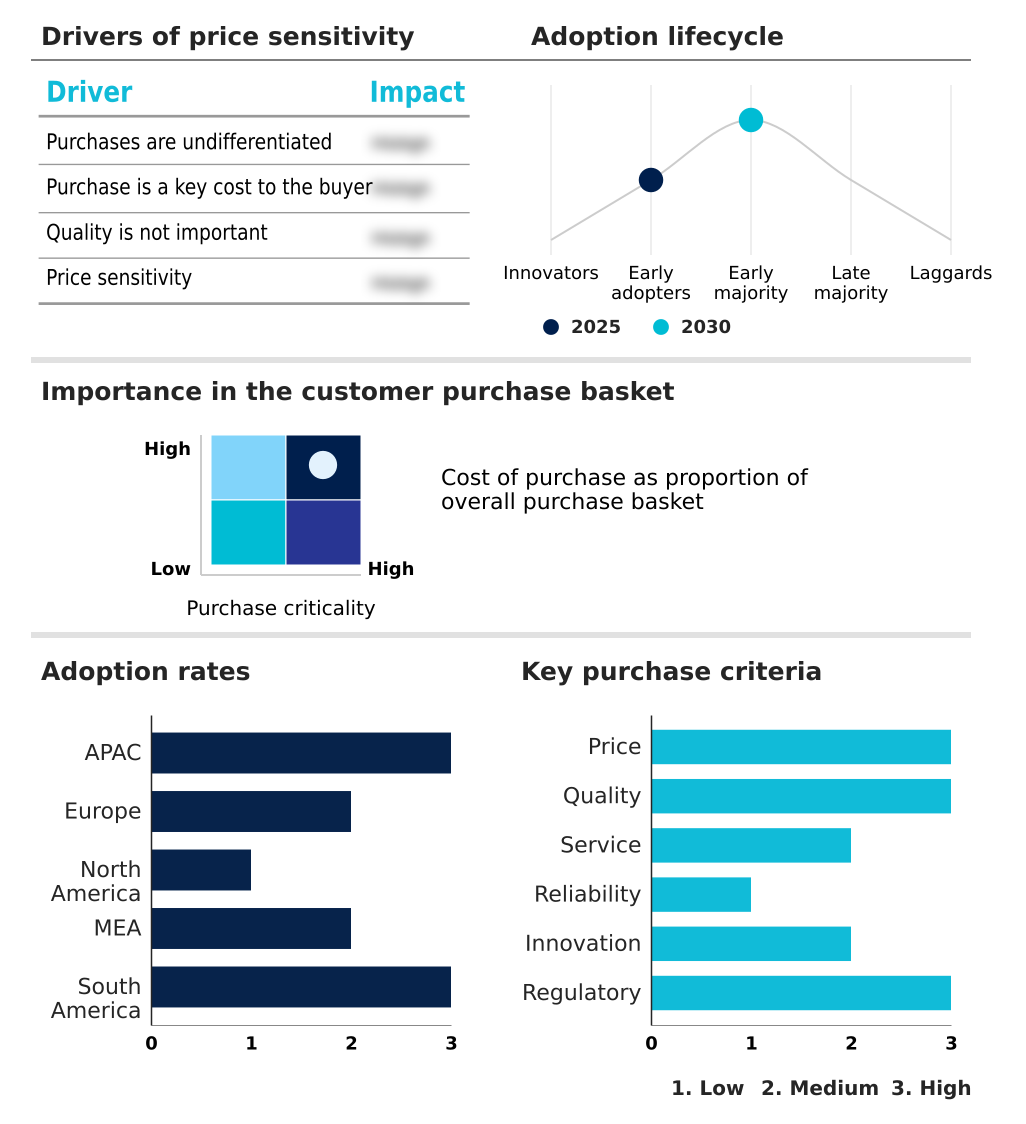
Customer Landscape of Freight Brokerage Industry

Competitive Landscape

Companies are implementing various strategies, such as strategic alliances, freight brokerage market forecast, partnerships, mergers and acquisitions, geographical expansion, and product/service launches, to enhance their presence in the industry.

ArcBest Corp. - From a research perspective, the strategic focus is on integrated logistics, delivering end-to-end transportation management and multimodal brokerage solutions to optimize intricate global supply chains.

The industry research and growth report includes detailed analyses of the competitive landscape of the market and information about key companies, including:

  • ArcBest Corp.
  • Armstrong Transport Group
  • Arrive Logistics
  • Atlanta Bonded Warehouse Corp.
  • Blue-Grace Logistics LLC
  • C H Robinson Worldwide Inc.
  • Echo Global Logistics Inc.
  • England Logistics
  • Hub Group Inc.
  • Landstar System Inc.
  • MegaCorp Logistics
  • Mode Global LLC
  • Priority 1 Inc.
  • Redwood Logistics
  • RXO Inc.
  • Schneider National Inc.
  • Steam Logistics LLC
  • Uber Freight
  • Werner Enterprises Inc.
  • WWEX Group

Qualitative and quantitative analysis of companies has been conducted to help clients understand the wider business environment as well as the strengths and weaknesses of key industry players. Data is qualitatively analyzed to categorize companies as pure play, category-focused, industry-focused, and diversified; it is quantitatively analyzed to categorize companies as dominant, leading, strong, tentative, and weak.

Recent Development and News in Freight brokerage market

  • In March, 2025, Freight Technologies, Inc. launched an advanced AI Tendering Bot to automate the capture and structuring of freight requests from unstructured sources like emails and text messages into its Fr8App marketplace.
  • In May, 2025, Freightos Limited enhanced its WebCargo platform to include ocean freight, enabling forwarders to manage rate creation, quoting, and bookings for both air and ocean shipments within a unified system.
  • In August, 2025, CSX and BNSF launched new intermodal services to create seamless coast-to-coast rail solutions in the US, aiming to shift freight from over-the-road trucking to more efficient rail options.
  • In September, 2025, C.H. Robinson introduced a cross-border logistics service for North America, integrating freight consolidation, transportation, customs brokerage, and warehousing into a single solution to enhance visibility and reduce costs.

Dive into Technavio’s robust research methodology, blending expert interviews, extensive data synthesis, and validated models for unparalleled Freight Brokerage Market insights. See full methodology.

Market Scope
Page number 293
Base year 2025
Historic period 2020-2024
Forecast period 2026-2030
Growth momentum & CAGR Accelerate at a CAGR of 5.8%
Market growth 2026-2030 USD 20132.7 million
Market structure Fragmented
YoY growth 2025-2026(%) 5.5%
Key countries China, Japan, South Korea, India, Australia, Indonesia, Germany, France, UK, Spain, Italy, The Netherlands, US, Canada, Mexico, UAE, Saudi Arabia, South Africa, Qatar, Turkey, Brazil, Argentina and Chile
Competitive landscape Leading Companies, Market Positioning of Companies, Competitive Strategies, and Industry Risks

Request Free Sample

Research Analyst Overview

  • The Freight Brokerage Market is fundamentally evolving from a relationship-based service to a technology-driven ecosystem. Core operations now center on digital freight matching, where algorithms facilitate load matching and dynamic pricing with high efficiency. The integration of predictive analytics into a transportation management system (TMS) enables superior supply chain optimization and more accurate spot market rates.
  • Key processes such as rate negotiation, carrier management, and shipment tracking are increasingly automated. For boardroom consideration, the adoption of these technologies directly impacts financial performance; for example, robust freight audit and payment systems have demonstrated a 30% reduction in billing discrepancies.
  • Essential components like the bill of lading (BOL) and proof of delivery (POD) are now digitized, improving compliance and reducing administrative overhead. The market's structure is also shifting toward asset-light logistics models, which leverage freight consolidation and backhaul optimization to maximize capacity utilization and manage both less-than-truckload (LTL) and full-truckload (FTL) shipments effectively.

What are the Key Data Covered in this Freight Brokerage Market Research and Growth Report?

  • What is the expected growth of the Freight Brokerage Market between 2026 and 2030?

    • USD 20.13 billion, at a CAGR of 5.8%

  • What segmentation does the market report cover?

    • The report is segmented by Service (LTL, FTL, Temperature-controlled freight, and Others), Mode of Transportation (Road, Inland waterways and coastal shipping, and Others), Consumer (B2B, and B2C) and Geography (APAC, Europe, North America, Middle East and Africa, South America)

  • Which regions are analyzed in the report?

    • APAC, Europe, North America, Middle East and Africa and South America

  • What are the key growth drivers and market challenges?

    • Presence of FTAs and trade blocs at global level, Consolidation of global shipping industry

  • Who are the major players in the Freight Brokerage Market?

    • ArcBest Corp., Armstrong Transport Group, Arrive Logistics, Atlanta Bonded Warehouse Corp., Blue-Grace Logistics LLC, C H Robinson Worldwide Inc., Echo Global Logistics Inc., England Logistics, Hub Group Inc., Landstar System Inc., MegaCorp Logistics, Mode Global LLC, Priority 1 Inc., Redwood Logistics, RXO Inc., Schneider National Inc., Steam Logistics LLC, Uber Freight, Werner Enterprises Inc. and WWEX Group

Market Research Insights

  • The freight brokerage market is undergoing a significant transformation, driven by technology and shifting shipper demands for greater efficiency. Digital freight marketplaces are becoming central, improving capacity utilization by over 20% through better load matching and backhaul optimization. These platforms provide enhanced supply chain resilience by offering access to a wider network of vetted carriers.
  • The adoption of logistics automation, including automated tendering, has been shown to reduce quote response times by as much as 50%, enabling faster shipment execution. Furthermore, integrated freight data analytics provides deep insights into performance metrics, allowing for strategic freight spend management and logistics cost reduction.
  • This data-driven approach is fundamental to navigating the complexities of modern transportation procurement and achieving a competitive edge.

We can help! Our analysts can customize this freight brokerage market research report to meet your requirements.

Get in touch

1. Executive Summary

1.1 Market overview

Executive Summary - Chart on Market Overview
Executive Summary - Data Table on Market Overview
Executive Summary - Chart on Global Market Characteristics
Executive Summary - Chart on Market by Geography
Executive Summary - Chart on Market Segmentation by Service
Executive Summary - Chart on Market Segmentation by Mode of Transportation
Executive Summary - Chart on Market Segmentation by Consumer
Executive Summary - Chart on Incremental Growth
Executive Summary - Data Table on Incremental Growth
Executive Summary - Chart on Company Market Positioning

2. Technavio Analysis

2.1 Analysis of price sensitivity, lifecycle, customer purchase basket, adoption rates, and purchase criteria

2.2 Criticality of inputs and Factors of differentiation

Chart on Overview on criticality of inputs and factors of differentiation

2.3 Factors of disruption

Chart on Overview on factors of disruption

2.4 Impact of drivers and challenges

Chart on Impact of drivers and challenges in 2025 and 2030

3. Market Landscape

3.1 Market ecosystem

Chart on Parent Market
Data Table on - Parent Market

3.2 Market characteristics

Chart on Market characteristics analysis

3.3 Value chain analysis

Chart on Value chain analysis

4. Market Sizing

4.1 Market definition

Data Table on Offerings of companies included in the market definition

4.2 Market segment analysis

Market segments

4.3 Market size 2025

4.4 Market outlook: Forecast for 2025-2030

Chart on Global - Market size and forecast 2025-2030 ($ million)
Data Table on Global - Market size and forecast 2025-2030 ($ million)
Chart on Global Market: Year-over-year growth 2025-2030 (%)
Data Table on Global Market: Year-over-year growth 2025-2030 (%)

5. Historic Market Size

5.1 Global Freight Brokerage Market 2020 - 2024

Historic Market Size - Data Table on Global Freight Brokerage Market 2020 - 2024 ($ million)

5.2 Service segment analysis 2020 - 2024

Historic Market Size - Service Segment 2020 - 2024 ($ million)

5.3 Mode of Transportation segment analysis 2020 - 2024

Historic Market Size - Mode of Transportation Segment 2020 - 2024 ($ million)

5.4 Consumer segment analysis 2020 - 2024

Historic Market Size - Consumer Segment 2020 - 2024 ($ million)

5.5 Geography segment analysis 2020 - 2024

Historic Market Size - Geography Segment 2020 - 2024 ($ million)

5.6 Country segment analysis 2020 - 2024

Historic Market Size - Country Segment 2020 - 2024 ($ million)

6. Qualitative Analysis

6.1 Impact of AI on Global Freight Brokerage Market

7. Five Forces Analysis

7.1 Five forces summary

Five forces analysis - Comparison between 2025 and 2030

7.2 Bargaining power of buyers

Bargaining power of buyers - Impact of key factors 2025 and 2030

7.3 Bargaining power of suppliers

Bargaining power of suppliers - Impact of key factors in 2025 and 2030

7.4 Threat of new entrants

Threat of new entrants - Impact of key factors in 2025 and 2030

7.5 Threat of substitutes

Threat of substitutes - Impact of key factors in 2025 and 2030

7.6 Threat of rivalry

Threat of rivalry - Impact of key factors in 2025 and 2030

7.7 Market condition

Chart on Market condition - Five forces 2025 and 2030

8. Market Segmentation by Service

8.1 Market segments

Chart on Service - Market share 2025-2030 (%)
Data Table on Service - Market share 2025-2030 (%)

8.2 Comparison by Service

Chart on Comparison by Service
Data Table on Comparison by Service

8.3 LTL - Market size and forecast 2025-2030

Chart on LTL - Market size and forecast 2025-2030 ($ million)
Data Table on LTL - Market size and forecast 2025-2030 ($ million)
Chart on LTL - Year-over-year growth 2025-2030 (%)
Data Table on LTL - Year-over-year growth 2025-2030 (%)

8.4 FTL - Market size and forecast 2025-2030

Chart on FTL - Market size and forecast 2025-2030 ($ million)
Data Table on FTL - Market size and forecast 2025-2030 ($ million)
Chart on FTL - Year-over-year growth 2025-2030 (%)
Data Table on FTL - Year-over-year growth 2025-2030 (%)

8.5 Temperature-controlled freight - Market size and forecast 2025-2030

Chart on Temperature-controlled freight - Market size and forecast 2025-2030 ($ million)
Data Table on Temperature-controlled freight - Market size and forecast 2025-2030 ($ million)
Chart on Temperature-controlled freight - Year-over-year growth 2025-2030 (%)
Data Table on Temperature-controlled freight - Year-over-year growth 2025-2030 (%)

8.6 Others - Market size and forecast 2025-2030

Chart on Others - Market size and forecast 2025-2030 ($ million)
Data Table on Others - Market size and forecast 2025-2030 ($ million)
Chart on Others - Year-over-year growth 2025-2030 (%)
Data Table on Others - Year-over-year growth 2025-2030 (%)

8.7 Market opportunity by Service

Market opportunity by Service ($ million)
Data Table on Market opportunity by Service ($ million)

9. Market Segmentation by Mode of Transportation

9.1 Market segments

Chart on Mode of Transportation - Market share 2025-2030 (%)
Data Table on Mode of Transportation - Market share 2025-2030 (%)

9.2 Comparison by Mode of Transportation

Chart on Comparison by Mode of Transportation
Data Table on Comparison by Mode of Transportation

9.3 Road - Market size and forecast 2025-2030

Chart on Road - Market size and forecast 2025-2030 ($ million)
Data Table on Road - Market size and forecast 2025-2030 ($ million)
Chart on Road - Year-over-year growth 2025-2030 (%)
Data Table on Road - Year-over-year growth 2025-2030 (%)

9.4 Inland waterways and coastal shipping - Market size and forecast 2025-2030

Chart on Inland waterways and coastal shipping - Market size and forecast 2025-2030 ($ million)
Data Table on Inland waterways and coastal shipping - Market size and forecast 2025-2030 ($ million)
Chart on Inland waterways and coastal shipping - Year-over-year growth 2025-2030 (%)
Data Table on Inland waterways and coastal shipping - Year-over-year growth 2025-2030 (%)

9.5 Others - Market size and forecast 2025-2030

Chart on Others - Market size and forecast 2025-2030 ($ million)
Data Table on Others - Market size and forecast 2025-2030 ($ million)
Chart on Others - Year-over-year growth 2025-2030 (%)
Data Table on Others - Year-over-year growth 2025-2030 (%)

9.6 Market opportunity by Mode of Transportation

Market opportunity by Mode of Transportation ($ million)
Data Table on Market opportunity by Mode of Transportation ($ million)

10. Market Segmentation by Consumer

10.1 Market segments

Chart on Consumer - Market share 2025-2030 (%)
Data Table on Consumer - Market share 2025-2030 (%)

10.2 Comparison by Consumer

Chart on Comparison by Consumer
Data Table on Comparison by Consumer

10.3 B2B - Market size and forecast 2025-2030

Chart on B2B - Market size and forecast 2025-2030 ($ million)
Data Table on B2B - Market size and forecast 2025-2030 ($ million)
Chart on B2B - Year-over-year growth 2025-2030 (%)
Data Table on B2B - Year-over-year growth 2025-2030 (%)

10.4 B2C - Market size and forecast 2025-2030

Chart on B2C - Market size and forecast 2025-2030 ($ million)
Data Table on B2C - Market size and forecast 2025-2030 ($ million)
Chart on B2C - Year-over-year growth 2025-2030 (%)
Data Table on B2C - Year-over-year growth 2025-2030 (%)

10.5 Market opportunity by Consumer

Market opportunity by Consumer ($ million)
Data Table on Market opportunity by Consumer ($ million)

11. Customer Landscape

11.1 Customer landscape overview

Analysis of price sensitivity, lifecycle, customer purchase basket, adoption rates, and purchase criteria

12. Geographic Landscape

12.1 Geographic segmentation

Chart on Market share by geography 2025-2030 (%)
Data Table on Market share by geography 2025-2030 (%)

12.2 Geographic comparison

Chart on Geographic comparison
Data Table on Geographic comparison

12.3 APAC - Market size and forecast 2025-2030

Chart on APAC - Market size and forecast 2025-2030 ($ million)
Data Table on APAC - Market size and forecast 2025-2030 ($ million)
Chart on APAC - Year-over-year growth 2025-2030 (%)
Data Table on APAC - Year-over-year growth 2025-2030 (%)
Chart on Regional Comparison - APAC
Data Table on Regional Comparison - APAC

12.3.1 China - Market size and forecast 2025-2030

Chart on China - Market size and forecast 2025-2030 ($ million)
Data Table on China - Market size and forecast 2025-2030 ($ million)
Chart on China - Year-over-year growth 2025-2030 (%)
Data Table on China - Year-over-year growth 2025-2030 (%)

12.3.2 Japan - Market size and forecast 2025-2030

Chart on Japan - Market size and forecast 2025-2030 ($ million)
Data Table on Japan - Market size and forecast 2025-2030 ($ million)
Chart on Japan - Year-over-year growth 2025-2030 (%)
Data Table on Japan - Year-over-year growth 2025-2030 (%)

12.3.3 South Korea - Market size and forecast 2025-2030

Chart on South Korea - Market size and forecast 2025-2030 ($ million)
Data Table on South Korea - Market size and forecast 2025-2030 ($ million)
Chart on South Korea - Year-over-year growth 2025-2030 (%)
Data Table on South Korea - Year-over-year growth 2025-2030 (%)

12.3.4 India - Market size and forecast 2025-2030

Chart on India - Market size and forecast 2025-2030 ($ million)
Data Table on India - Market size and forecast 2025-2030 ($ million)
Chart on India - Year-over-year growth 2025-2030 (%)
Data Table on India - Year-over-year growth 2025-2030 (%)

12.3.5 Australia - Market size and forecast 2025-2030

Chart on Australia - Market size and forecast 2025-2030 ($ million)
Data Table on Australia - Market size and forecast 2025-2030 ($ million)
Chart on Australia - Year-over-year growth 2025-2030 (%)
Data Table on Australia - Year-over-year growth 2025-2030 (%)

12.3.6 Indonesia - Market size and forecast 2025-2030

Chart on Indonesia - Market size and forecast 2025-2030 ($ million)
Data Table on Indonesia - Market size and forecast 2025-2030 ($ million)
Chart on Indonesia - Year-over-year growth 2025-2030 (%)
Data Table on Indonesia - Year-over-year growth 2025-2030 (%)

12.4 Europe - Market size and forecast 2025-2030

Chart on Europe - Market size and forecast 2025-2030 ($ million)
Data Table on Europe - Market size and forecast 2025-2030 ($ million)
Chart on Europe - Year-over-year growth 2025-2030 (%)
Data Table on Europe - Year-over-year growth 2025-2030 (%)
Chart on Regional Comparison - Europe
Data Table on Regional Comparison - Europe

12.4.1 Germany - Market size and forecast 2025-2030

Chart on Germany - Market size and forecast 2025-2030 ($ million)
Data Table on Germany - Market size and forecast 2025-2030 ($ million)
Chart on Germany - Year-over-year growth 2025-2030 (%)
Data Table on Germany - Year-over-year growth 2025-2030 (%)

12.4.2 France - Market size and forecast 2025-2030

Chart on France - Market size and forecast 2025-2030 ($ million)
Data Table on France - Market size and forecast 2025-2030 ($ million)
Chart on France - Year-over-year growth 2025-2030 (%)
Data Table on France - Year-over-year growth 2025-2030 (%)

12.4.3 UK - Market size and forecast 2025-2030

Chart on UK - Market size and forecast 2025-2030 ($ million)
Data Table on UK - Market size and forecast 2025-2030 ($ million)
Chart on UK - Year-over-year growth 2025-2030 (%)
Data Table on UK - Year-over-year growth 2025-2030 (%)

12.4.4 Spain - Market size and forecast 2025-2030

Chart on Spain - Market size and forecast 2025-2030 ($ million)
Data Table on Spain - Market size and forecast 2025-2030 ($ million)
Chart on Spain - Year-over-year growth 2025-2030 (%)
Data Table on Spain - Year-over-year growth 2025-2030 (%)

12.4.5 Italy - Market size and forecast 2025-2030

Chart on Italy - Market size and forecast 2025-2030 ($ million)
Data Table on Italy - Market size and forecast 2025-2030 ($ million)
Chart on Italy - Year-over-year growth 2025-2030 (%)
Data Table on Italy - Year-over-year growth 2025-2030 (%)

12.4.6 The Netherlands - Market size and forecast 2025-2030

Chart on The Netherlands - Market size and forecast 2025-2030 ($ million)
Data Table on The Netherlands - Market size and forecast 2025-2030 ($ million)
Chart on The Netherlands - Year-over-year growth 2025-2030 (%)
Data Table on The Netherlands - Year-over-year growth 2025-2030 (%)

12.5 North America - Market size and forecast 2025-2030

Chart on North America - Market size and forecast 2025-2030 ($ million)
Data Table on North America - Market size and forecast 2025-2030 ($ million)
Chart on North America - Year-over-year growth 2025-2030 (%)
Data Table on North America - Year-over-year growth 2025-2030 (%)
Chart on Regional Comparison - North America
Data Table on Regional Comparison - North America

12.5.1 US - Market size and forecast 2025-2030

Chart on US - Market size and forecast 2025-2030 ($ million)
Data Table on US - Market size and forecast 2025-2030 ($ million)
Chart on US - Year-over-year growth 2025-2030 (%)
Data Table on US - Year-over-year growth 2025-2030 (%)

12.5.2 Canada - Market size and forecast 2025-2030

Chart on Canada - Market size and forecast 2025-2030 ($ million)
Data Table on Canada - Market size and forecast 2025-2030 ($ million)
Chart on Canada - Year-over-year growth 2025-2030 (%)
Data Table on Canada - Year-over-year growth 2025-2030 (%)

12.5.3 Mexico - Market size and forecast 2025-2030

Chart on Mexico - Market size and forecast 2025-2030 ($ million)
Data Table on Mexico - Market size and forecast 2025-2030 ($ million)
Chart on Mexico - Year-over-year growth 2025-2030 (%)
Data Table on Mexico - Year-over-year growth 2025-2030 (%)

12.6 Middle East and Africa - Market size and forecast 2025-2030

Chart on Middle East and Africa - Market size and forecast 2025-2030 ($ million)
Data Table on Middle East and Africa - Market size and forecast 2025-2030 ($ million)
Chart on Middle East and Africa - Year-over-year growth 2025-2030 (%)
Data Table on Middle East and Africa - Year-over-year growth 2025-2030 (%)
Chart on Regional Comparison - Middle East and Africa
Data Table on Regional Comparison - Middle East and Africa

12.6.1 UAE - Market size and forecast 2025-2030

Chart on UAE - Market size and forecast 2025-2030 ($ million)
Data Table on UAE - Market size and forecast 2025-2030 ($ million)
Chart on UAE - Year-over-year growth 2025-2030 (%)
Data Table on UAE - Year-over-year growth 2025-2030 (%)

12.6.2 Saudi Arabia - Market size and forecast 2025-2030

Chart on Saudi Arabia - Market size and forecast 2025-2030 ($ million)
Data Table on Saudi Arabia - Market size and forecast 2025-2030 ($ million)
Chart on Saudi Arabia - Year-over-year growth 2025-2030 (%)
Data Table on Saudi Arabia - Year-over-year growth 2025-2030 (%)

12.6.3 South Africa - Market size and forecast 2025-2030

Chart on South Africa - Market size and forecast 2025-2030 ($ million)
Data Table on South Africa - Market size and forecast 2025-2030 ($ million)
Chart on South Africa - Year-over-year growth 2025-2030 (%)
Data Table on South Africa - Year-over-year growth 2025-2030 (%)

12.6.4 Qatar - Market size and forecast 2025-2030

Chart on Qatar - Market size and forecast 2025-2030 ($ million)
Data Table on Qatar - Market size and forecast 2025-2030 ($ million)
Chart on Qatar - Year-over-year growth 2025-2030 (%)
Data Table on Qatar - Year-over-year growth 2025-2030 (%)

12.6.5 Turkey - Market size and forecast 2025-2030

Chart on Turkey - Market size and forecast 2025-2030 ($ million)
Data Table on Turkey - Market size and forecast 2025-2030 ($ million)
Chart on Turkey - Year-over-year growth 2025-2030 (%)
Data Table on Turkey - Year-over-year growth 2025-2030 (%)

12.7 South America - Market size and forecast 2025-2030

Chart on South America - Market size and forecast 2025-2030 ($ million)
Data Table on South America - Market size and forecast 2025-2030 ($ million)
Chart on South America - Year-over-year growth 2025-2030 (%)
Data Table on South America - Year-over-year growth 2025-2030 (%)
Chart on Regional Comparison - South America
Data Table on Regional Comparison - South America

12.7.1 Brazil - Market size and forecast 2025-2030

Chart on Brazil - Market size and forecast 2025-2030 ($ million)
Data Table on Brazil - Market size and forecast 2025-2030 ($ million)
Chart on Brazil - Year-over-year growth 2025-2030 (%)
Data Table on Brazil - Year-over-year growth 2025-2030 (%)

12.7.2 Argentina - Market size and forecast 2025-2030

Chart on Argentina - Market size and forecast 2025-2030 ($ million)
Data Table on Argentina - Market size and forecast 2025-2030 ($ million)
Chart on Argentina - Year-over-year growth 2025-2030 (%)
Data Table on Argentina - Year-over-year growth 2025-2030 (%)

12.7.3 Chile - Market size and forecast 2025-2030

Chart on Chile - Market size and forecast 2025-2030 ($ million)
Data Table on Chile - Market size and forecast 2025-2030 ($ million)
Chart on Chile - Year-over-year growth 2025-2030 (%)
Data Table on Chile - Year-over-year growth 2025-2030 (%)

12.8 Market opportunity by geography

Market opportunity by geography ($ million)
Data Tables on Market opportunity by geography ($ million)

13. Drivers, Challenges, and Opportunity

13.1 Market drivers

Presence of FTAs and trade blocs at global level
Increased use of IT-enabled solutions
Growth of intermodal freight transportation

13.2 Market challenges

Consolidation of global shipping industry
Shortage of truck drivers
Growing number of cargo thefts

13.3 Impact of drivers and challenges

Impact of drivers and challenges in 2025 and 2030

13.4 Market opportunities

Rising industrial production leading to increase in port container throughput volume
Growth in global demand for transportation and logistics services
Exponential growth of e-commerce sectors

14. Competitive Landscape

14.1 Overview

14.2

Overview on criticality of inputs and factors of differentiation

14.3 Landscape disruption

Overview on factors of disruption

14.4 Industry risks

Impact of key risks on business

15. Competitive Analysis

15.1 Companies profiled

Companies covered

15.2 Company ranking index

15.3 Market positioning of companies

Matrix on companies position and classification

15.4 Atlanta Bonded Warehouse Corp.

Atlanta Bonded Warehouse Corp. - Overview
Atlanta Bonded Warehouse Corp. - Product / Service
Atlanta Bonded Warehouse Corp. - Key offerings
SWOT

15.5 Blue-Grace Logistics LLC

Blue-Grace Logistics LLC - Overview
Blue-Grace Logistics LLC - Product / Service
Blue-Grace Logistics LLC - Key offerings
SWOT

15.6 C H Robinson Worldwide Inc.

C H Robinson Worldwide Inc. - Overview
C H Robinson Worldwide Inc. - Product / Service
C H Robinson Worldwide Inc. - Key news
C H Robinson Worldwide Inc. - Key offerings
SWOT

15.7 Echo Global Logistics Inc.

Echo Global Logistics Inc. - Overview
Echo Global Logistics Inc. - Product / Service
Echo Global Logistics Inc. - Key offerings
SWOT

15.8 England Logistics

England Logistics - Overview
England Logistics - Product / Service
England Logistics - Key offerings
SWOT

15.9 Hub Group Inc.

Hub Group Inc. - Overview
Hub Group Inc. - Product / Service
Hub Group Inc. - Key offerings
SWOT

15.10 Landstar System Inc.

Landstar System Inc. - Overview
Landstar System Inc. - Product / Service
Landstar System Inc. - Key offerings
SWOT

15.11 MegaCorp Logistics

MegaCorp Logistics - Overview
MegaCorp Logistics - Product / Service
MegaCorp Logistics - Key offerings
SWOT

15.12 Mode Global LLC

Mode Global LLC - Overview
Mode Global LLC - Product / Service
Mode Global LLC - Key offerings
SWOT

15.13 Redwood Logistics

Redwood Logistics - Overview
Redwood Logistics - Product / Service
Redwood Logistics - Key offerings
SWOT

15.14 RXO Inc.

RXO Inc. - Overview
RXO Inc. - Product / Service
RXO Inc. - Key offerings
SWOT

15.15 Schneider National Inc.

Schneider National Inc. - Overview
Schneider National Inc. - Business segments
Schneider National Inc. - Key news
Schneider National Inc. - Key offerings
Schneider National Inc. - Segment focus
SWOT

15.16 Steam Logistics LLC

Steam Logistics LLC - Overview
Steam Logistics LLC - Product / Service
Steam Logistics LLC - Key offerings
SWOT

15.17 Uber Freight

Uber Freight - Overview
Uber Freight - Product / Service
Uber Freight - Key offerings
SWOT

15.18 WWEX Group

WWEX Group - Overview
WWEX Group - Product / Service
WWEX Group - Key offerings
SWOT

16. Appendix

16.1 Scope of the report

Market definition
Objectives
Notes and caveats

16.2 Inclusions and exclusions checklist

Inclusions checklist
Exclusions checklist

16.3 Currency conversion rates for US$

16.4 Research methodology

16.5 Data procurement

Information sources

16.6 Data validation

16.7 Validation techniques employed for market sizing

16.8 Data synthesis

16.9 360 degree market analysis

16.10 List of abbreviations

Research Methodology

Technavio presents a detailed picture of the market by way of study, synthesis, and summation of data from multiple sources. The analysts have presented the various facets of the market with a particular focus on identifying the key industry influencers. The data thus presented is comprehensive, reliable, and the result of extensive research, both primary and secondary.

INFORMATION SOURCES

Primary sources

  • Manufacturers and suppliers
  • Channel partners
  • Industry experts
  • Strategic decision makers

Secondary sources

  • Industry journals and periodicals
  • Government data
  • Financial reports of key industry players
  • Historical data
  • Press releases

DATA ANALYSIS

Data Synthesis

  • Collation of data
  • Estimation of key figures
  • Analysis of derived insights

Data Validation

  • Triangulation with data models
  • Reference against proprietary databases
  • Corroboration with industry experts

REPORT WRITING

Qualitative

  • Market drivers
  • Market challenges
  • Market trends
  • Five forces analysis

Quantitative

  • Market size and forecast
  • Market segmentation
  • Geographical insights
  • Competitive landscape

Interested in this report?

Get your sample now to see our research methodology and insights!

Download Now

Frequently Asked Questions

Freight Brokerage market growth will increase by USD 20132.7 million during 2026-2030.

The Freight Brokerage market is expected to grow at a CAGR of 5.8% during 2026-2030.

Freight Brokerage market is segmented by Service (LTL, FTL, Temperature-controlled freight, Others) Mode of transportation (Road, Inland waterways and coastal shipping, Others) Consumer (B2B, B2C)

ArcBest Corp., Armstrong Transport Group, Arrive Logistics, Atlanta Bonded Warehouse Corp., Blue-Grace Logistics LLC, C H Robinson Worldwide Inc., Echo Global Logistics Inc., England Logistics, Hub Group Inc., Landstar System Inc., MegaCorp Logistics, Mode Global LLC, Priority 1 Inc., Redwood Logistics, RXO Inc., Schneider National Inc., Steam Logistics LLC, Uber Freight, Werner Enterprises Inc., WWEX Group are a few of the key vendors in the Freight Brokerage market.

APAC will register the highest growth rate of 42.3% among the other regions. Therefore, the Freight Brokerage market in APAC is expected to garner significant business opportunities for the vendors during the forecast period.

China, Japan, South Korea, India, Australia, Indonesia, Germany, France, UK, Spain, Italy, The Netherlands, US, Canada, Mexico, UAE, Saudi Arabia, South Africa, Qatar, Turkey, Brazil, Argentina, Chile

  • Presence of FTAs and trade blocs at global level is the driving factor this market.

The Freight Brokerage market vendors should focus on grabbing business opportunities from the Service segment as it accounted for the largest market share in the base year.
RIA - Research AI Assistant
Ask RIA