Digital Key Cabinet Market Size 2025-2029
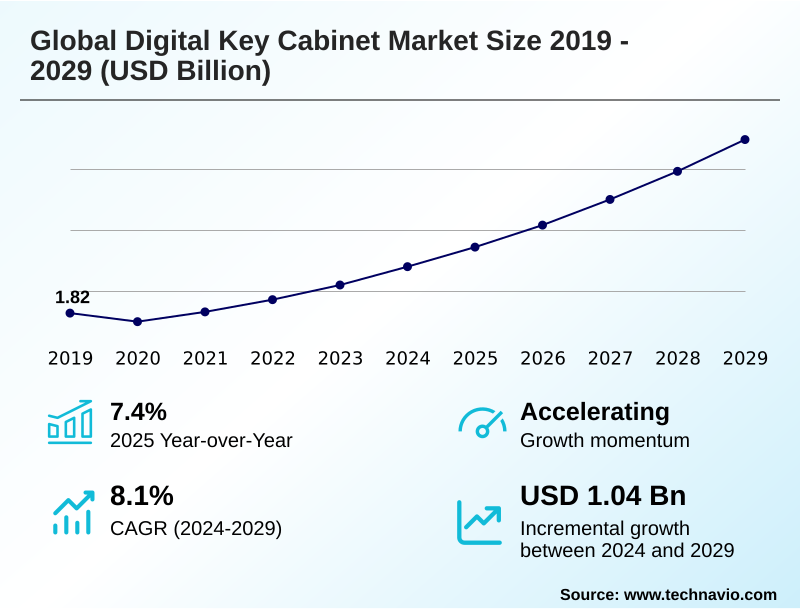
The digital key cabinet market size is valued to increase by USD 1.04 billion, at a CAGR of 8.1% from 2024 to 2029. Heightened security mandates and the mitigation of unauthorized access will drive the digital key cabinet market.
Major Market Trends & Insights
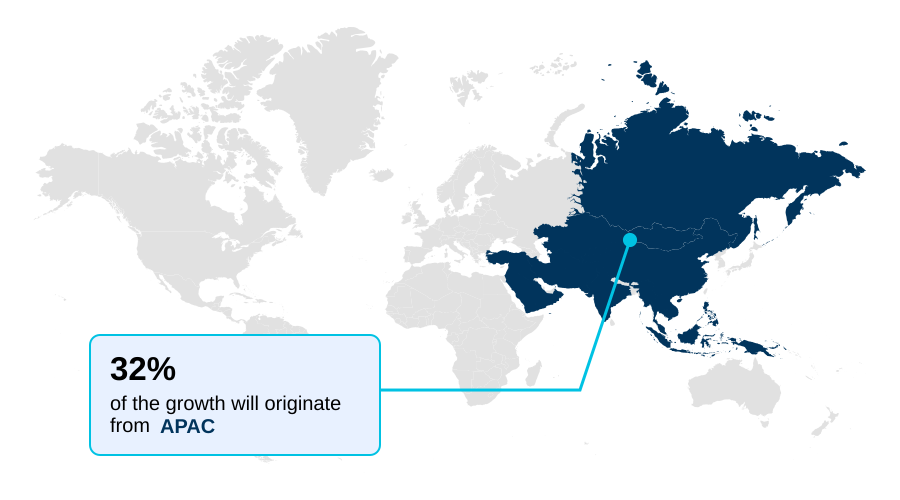
- APAC dominated the market and accounted for a 32.1% growth during the forecast period.
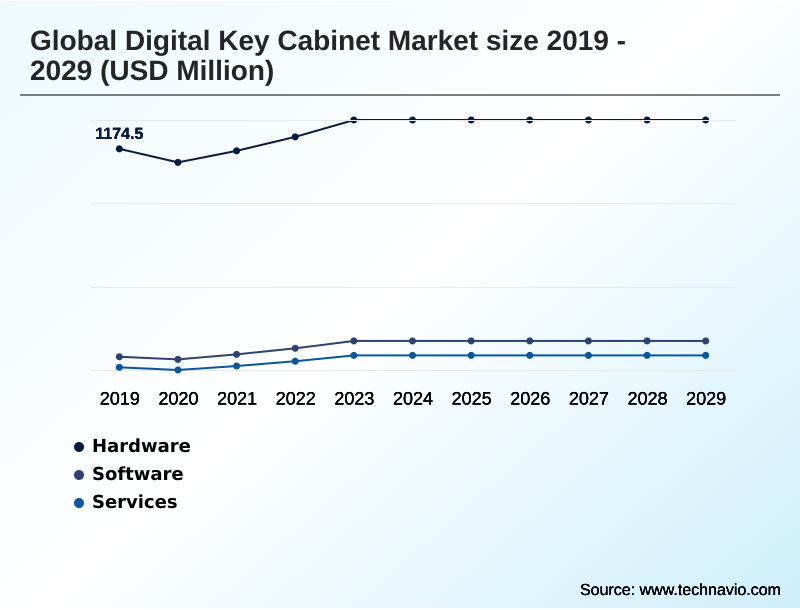
- By Component - Hardware segment was valued at USD 1.29 billion in 2023
- By Application - Commercial segment accounted for the largest market revenue share in 2023
Market Size & Forecast
- Market Opportunities: USD 1.42 billion
- Market Future Opportunities: USD 1.04 billion
- CAGR from 2024 to 2029 : 8.1%
Market Summary
What will be the Size of the Digital Key Cabinet Market during the forecast period?
Get Key Insights on Market Forecast (PDF) Get Free Sample
How is the Digital Key Cabinet Market Segmented?
The digital key cabinet industry research report provides comprehensive data (region-wise segment analysis), with forecasts and estimates in "USD million" for the period 2025-2029, as well as historical data from 2019-2023 for the following segments.
- Component
- Hardware
- Software
- Services
- Application
- Commercial
- Residential
- Government and military
- Capacity
- Up to 50 keys
- Between 51 and 100 keys
- Above 100 keys
- Geography
- North America
- US
- Canada
- Mexico
- APAC
- China
- Japan
- India
- Europe
- Germany
- UK
- France
- Middle East and Africa
- Saudi Arabia
- UAE
- South Africa
- South America
- Brazil
- Argentina
- Rest of World (ROW)
- North America
By Component Insights
The hardware segment is estimated to witness significant growth during the forecast period.
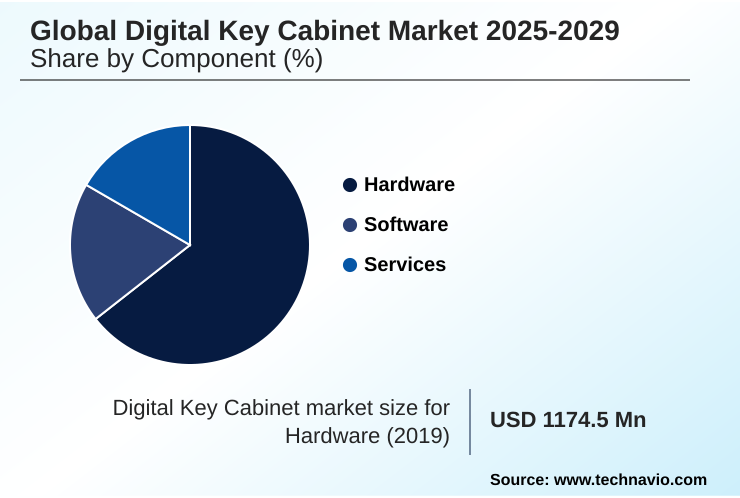
The Hardware segment was valued at USD 1.29 billion in 2023 and showed a gradual increase during the forecast period.
Regional Analysis
APAC is estimated to contribute 32.1% to the growth of the global market during the forecast period.Technavio’s analysts have elaborately explained the regional trends and drivers that shape the market during the forecast period.
See How Digital Key Cabinet Market Demand is Rising in APAC Get Free Sample
Market Dynamics
Our researchers analyzed the data with 2024 as the base year, along with the key drivers, trends, and challenges. A holistic analysis of drivers will help companies refine their marketing strategies to gain a competitive advantage.
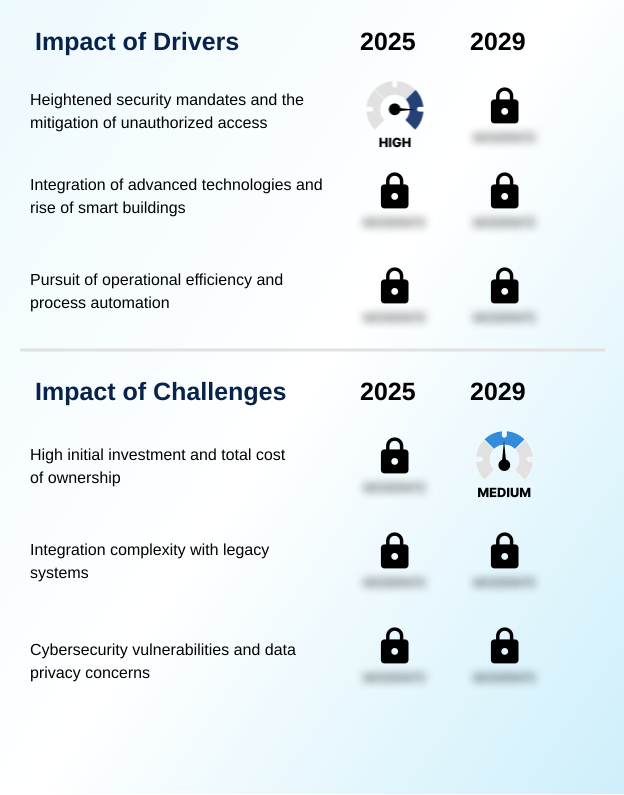
What are the key market drivers leading to the rise in the adoption of Digital Key Cabinet Industry?
What are the market trends shaping the Digital Key Cabinet Industry?
What challenges does the Digital Key Cabinet Industry face during its growth?
Exclusive Technavio Analysis on Customer Landscape
The digital key cabinet market forecasting report includes the adoption lifecycle of the market, covering from the innovator’s stage to the laggard’s stage. It focuses on adoption rates in different regions based on penetration. Furthermore, the digital key cabinet market report also includes key purchase criteria and drivers of price sensitivity to help companies evaluate and develop their market growth analysis strategies.
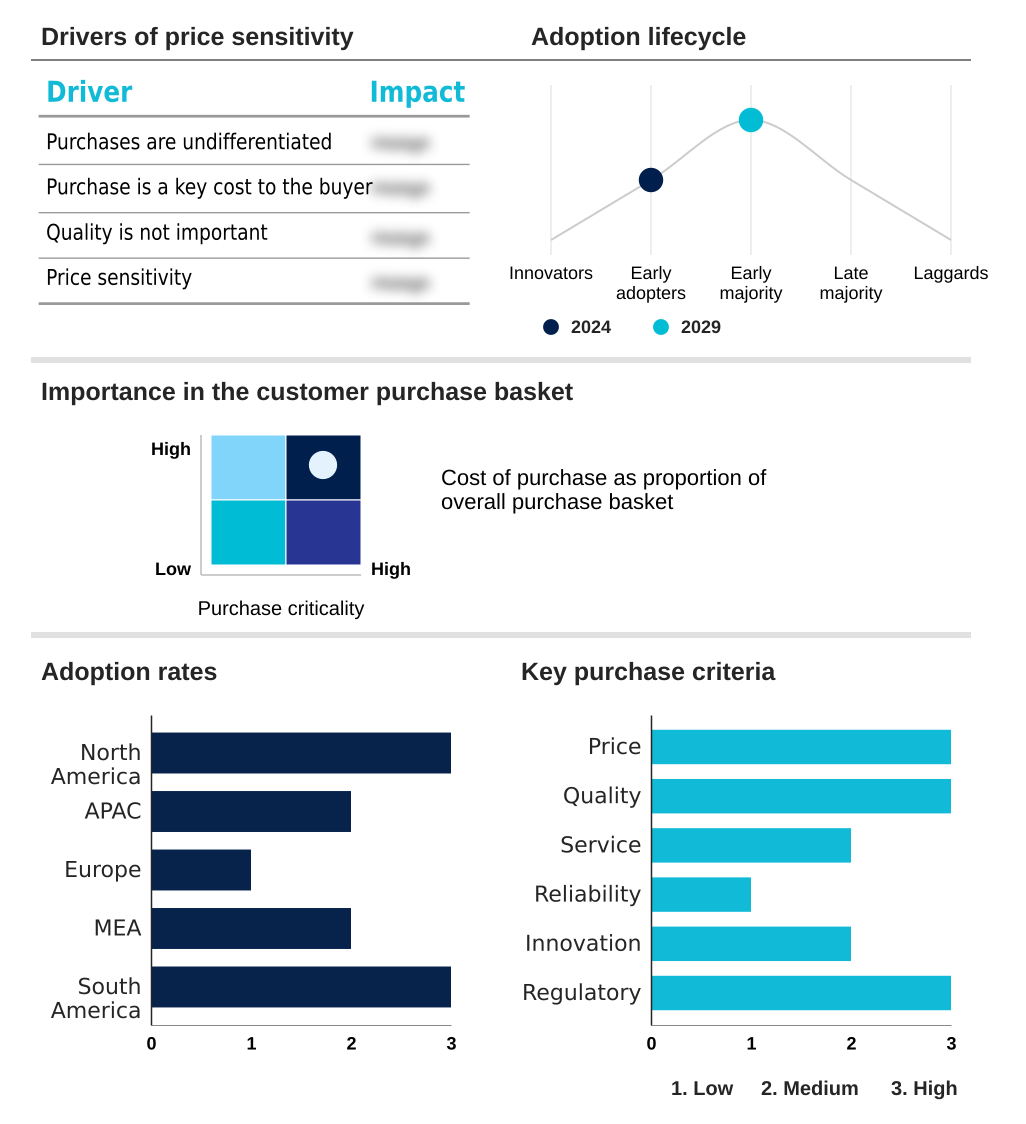
Customer Landscape of Digital Key Cabinet Industry
Competitive Landscape
Companies are implementing various strategies, such as strategic alliances, digital key cabinet market forecast, partnerships, mergers and acquisitions, geographical expansion, and product/service launches, to enhance their presence in the industry.
ASSA ABLOY Global Solutions AB -
The industry research and growth report includes detailed analyses of the competitive landscape of the market and information about key companies, including:
- ASSA ABLOY Global Solutions AB
- Beijing Landwell Electron Tech Co.Ltd
- CIC Technology
- Creone AB
- CyberLock Inc.
- deister electronic GmbH
- Dormakaba Holding AG
- Godrej Enterprises Group
- Gunnebo AB
- Key Systems Inc.
- KeyGuard
- KeyTracker Ltd
- Lund Equipment Co Inc.
- Morse Watchmans Inc.
- Real Time Networks Inc.
- Remsdaq Ltd.
Qualitative and quantitative analysis of companies has been conducted to help clients understand the wider business environment as well as the strengths and weaknesses of key industry players. Data is qualitatively analyzed to categorize companies as pure play, category-focused, industry-focused, and diversified; it is quantitatively analyzed to categorize companies as dominant, leading, strong, tentative, and weak.
Recent Development and News in Digital key cabinet market
Dive into Technavio’s robust research methodology, blending expert interviews, extensive data synthesis, and validated models for unparalleled Digital Key Cabinet Market insights. See full methodology.
| Market Scope | |
|---|---|
| Page number | 285 |
| Base year | 2024 |
| Historic period | 2019-2023 |
| Forecast period | 2025-2029 |
| Growth momentum & CAGR | Accelerate at a CAGR of 8.1% |
| Market growth 2025-2029 | USD 1044.3 million |
| Market structure | Fragmented |
| YoY growth 2024-2025(%) | 7.4% |
| Key countries | US, Canada, Mexico, China, Japan, India, South Korea, Australia, Indonesia, Germany, UK, France, Italy, Spain, The Netherlands, Saudi Arabia, UAE, South Africa, Israel, Turkey, Brazil, Argentina and Chile |
| Competitive landscape | Leading Companies, Market Positioning of Companies, Competitive Strategies, and Industry Risks |
Research Analyst Overview
What are the Key Data Covered in this Digital Key Cabinet Market Research and Growth Report?
-
What is the expected growth of the Digital Key Cabinet Market between 2025 and 2029?
-
USD 1.04 billion, at a CAGR of 8.1%
-
-
What segmentation does the market report cover?
-
The report is segmented by Component (Hardware, Software, and Services), Application (Commercial, Residential, and Government and military), Capacity (Up to 50 keys, Between 51 and 100 keys, and Above 100 keys) and Geography (North America, APAC, Europe, Middle East and Africa, South America)
-
-
Which regions are analyzed in the report?
-
North America, APAC, Europe, Middle East and Africa and South America
-
-
What are the key growth drivers and market challenges?
-
Heightened security mandates and the mitigation of unauthorized access, High initial investment and total cost of ownership
-
-
Who are the major players in the Digital Key Cabinet Market?
-
ASSA ABLOY Global Solutions AB, Beijing Landwell Electron Tech Co.Ltd, CIC Technology, Creone AB, CyberLock Inc., deister electronic GmbH, Dormakaba Holding AG, Godrej Enterprises Group, Gunnebo AB, Key Systems Inc., KeyGuard, KeyTracker Ltd, Lund Equipment Co Inc., Morse Watchmans Inc., Real Time Networks Inc. and Remsdaq Ltd.
-
Market Research Insights
We can help! Our analysts can customize this digital key cabinet market research report to meet your requirements.
 RIA -
RIA - 
