Digital Twin For Buildings Market Analysis, Size, and Forecast 2026-2030: North America (US, Canada, and Mexico), Europe (Germany, UK, and France), APAC (China, Japan, and India), Middle East and Africa (UAE, Saudi Arabia, and South Africa), South America (Brazil, Argentina, and Colombia), and Rest of World (ROW)

Digital Twin For Buildings Market Analysis, Size, and Forecast 2026-2030:
North America (US, Canada, and Mexico), Europe (Germany, UK, and France), APAC (China, Japan, and India), Middle East and Africa (UAE, Saudi Arabia, and South Africa), South America (Brazil, Argentina, and Colombia), and Rest of World (ROW)

Published: May 2026 316 Pages SKU: IRTNTR81492

Market Overview at a Glance

$6.37 B
Market Opportunity
30.7%
CAGR 2025 - 2030
36.3%
North America Growth
$1.29 B
Solutions segment 2024

Digital Twin For Buildings Market Size 2026-2030

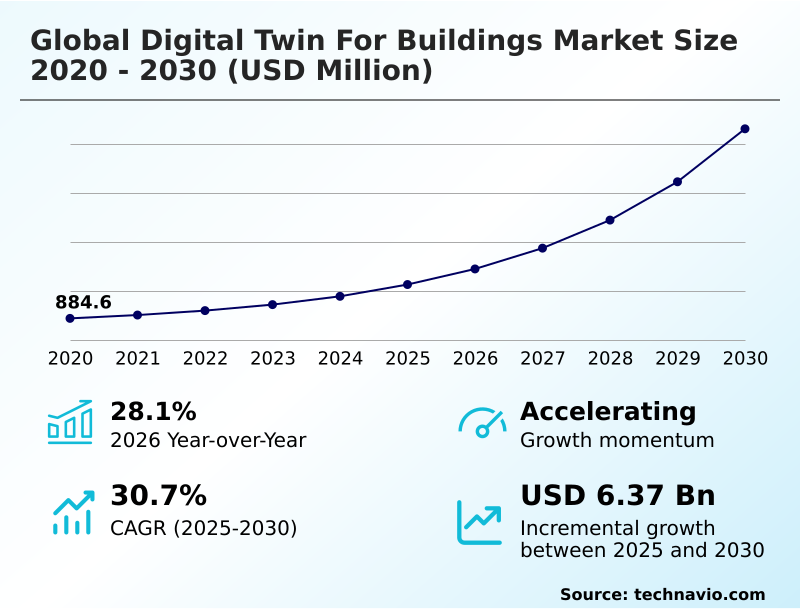
The digital twin for buildings market size is valued to increase by USD 6.37 billion, at a CAGR of 30.7% from 2025 to 2030. Imperative for decarbonization and energy optimization in built environments will drive the digital twin for buildings market.

Major Market Trends & Insights

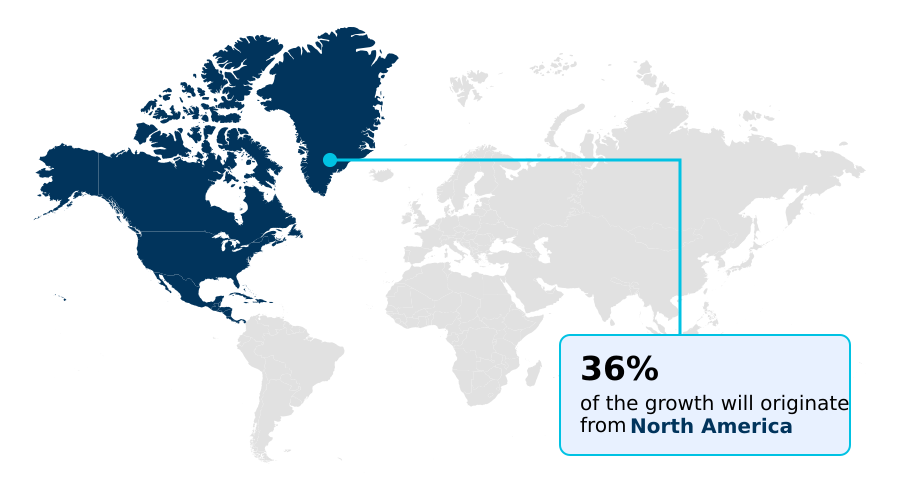
  • North America dominated the market and accounted for a 36.3% growth during the forecast period.
  • By Component - Solutions segment was valued at USD 1.29 billion in 2024
  • By Application - Facility management segment accounted for the largest market revenue share in 2024

Market Size & Forecast

  • Market Opportunities: USD 7.76 billion
  • Market Future Opportunities: USD 6.37 billion
  • CAGR from 2025 to 2030 : 30.7%

Market Summary

  • The Digital Twin For Buildings market functions as a critical enabler of modern asset lifecycle management, synthesizing complex operational data to create dynamic virtual replicas of physical infrastructure. This market fundamentally changes how real estate portfolios are managed by transitioning operators from reactive procedures to advanced condition-based maintenance.
  • In a practical supply chain optimization scenario, facility managers utilize real-time anomaly detection and predictive maintenance algorithms to anticipate HVAC failures, thereby preventing disruptive operational downtime and lowering emergency repair logistics costs. Organizations deploying these spatial computing models experience up to a 25% improvement in overall space utilization efficiency compared to traditional legacy systems.
  • The imperative for carbon footprint reduction acts as a primary driver, as strict environmental regulations compel developers to adopt thermal performance simulation to achieve energy efficiency mandates. Conversely, the persistent lack of cross-disciplinary data integration and standardized interoperability frameworks creates a significant challenge, stalling the deployment of these digital systems across older, fragmented building networks.
  • Real-time structural health monitoring ultimately ensures asset resilience and long-term economic sustainability.

What will be the Size of the Digital Twin For Buildings Market during the forecast period?

Get Key Insights on Market Forecast (PDF) Get Free Sample

How is the Digital Twin For Buildings Market Segmented?

The digital twin for buildings industry research report provides comprehensive data (region-wise segment analysis), with forecasts and estimates in "USD million" for the period 2026-2030, as well as historical data from 2020-2024 for the following segments.

  • Component
    • Solutions
    • Services
  • Application
    • Facility management
    • Predictive maintenance
    • Energy management
    • Space optimization
    • Safety and security monitoring
  • End-user
    • Commercial buildings
    • Industrial buildings
    • Residential buildings
  • Geography
    • North America
      • US
      • Canada
      • Mexico
    • Europe
      • Germany
      • UK
      • France
      • Italy
      • Spain
      • The Netherlands
    • APAC
      • China
      • Japan
      • India
      • South Korea
      • Australia
      • Indonesia
    • Middle East and Africa
      • UAE
      • Saudi Arabia
      • South Africa
      • Turkey
      • Israel
    • South America
      • Brazil
      • Argentina
      • Colombia

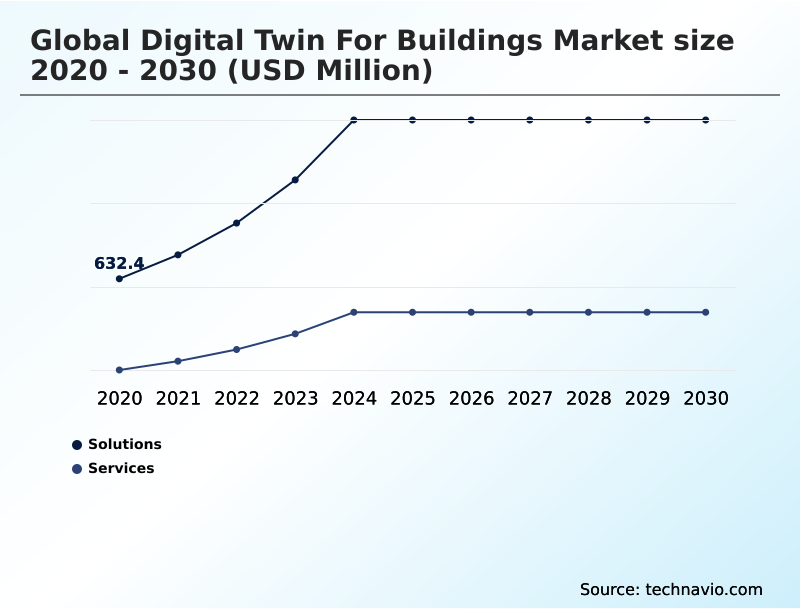
By Component Insights

The solutions segment is estimated to witness significant growth during the forecast period.

The solutions segment provides the foundational framework for the Digital Twin For Buildings market, delivering the technical capability required to create and analyze virtual replicas of physical infrastructure.

This segment incorporates building information modeling, internet of things sensor networks, and advanced predictive maintenance algorithms to optimize facility operations.

By deploying a robust cloud-based architecture, stakeholders can conduct accurate thermal performance simulation and adjust energy consumption forecasting within a risk-free virtual environment.

Real-world implementations show that integrating these systems improves error detection rates by 15%, shifting operations from reactive to condition-based maintenance.

The demand for scalable digital thread connectivity ensures precise structural health monitoring across distributed property portfolios, directly enhancing operational expenditure optimization and extending the lifespan of critical assets.

Get Free Sample

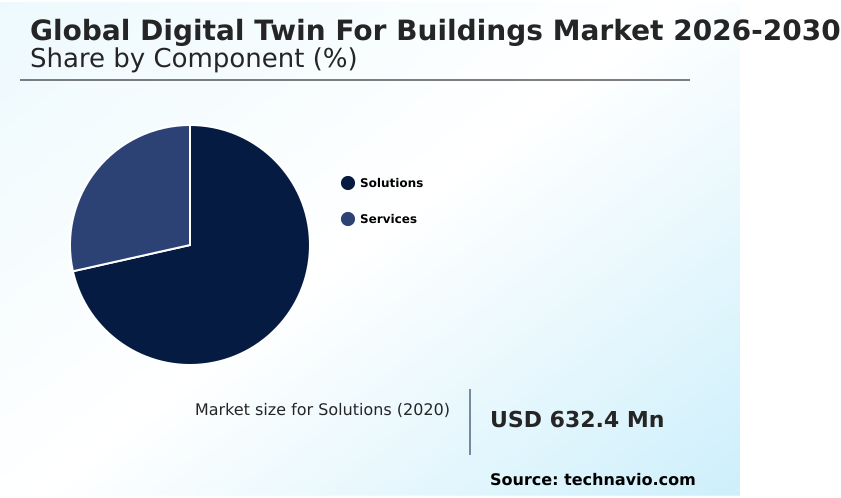
The Solutions segment was valued at USD 1.29 billion in 2024 and showed a gradual increase during the forecast period.

Get Free Sample

Regional Analysis

North America is estimated to contribute 36.3% to the growth of the global market during the forecast period.Technavio’s analysts have elaborately explained the regional trends and drivers that shape the market during the forecast period.

See How Digital Twin For Buildings Market Demand is Rising in North America Get Free Sample

The geographic adoption of the Digital Twin For Buildings market reveals distinct variations driven by regional regulatory mandates and infrastructure maturity.

North America demonstrates advanced integration of edge computing infrastructure, achieving a 36.3% regional incremental growth share due to aggressive commercial legacy system retrofitting.

In contrast, the APAC region exhibits accelerated momentum in new smart district integration, where the focus on urban ecosystem synchronization in high-density developments outpaces North American adoption rates by an estimated 15%.

This rapid scale in APAC reduces implementation costs, enabling broader market penetration. European markets focus heavily on circular economy tracking and materials passports to satisfy stringent environmental social governance directives, improving carbon reporting accuracy by 20%.

These differences highlight how businesses adapt strategies; North America prioritizes efficiency upgrades, while APAC leverages Greenfield construction to embed resilient urban infrastructure directly from the design phase.

Market Dynamics

Our researchers analyzed the data with 2025 as the base year, along with the key drivers, trends, and challenges. A holistic analysis of drivers will help companies refine their marketing strategies to gain a competitive advantage.

  • The evolution of the Digital Twin For Buildings market is fundamentally reshaping how facility managers approach operational resilience and asset longevity. By implementing predictive maintenance for smart buildings, operators can transition from scheduled service routines to dynamic, data-driven interventions that mitigate costly equipment failures.
  • This strategic shift is particularly evident in the deployment of hvac optimization using digital twins, where simulating thermal dynamics allows for precise climate control adjustments based on live occupancy flows. Facilities utilizing these advanced models frequently demonstrate a 30% greater improvement in energy efficiency metrics compared to properties relying solely on traditional building management systems.
  • This significant numerical advantage translates directly into enhanced operational planning, allowing enterprises to reallocate utility savings toward continuous infrastructure upgrades. Building information modeling data integration serves as the foundational architecture for these capabilities, synthesizing disparate data streams into a cohesive, actionable visual dashboard.
  • Furthermore, the integration of real-time structural health monitoring systems ensures that long-term physical degradation is tracked with high precision, safeguarding critical commercial assets against environmental stress. As environmental mandates become more rigorous, the focus on carbon footprint reduction in facilities acts as a critical compliance mechanism for real estate portfolios.
  • Organizations that leverage these interconnected digital models not only streamline their regulatory reporting processes but also establish a verifiable standard for sustainable operations.

What are the key market drivers leading to the rise in the adoption of Digital Twin For Buildings Industry?

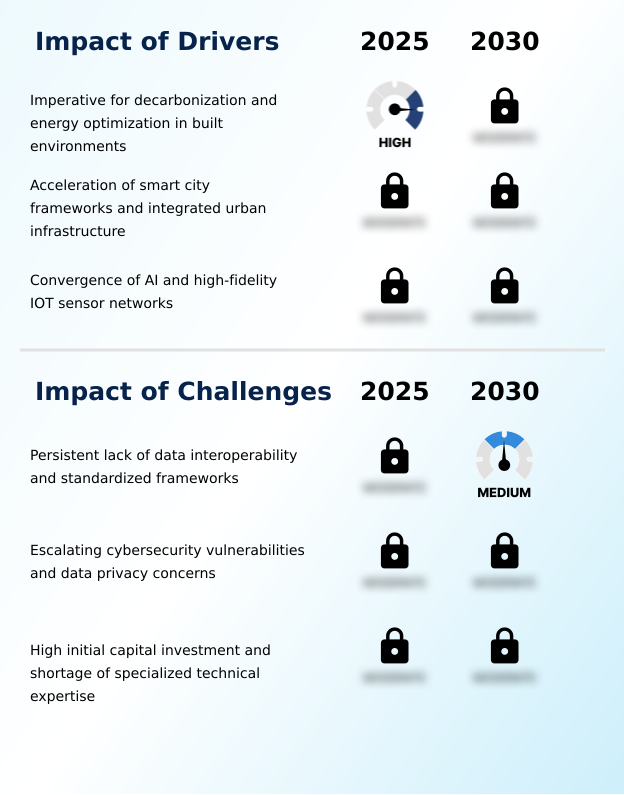
  • The imperative for decarbonization and comprehensive energy optimization in built environments serves as the primary driver propelling the expansion of the market.

  • The imperative for aggressive carbon footprint reduction and stringent environmental compliance serves as the primary catalyst accelerating the Digital Twin For Buildings market.
  • This demand trigger is intensifying because global regulatory bodies now require transparent, verifiable metrics for sustainable operations within any smart building ecosystem.
  • By deploying advanced district-wide energy simulation and energy exchange optimization, property owners can autonomously adjust usage based on live weather and occupancy inputs.
  • Consequently, early adopters utilizing real-time anomaly detection have lowered overall energy use by 15% and reduced unplanned mechanical downtime by 30% compared to conventional building management.
  • Implementing circular economy principles and advanced asset lifecycle management further impacts businesses by preserving raw material value, ultimately enhancing profitability and establishing robust, sustainable operations across dynamic commercial real estate portfolios, including sustainable tourism infrastructure.

What are the market trends shaping the Digital Twin For Buildings Industry?

  • The convergence of artificial intelligence and high-fidelity internet of things sensor networks represents a prominent upcoming trend in the market. This integration enhances real-time data processing and autonomous decision-making capabilities.

  • The Digital Twin For Buildings market is experiencing a profound adoption shift driven by the integration of generative artificial intelligence and extended reality interfaces into standard facility management. This trend occurs because property developers require intuitive access to complex operational data to make rapid decisions without specialized technical training, utilizing real-time data relay.
  • Consequently, businesses deploying these AI-enhanced platforms have seen diagnostic processing speeds improve by 40% compared to traditional manual data extraction. Furthermore, the pivot toward holistic occupant wellness has prompted the adoption of environmental data visualization tools that actively monitor indoor air quality.
  • By mapping physiological data, automated load shedding and indoor climate optimization systems have improved forecast accuracy for energy demand by 18%. This data-driven evolution significantly reduces overhead, supporting post-pandemic workspace fluidity and adapting to fluctuating occupancy densities.

What challenges does the Digital Twin For Buildings Industry face during its growth?

  • A persistent lack of data interoperability and the absence of standardized integration frameworks remain significant challenges restricting the overall growth of the industry.

  • A persistent lack of standardized interoperability protocols and fragmented legacy systems present formidable structural limitations within the Digital Twin For Buildings market. This challenge arises because older facilities rely on proprietary hardware that cannot seamlessly communicate with decentralized edge networks or handle complex cross-disciplinary data integration.
  • As a result, projects suffer delays, often causing deployment costs to exceed initial budgets by over 20% compared to new constructions utilizing spatial computing. Furthermore, escalating cybersecurity vulnerabilities necessitate the implementation of strict zero-trust cybersecurity frameworks to protect sensitive occupancy pattern analytics and high-fidelity 3D visualization data.
  • These security demands impact businesses by significantly increasing initial capital investment, reducing adoption rates among mid-tier property managers by an estimated 25%, and stifling the broader expansion of autonomous facility operations and advanced safety protocols like seismic activity simulation.

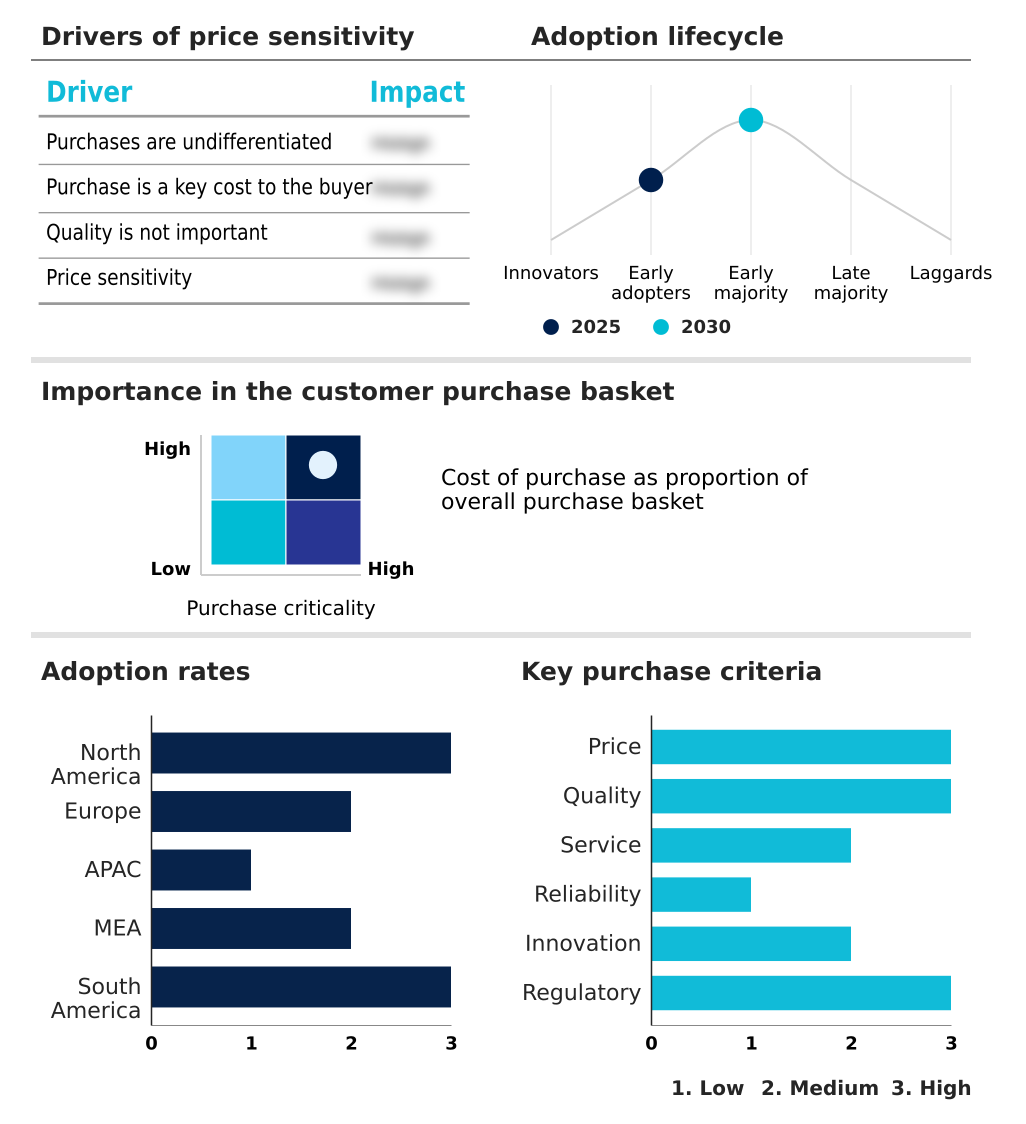
Exclusive Technavio Analysis on Customer Landscape

The digital twin for buildings market forecasting report includes the adoption lifecycle of the market, covering from the innovator’s stage to the laggard’s stage. It focuses on adoption rates in different regions based on penetration. Furthermore, the digital twin for buildings market report also includes key purchase criteria and drivers of price sensitivity to help companies evaluate and develop their market growth analysis strategies.

Customer Landscape of Digital Twin For Buildings Industry

Competitive Landscape

Companies are implementing various strategies, such as strategic alliances, digital twin for buildings market forecast, partnerships, mergers and acquisitions, geographical expansion, and product/service launches, to enhance their presence in the industry.

ABB Ltd. - The digital twin for buildings solutions include advanced building analyzers, energy management platforms, and smart automation systems designed to optimize structural efficiency and streamline real-time asset monitoring capabilities.

The industry research and growth report includes detailed analyses of the competitive landscape of the market and information about key companies, including:

  • ABB Ltd.
  • Autodesk Inc.
  • Bentley Systems Inc.
  • Dassault Systemes SE
  • Honeywell International Inc.
  • Huawei Technologies Co. Ltd.
  • IBM Corp.
  • Integrated Environmental Ltd.
  • Johnson Controls International
  • KODE Labs Inc.
  • Matterport Inc.
  • Microsoft Corp.
  • Nemetschek SE
  • Oracle Corp.
  • Planon Group
  • SAP SE
  • Schneider Electric SE
  • Siemens AG
  • Trimble Inc.
  • Willow Technology Corporation.

Qualitative and quantitative analysis of companies has been conducted to help clients understand the wider business environment as well as the strengths and weaknesses of key industry players. Data is qualitatively analyzed to categorize companies as pure play, category-focused, industry-focused, and diversified; it is quantitatively analyzed to categorize companies as dominant, leading, strong, tentative, and weak.

Recent Development and News in Digital twin for buildings market

  • In the IT Consulting and Other Services industry, the rapid deployment of decentralized edge networks has shifted computational loads closer to physical assets, directly impacting Digital Twin For Buildings demand by enabling sub-millisecond real-time data relay for autonomous facility operations.
  • The standardization of workflow interoperability protocols across cloud-based architecture delivery models has eliminated legacy system integration barriers, improving data-driven strategic planning and driving adoption of comprehensive asset lifecycle management platforms.
  • Strict enforcement of data privacy regulations such as GDPR has forced enterprise automation vendors to implement zero-trust cybersecurity architectures, thereby reshaping how high-fidelity 3D visualization and occupancy pattern analytics are securely delivered to commercial property managers.
  • Escalating corporate commitments to environmental social governance reporting have accelerated the adoption of AI infrastructure for carbon footprint reduction, directly increasing the utilization of thermal performance simulation and HVAC optimization within smart building ecosystems.

Dive into Technavio’s robust research methodology, blending expert interviews, extensive data synthesis, and validated models for unparalleled Digital Twin For Buildings Market insights. See full methodology.

Market Scope
Page number 316
Base year 2025
Historic period 2020-2024
Forecast period 2026-2030
Growth momentum & CAGR Accelerate at a CAGR of 30.7%
Market growth 2026-2030 USD 6370.3 million
Market structure Fragmented
YoY growth 2025-2026(%) 28.1%
Key countries US, Canada, Mexico, Germany, UK, France, Italy, Spain, The Netherlands, China, Japan, India, South Korea, Australia, Indonesia, UAE, Saudi Arabia, South Africa, Turkey, Israel, Brazil, Argentina and Colombia
Competitive landscape Leading Companies, Market Positioning of Companies, Competitive Strategies, and Industry Risks

Request Free Sample

Research Analyst Overview

  • The Digital Twin For Buildings market continuously evolves as a pivotal mechanism for aligning real estate management with rigorous compliance and corporate sustainability mandates. The integration of generative artificial intelligence with internet of things sensor networks allows executives to conduct precise energy consumption forecasting and dynamic scenario planning.
  • This transition directly impacts boardroom-level strategic decision-making, particularly concerning compliance with strict environmental regulations and capital expenditure allocation. By implementing these digital building logbook frameworks, companies have achieved a 30% reduction in processing time for regulatory carbon reporting compared to manual auditing methods.
  • High-fidelity 3D visualization and spatial computing empower decision-makers to seamlessly manage district-wide energy simulation, ensuring optimal resource distribution across large property portfolios. Furthermore, the proactive utilization of predictive maintenance algorithms translates raw sensor data into actionable insights, driving substantial improvements in sustainable tourism infrastructure and commercial asset longevity.
  • Decentralized edge networks facilitate rapid, localized data processing, enhancing the security and responsiveness of autonomous facility operations. Ultimately, these advanced digital replicas transform static properties into intelligent, responsive environments.

What are the Key Data Covered in this Digital Twin For Buildings Market Research and Growth Report?

  • What is the expected growth of the Digital Twin For Buildings Market between 2026 and 2030?

    • USD 6.37 billion, at a CAGR of 30.7%

  • What segmentation does the market report cover?

    • The report is segmented by Component (Solutions, and Services), Application (Facility management, Predictive maintenance, Energy management, Space optimization, and Safety and security monitoring), End-user (Commercial buildings, Industrial buildings, and Residential buildings) and Geography (North America, Europe, APAC, Middle East and Africa, South America)

  • Which regions are analyzed in the report?

    • North America, Europe, APAC, Middle East and Africa and South America

  • What are the key growth drivers and market challenges?

    • Imperative for decarbonization and energy optimization in built environments, Persistent lack of data interoperability and standardized frameworks

  • Who are the major players in the Digital Twin For Buildings Market?

    • ABB Ltd., Autodesk Inc., Bentley Systems Inc., Dassault Systemes SE, Honeywell International Inc., Huawei Technologies Co. Ltd., IBM Corp., Integrated Environmental Ltd., Johnson Controls International, KODE Labs Inc., Matterport Inc., Microsoft Corp., Nemetschek SE, Oracle Corp., Planon Group, SAP SE, Schneider Electric SE, Siemens AG, Trimble Inc. and Willow Technology Corporation.

Market Research Insights

  • The Digital Twin For Buildings market fundamentally reorganizes facility management platforms by converging physical infrastructure with dynamic digital replicas. Organizations leveraging a comprehensive smart building ecosystem achieve a 25% improvement in operational expenditure optimization compared to legacy operational models. By utilizing real-time anomaly detection, commercial asset managers reduce unplanned equipment downtime by an estimated 30%, directly enhancing continuous operational reliability.
  • Furthermore, the integration of holistic occupant wellness tracking and indoor climate optimization increases space utilization efficiency by 18%, allowing businesses to adapt rapidly to post-pandemic workspace fluidity. These measurable outcomes demonstrate how data-driven strategic planning effectively aligns real estate portfolios with stringent environmental standards, ensuring asset profitability and compliance without relying on manual oversight.

We can help! Our analysts can customize this digital twin for buildings market research report to meet your requirements.

Get in touch

1. Executive Summary

1.1 Market overview

Executive Summary - Chart on Market Overview
Executive Summary - Data Table on Market Overview
Executive Summary - Chart on Global Market Characteristics
Executive Summary - Chart on Market by Geography
Executive Summary - Chart on Market Segmentation by Component
Executive Summary - Chart on Market Segmentation by Application
Executive Summary - Chart on Market Segmentation by End-user
Executive Summary - Chart on Incremental Growth
Executive Summary - Data Table on Incremental Growth
Executive Summary - Chart on Company Market Positioning

2. Technavio Analysis

2.1 Analysis of price sensitivity, lifecycle, customer purchase basket, adoption rates, and purchase criteria

2.2 Criticality of inputs and Factors of differentiation

Chart on Overview on criticality of inputs and factors of differentiation

2.3 Factors of disruption

Chart on Overview on factors of disruption

2.4 Impact of drivers and challenges

Chart on Impact of drivers and challenges in 2025 and 2030

3. Market Landscape

3.1 Market ecosystem

Chart on Parent Market
Data Table on - Parent Market

3.2 Market characteristics

Chart on Market characteristics analysis

3.3 Value chain analysis

Chart on Value chain analysis

4. Market Sizing

4.1 Market definition

Data Table on Offerings of companies included in the market definition

4.2 Market segment analysis

Market segments

4.3 Market size 2025

4.4 Market outlook: Forecast for 2025-2030

Chart on Global - Market size and forecast 2025-2030 ($ million)
Data Table on Global - Market size and forecast 2025-2030 ($ million)
Chart on Global Market: Year-over-year growth 2025-2030 (%)
Data Table on Global Market: Year-over-year growth 2025-2030 (%)

5. Historic Market Size

5.1 Global Digital Twin For Buildings Market 2020 - 2024

Historic Market Size - Data Table on Global Digital Twin For Buildings Market 2020 - 2024 ($ million)

5.2 Component segment analysis 2020 - 2024

Historic Market Size - Component Segment 2020 - 2024 ($ million)

5.3 Application segment analysis 2020 - 2024

Historic Market Size - Application Segment 2020 - 2024 ($ million)

5.4 End-user segment analysis 2020 - 2024

Historic Market Size - End-user Segment 2020 - 2024 ($ million)

5.5 Geography segment analysis 2020 - 2024

Historic Market Size - Geography Segment 2020 - 2024 ($ million)

5.6 Country segment analysis 2020 - 2024

Historic Market Size - Country Segment 2020 - 2024 ($ million)

6. Qualitative Analysis

6.1 Impact of AI on Global Digital Twin for Buildings Market

6.2 Impact of geopolitical conflicts on Global Digital Twin for Buildings Market

7. Five Forces Analysis

7.1 Five forces summary

Five forces analysis - Comparison between 2025 and 2030

7.2 Bargaining power of buyers

Bargaining power of buyers - Impact of key factors 2025 and 2030

7.3 Bargaining power of suppliers

Bargaining power of suppliers - Impact of key factors in 2025 and 2030

7.4 Threat of new entrants

Threat of new entrants - Impact of key factors in 2025 and 2030

7.5 Threat of substitutes

Threat of substitutes - Impact of key factors in 2025 and 2030

7.6 Threat of rivalry

Threat of rivalry - Impact of key factors in 2025 and 2030

7.7 Market condition

Chart on Market condition - Five forces 2025 and 2030

8. Market Segmentation by Component

8.1 Market segments

Chart on Component - Market share 2025-2030 (%)
Data Table on Component - Market share 2025-2030 (%)

8.2 Comparison by Component

Chart on Comparison by Component
Data Table on Comparison by Component

8.3 Solutions - Market size and forecast 2025-2030

Chart on Solutions - Market size and forecast 2025-2030 ($ million)
Data Table on Solutions - Market size and forecast 2025-2030 ($ million)
Chart on Solutions - Year-over-year growth 2025-2030 (%)
Data Table on Solutions - Year-over-year growth 2025-2030 (%)

8.4 Services - Market size and forecast 2025-2030

Chart on Services - Market size and forecast 2025-2030 ($ million)
Data Table on Services - Market size and forecast 2025-2030 ($ million)
Chart on Services - Year-over-year growth 2025-2030 (%)
Data Table on Services - Year-over-year growth 2025-2030 (%)

8.5 Market opportunity by Component

Market opportunity by Component ($ million)
Data Table on Market opportunity by Component ($ million)

9. Market Segmentation by Application

9.1 Market segments

Chart on Application - Market share 2025-2030 (%)
Data Table on Application - Market share 2025-2030 (%)

9.2 Comparison by Application

Chart on Comparison by Application
Data Table on Comparison by Application

9.3 Facility management - Market size and forecast 2025-2030

Chart on Facility management - Market size and forecast 2025-2030 ($ million)
Data Table on Facility management - Market size and forecast 2025-2030 ($ million)
Chart on Facility management - Year-over-year growth 2025-2030 (%)
Data Table on Facility management - Year-over-year growth 2025-2030 (%)

9.4 Predictive maintenance - Market size and forecast 2025-2030

Chart on Predictive maintenance - Market size and forecast 2025-2030 ($ million)
Data Table on Predictive maintenance - Market size and forecast 2025-2030 ($ million)
Chart on Predictive maintenance - Year-over-year growth 2025-2030 (%)
Data Table on Predictive maintenance - Year-over-year growth 2025-2030 (%)

9.5 Energy management - Market size and forecast 2025-2030

Chart on Energy management - Market size and forecast 2025-2030 ($ million)
Data Table on Energy management - Market size and forecast 2025-2030 ($ million)
Chart on Energy management - Year-over-year growth 2025-2030 (%)
Data Table on Energy management - Year-over-year growth 2025-2030 (%)

9.6 Space optimization - Market size and forecast 2025-2030

Chart on Space optimization - Market size and forecast 2025-2030 ($ million)
Data Table on Space optimization - Market size and forecast 2025-2030 ($ million)
Chart on Space optimization - Year-over-year growth 2025-2030 (%)
Data Table on Space optimization - Year-over-year growth 2025-2030 (%)

9.7 Safety and security monitoring - Market size and forecast 2025-2030

Chart on Safety and security monitoring - Market size and forecast 2025-2030 ($ million)
Data Table on Safety and security monitoring - Market size and forecast 2025-2030 ($ million)
Chart on Safety and security monitoring - Year-over-year growth 2025-2030 (%)
Data Table on Safety and security monitoring - Year-over-year growth 2025-2030 (%)

9.8 Market opportunity by Application

Market opportunity by Application ($ million)
Data Table on Market opportunity by Application ($ million)

10. Market Segmentation by End-user

10.1 Market segments

Chart on End-user - Market share 2025-2030 (%)
Data Table on End-user - Market share 2025-2030 (%)

10.2 Comparison by End-user

Chart on Comparison by End-user
Data Table on Comparison by End-user

10.3 Commercial buildings - Market size and forecast 2025-2030

Chart on Commercial buildings - Market size and forecast 2025-2030 ($ million)
Data Table on Commercial buildings - Market size and forecast 2025-2030 ($ million)
Chart on Commercial buildings - Year-over-year growth 2025-2030 (%)
Data Table on Commercial buildings - Year-over-year growth 2025-2030 (%)

10.4 Industrial buildings - Market size and forecast 2025-2030

Chart on Industrial buildings - Market size and forecast 2025-2030 ($ million)
Data Table on Industrial buildings - Market size and forecast 2025-2030 ($ million)
Chart on Industrial buildings - Year-over-year growth 2025-2030 (%)
Data Table on Industrial buildings - Year-over-year growth 2025-2030 (%)

10.5 Residential buildings - Market size and forecast 2025-2030

Chart on Residential buildings - Market size and forecast 2025-2030 ($ million)
Data Table on Residential buildings - Market size and forecast 2025-2030 ($ million)
Chart on Residential buildings - Year-over-year growth 2025-2030 (%)
Data Table on Residential buildings - Year-over-year growth 2025-2030 (%)

10.6 Market opportunity by End-user

Market opportunity by End-user ($ million)
Data Table on Market opportunity by End-user ($ million)

11. Customer Landscape

11.1 Customer landscape overview

Analysis of price sensitivity, lifecycle, customer purchase basket, adoption rates, and purchase criteria

12. Geographic Landscape

12.1 Geographic segmentation

Chart on Market share by geography 2025-2030 (%)
Data Table on Market share by geography 2025-2030 (%)

12.2 Geographic comparison

Chart on Geographic comparison
Data Table on Geographic comparison

12.3 North America - Market size and forecast 2025-2030

Chart on North America - Market size and forecast 2025-2030 ($ million)
Data Table on North America - Market size and forecast 2025-2030 ($ million)
Chart on North America - Year-over-year growth 2025-2030 (%)
Data Table on North America - Year-over-year growth 2025-2030 (%)
Chart on Regional Comparison - North America
Data Table on Regional Comparison - North America

12.3.1 US - Market size and forecast 2025-2030

Chart on US - Market size and forecast 2025-2030 ($ million)
Data Table on US - Market size and forecast 2025-2030 ($ million)
Chart on US - Year-over-year growth 2025-2030 (%)
Data Table on US - Year-over-year growth 2025-2030 (%)

12.3.2 Canada - Market size and forecast 2025-2030

Chart on Canada - Market size and forecast 2025-2030 ($ million)
Data Table on Canada - Market size and forecast 2025-2030 ($ million)
Chart on Canada - Year-over-year growth 2025-2030 (%)
Data Table on Canada - Year-over-year growth 2025-2030 (%)

12.3.3 Mexico - Market size and forecast 2025-2030

Chart on Mexico - Market size and forecast 2025-2030 ($ million)
Data Table on Mexico - Market size and forecast 2025-2030 ($ million)
Chart on Mexico - Year-over-year growth 2025-2030 (%)
Data Table on Mexico - Year-over-year growth 2025-2030 (%)

12.4 Europe - Market size and forecast 2025-2030

Chart on Europe - Market size and forecast 2025-2030 ($ million)
Data Table on Europe - Market size and forecast 2025-2030 ($ million)
Chart on Europe - Year-over-year growth 2025-2030 (%)
Data Table on Europe - Year-over-year growth 2025-2030 (%)
Chart on Regional Comparison - Europe
Data Table on Regional Comparison - Europe

12.4.1 Germany - Market size and forecast 2025-2030

Chart on Germany - Market size and forecast 2025-2030 ($ million)
Data Table on Germany - Market size and forecast 2025-2030 ($ million)
Chart on Germany - Year-over-year growth 2025-2030 (%)
Data Table on Germany - Year-over-year growth 2025-2030 (%)

12.4.2 UK - Market size and forecast 2025-2030

Chart on UK - Market size and forecast 2025-2030 ($ million)
Data Table on UK - Market size and forecast 2025-2030 ($ million)
Chart on UK - Year-over-year growth 2025-2030 (%)
Data Table on UK - Year-over-year growth 2025-2030 (%)

12.4.3 France - Market size and forecast 2025-2030

Chart on France - Market size and forecast 2025-2030 ($ million)
Data Table on France - Market size and forecast 2025-2030 ($ million)
Chart on France - Year-over-year growth 2025-2030 (%)
Data Table on France - Year-over-year growth 2025-2030 (%)

12.4.4 Italy - Market size and forecast 2025-2030

Chart on Italy - Market size and forecast 2025-2030 ($ million)
Data Table on Italy - Market size and forecast 2025-2030 ($ million)
Chart on Italy - Year-over-year growth 2025-2030 (%)
Data Table on Italy - Year-over-year growth 2025-2030 (%)

12.4.5 Spain - Market size and forecast 2025-2030

Chart on Spain - Market size and forecast 2025-2030 ($ million)
Data Table on Spain - Market size and forecast 2025-2030 ($ million)
Chart on Spain - Year-over-year growth 2025-2030 (%)
Data Table on Spain - Year-over-year growth 2025-2030 (%)

12.4.6 The Netherlands - Market size and forecast 2025-2030

Chart on The Netherlands - Market size and forecast 2025-2030 ($ million)
Data Table on The Netherlands - Market size and forecast 2025-2030 ($ million)
Chart on The Netherlands - Year-over-year growth 2025-2030 (%)
Data Table on The Netherlands - Year-over-year growth 2025-2030 (%)

12.5 APAC - Market size and forecast 2025-2030

Chart on APAC - Market size and forecast 2025-2030 ($ million)
Data Table on APAC - Market size and forecast 2025-2030 ($ million)
Chart on APAC - Year-over-year growth 2025-2030 (%)
Data Table on APAC - Year-over-year growth 2025-2030 (%)
Chart on Regional Comparison - APAC
Data Table on Regional Comparison - APAC

12.5.1 China - Market size and forecast 2025-2030

Chart on China - Market size and forecast 2025-2030 ($ million)
Data Table on China - Market size and forecast 2025-2030 ($ million)
Chart on China - Year-over-year growth 2025-2030 (%)
Data Table on China - Year-over-year growth 2025-2030 (%)

12.5.2 Japan - Market size and forecast 2025-2030

Chart on Japan - Market size and forecast 2025-2030 ($ million)
Data Table on Japan - Market size and forecast 2025-2030 ($ million)
Chart on Japan - Year-over-year growth 2025-2030 (%)
Data Table on Japan - Year-over-year growth 2025-2030 (%)

12.5.3 India - Market size and forecast 2025-2030

Chart on India - Market size and forecast 2025-2030 ($ million)
Data Table on India - Market size and forecast 2025-2030 ($ million)
Chart on India - Year-over-year growth 2025-2030 (%)
Data Table on India - Year-over-year growth 2025-2030 (%)

12.5.4 South Korea - Market size and forecast 2025-2030

Chart on South Korea - Market size and forecast 2025-2030 ($ million)
Data Table on South Korea - Market size and forecast 2025-2030 ($ million)
Chart on South Korea - Year-over-year growth 2025-2030 (%)
Data Table on South Korea - Year-over-year growth 2025-2030 (%)

12.5.5 Australia - Market size and forecast 2025-2030

Chart on Australia - Market size and forecast 2025-2030 ($ million)
Data Table on Australia - Market size and forecast 2025-2030 ($ million)
Chart on Australia - Year-over-year growth 2025-2030 (%)
Data Table on Australia - Year-over-year growth 2025-2030 (%)

12.5.6 Indonesia - Market size and forecast 2025-2030

Chart on Indonesia - Market size and forecast 2025-2030 ($ million)
Data Table on Indonesia - Market size and forecast 2025-2030 ($ million)
Chart on Indonesia - Year-over-year growth 2025-2030 (%)
Data Table on Indonesia - Year-over-year growth 2025-2030 (%)

12.6 Middle East and Africa - Market size and forecast 2025-2030

Chart on Middle East and Africa - Market size and forecast 2025-2030 ($ million)
Data Table on Middle East and Africa - Market size and forecast 2025-2030 ($ million)
Chart on Middle East and Africa - Year-over-year growth 2025-2030 (%)
Data Table on Middle East and Africa - Year-over-year growth 2025-2030 (%)
Chart on Regional Comparison - Middle East and Africa
Data Table on Regional Comparison - Middle East and Africa

12.6.1 UAE - Market size and forecast 2025-2030

Chart on UAE - Market size and forecast 2025-2030 ($ million)
Data Table on UAE - Market size and forecast 2025-2030 ($ million)
Chart on UAE - Year-over-year growth 2025-2030 (%)
Data Table on UAE - Year-over-year growth 2025-2030 (%)

12.6.2 Saudi Arabia - Market size and forecast 2025-2030

Chart on Saudi Arabia - Market size and forecast 2025-2030 ($ million)
Data Table on Saudi Arabia - Market size and forecast 2025-2030 ($ million)
Chart on Saudi Arabia - Year-over-year growth 2025-2030 (%)
Data Table on Saudi Arabia - Year-over-year growth 2025-2030 (%)

12.6.3 South Africa - Market size and forecast 2025-2030

Chart on South Africa - Market size and forecast 2025-2030 ($ million)
Data Table on South Africa - Market size and forecast 2025-2030 ($ million)
Chart on South Africa - Year-over-year growth 2025-2030 (%)
Data Table on South Africa - Year-over-year growth 2025-2030 (%)

12.6.4 Turkey - Market size and forecast 2025-2030

Chart on Turkey - Market size and forecast 2025-2030 ($ million)
Data Table on Turkey - Market size and forecast 2025-2030 ($ million)
Chart on Turkey - Year-over-year growth 2025-2030 (%)
Data Table on Turkey - Year-over-year growth 2025-2030 (%)

12.6.5 Israel - Market size and forecast 2025-2030

Chart on Israel - Market size and forecast 2025-2030 ($ million)
Data Table on Israel - Market size and forecast 2025-2030 ($ million)
Chart on Israel - Year-over-year growth 2025-2030 (%)
Data Table on Israel - Year-over-year growth 2025-2030 (%)

12.7 South America - Market size and forecast 2025-2030

Chart on South America - Market size and forecast 2025-2030 ($ million)
Data Table on South America - Market size and forecast 2025-2030 ($ million)
Chart on South America - Year-over-year growth 2025-2030 (%)
Data Table on South America - Year-over-year growth 2025-2030 (%)
Chart on Regional Comparison - South America
Data Table on Regional Comparison - South America

12.7.1 Brazil - Market size and forecast 2025-2030

Chart on Brazil - Market size and forecast 2025-2030 ($ million)
Data Table on Brazil - Market size and forecast 2025-2030 ($ million)
Chart on Brazil - Year-over-year growth 2025-2030 (%)
Data Table on Brazil - Year-over-year growth 2025-2030 (%)

12.7.2 Argentina - Market size and forecast 2025-2030

Chart on Argentina - Market size and forecast 2025-2030 ($ million)
Data Table on Argentina - Market size and forecast 2025-2030 ($ million)
Chart on Argentina - Year-over-year growth 2025-2030 (%)
Data Table on Argentina - Year-over-year growth 2025-2030 (%)

12.7.3 Colombia - Market size and forecast 2025-2030

Chart on Colombia - Market size and forecast 2025-2030 ($ million)
Data Table on Colombia - Market size and forecast 2025-2030 ($ million)
Chart on Colombia - Year-over-year growth 2025-2030 (%)
Data Table on Colombia - Year-over-year growth 2025-2030 (%)

12.8 Market opportunity by geography

Market opportunity by geography ($ million)
Data Tables on Market opportunity by geography ($ million)

13. Drivers, Challenges, and Opportunity

13.1 Market drivers

Imperative for decarbonization and energy optimization in built environments
Acceleration of smart city frameworks and integrated urban infrastructure
Convergence of AI and high-fidelity IOT sensor networks

13.2 Market challenges

Persistent lack of data interoperability and standardized frameworks
Escalating cybersecurity vulnerabilities and data privacy concerns
High initial capital investment and shortage of specialized technical expertise

13.3 Impact of drivers and challenges

Impact of drivers and challenges in 2025 and 2030

13.4 Market opportunities

Convergence of artificial intelligence and high-fidelity internet of things sensor networks
Expansion of human-centric design and holistic occupant wellness monitoring
Adoption of materials passports and circular economy principles in construction

14. Competitive Landscape

14.1 Overview

14.2

Overview on criticality of inputs and factors of differentiation

14.3 Landscape disruption

Overview on factors of disruption

14.4 Industry risks

Impact of key risks on business

15. Competitive Analysis

15.1 Companies profiled

Companies covered

15.2 Company ranking index

15.3 Market positioning of companies

Matrix on companies position and classification

15.4 ABB Ltd.

ABB Ltd. - Overview
ABB Ltd. - Business segments
ABB Ltd. - Key news
ABB Ltd. - Key offerings
ABB Ltd. - Segment focus
SWOT

15.5 Autodesk Inc.

Autodesk Inc. - Overview
Autodesk Inc. - Business segments
Autodesk Inc. - Key offerings
Autodesk Inc. - Segment focus
SWOT

15.6 Bentley Systems Inc.

Bentley Systems Inc. - Overview
Bentley Systems Inc. - Business segments
Bentley Systems Inc. - Key offerings
Bentley Systems Inc. - Segment focus
SWOT

15.7 Dassault Systemes SE

Dassault Systemes SE - Overview
Dassault Systemes SE - Business segments
Dassault Systemes SE - Key offerings
Dassault Systemes SE - Segment focus
SWOT

15.8 Honeywell International Inc.

Honeywell International Inc. - Overview
Honeywell International Inc. - Business segments
Honeywell International Inc. - Key news
Honeywell International Inc. - Key offerings
Honeywell International Inc. - Segment focus
SWOT

15.9 Huawei Technologies Co. Ltd.

Huawei Technologies Co. Ltd. - Overview
Huawei Technologies Co. Ltd. - Product / Service
Huawei Technologies Co. Ltd. - Key offerings
SWOT

15.10 IBM Corp.

IBM Corp. - Overview
IBM Corp. - Business segments
IBM Corp. - Key news
IBM Corp. - Key offerings
IBM Corp. - Segment focus
SWOT

15.11 Johnson Controls International

Johnson Controls International - Overview
Johnson Controls International - Business segments
Johnson Controls International - Key news
Johnson Controls International - Key offerings
Johnson Controls International - Segment focus
SWOT

15.12 Matterport Inc.

Matterport Inc. - Overview
Matterport Inc. - Product / Service
Matterport Inc. - Key offerings
SWOT

15.13 Microsoft Corp.

Microsoft Corp. - Overview
Microsoft Corp. - Business segments
Microsoft Corp. - Key news
Microsoft Corp. - Key offerings
Microsoft Corp. - Segment focus
SWOT

15.14 Nemetschek SE

Nemetschek SE - Overview
Nemetschek SE - Business segments
Nemetschek SE - Key offerings
Nemetschek SE - Segment focus
SWOT

15.15 Oracle Corp.

Oracle Corp. - Overview
Oracle Corp. - Business segments
Oracle Corp. - Key news
Oracle Corp. - Key offerings
Oracle Corp. - Segment focus
SWOT

15.16 SAP SE

SAP SE - Overview
SAP SE - Business segments
SAP SE - Key news
SAP SE - Key offerings
SAP SE - Segment focus
SWOT

15.17 Schneider Electric SE

Schneider Electric SE - Overview
Schneider Electric SE - Business segments
Schneider Electric SE - Key news
Schneider Electric SE - Key offerings
Schneider Electric SE - Segment focus
SWOT

15.18 Siemens AG

Siemens AG - Overview
Siemens AG - Business segments
Siemens AG - Key news
Siemens AG - Key offerings
Siemens AG - Segment focus
SWOT

16. Appendix

16.1 Scope of the report

Market definition
Objectives
Notes and caveats

16.2 Inclusions and exclusions checklist

Inclusions checklist
Exclusions checklist

16.3 Currency conversion rates for US$

16.4 Research methodology

16.5 Data procurement

Information sources

16.6 Data validation

16.7 Validation techniques employed for market sizing

16.8 Data synthesis

16.9 360 degree market analysis

16.10 List of abbreviations

Research Methodology

Technavio presents a detailed picture of the market by way of study, synthesis, and summation of data from multiple sources. The analysts have presented the various facets of the market with a particular focus on identifying the key industry influencers. The data thus presented is comprehensive, reliable, and the result of extensive research, both primary and secondary.

INFORMATION SOURCES

Primary sources

  • Manufacturers and suppliers
  • Channel partners
  • Industry experts
  • Strategic decision makers

Secondary sources

  • Industry journals and periodicals
  • Government data
  • Financial reports of key industry players
  • Historical data
  • Press releases

DATA ANALYSIS

Data Synthesis

  • Collation of data
  • Estimation of key figures
  • Analysis of derived insights

Data Validation

  • Triangulation with data models
  • Reference against proprietary databases
  • Corroboration with industry experts

REPORT WRITING

Qualitative

  • Market drivers
  • Market challenges
  • Market trends
  • Five forces analysis

Quantitative

  • Market size and forecast
  • Market segmentation
  • Geographical insights
  • Competitive landscape

Interested in this report?

Get your sample now to see our research methodology and insights!

Download Now

Frequently Asked Questions

Digital Twin For Buildings market growth will increase by USD 6370.3 million during 2026-2030.

The Digital Twin For Buildings market is expected to grow at a CAGR of 30.7% during 2026-2030.

Digital Twin For Buildings market is segmented by Component (Solutions, Services) Application (Facility management, Predictive maintenance, Energy management, Space optimization, Safety and security monitoring) End-user (Commercial buildings, Industrial buildings, Residential buildings)

ABB Ltd., Autodesk Inc., Bentley Systems Inc., Dassault Systemes SE, Honeywell International Inc., Huawei Technologies Co. Ltd., IBM Corp., Integrated Environmental Ltd., Johnson Controls International, KODE Labs Inc., Matterport Inc., Microsoft Corp., Nemetschek SE, Oracle Corp., Planon Group, SAP SE, Schneider Electric SE, Siemens AG, Trimble Inc., Willow Technology Corporation. are a few of the key vendors in the Digital Twin For Buildings market.

North America will register the highest growth rate of 36.3% among the other regions. Therefore, the Digital Twin For Buildings market in North America is expected to garner significant business opportunities for the vendors during the forecast period.

US, Canada, Mexico, Germany, UK, France, Italy, Spain, The Netherlands, China, Japan, India, South Korea, Australia, Indonesia, UAE, Saudi Arabia, South Africa, Turkey, Israel, Brazil, Argentina, Colombia

  • Imperative for decarbonization and energy optimization in built environments is the driving factor this market.

The Digital Twin For Buildings market vendors should focus on grabbing business opportunities from the Component segment as it accounted for the largest market share in the base year.
RIA - Research AI Assistant
Ask RIA