Digital Twin For Discrete Manufacturing Market Analysis, Size, and Forecast 2026-2030: North America (US, Canada, and Mexico), APAC (China, Japan, and India), Europe (UK, Germany, and France), Middle East and Africa (Saudi Arabia, UAE, and South Africa), South America (Brazil, Argentina, and Colombia), and Rest of World (ROW)

Digital Twin For Discrete Manufacturing Market Analysis, Size, and Forecast 2026-2030:
North America (US, Canada, and Mexico), APAC (China, Japan, and India), Europe (UK, Germany, and France), Middle East and Africa (Saudi Arabia, UAE, and South Africa), South America (Brazil, Argentina, and Colombia), and Rest of World (ROW)

Published: Mar 2026 321 Pages SKU: IRTNTR81258

Market Overview at a Glance

$63.12 B
Market Opportunity
39%
CAGR 2025 - 2030
31.7%
North America Growth
$6.72 B
On premises segment 2024

Digital Twin For Discrete Manufacturing Market Size 2026-2030

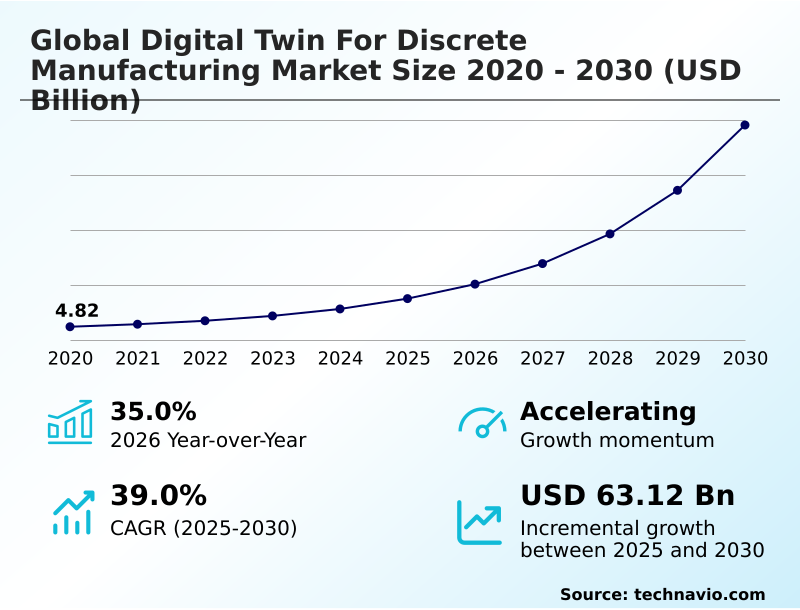
The digital twin for discrete manufacturing market size is valued to increase by USD 63.12 billion, at a CAGR of 39% from 2025 to 2030. Acceleration of industry 4.0 and integration of Industrial Internet of Things (IIoT) will drive the digital twin for discrete manufacturing market.

Major Market Trends & Insights

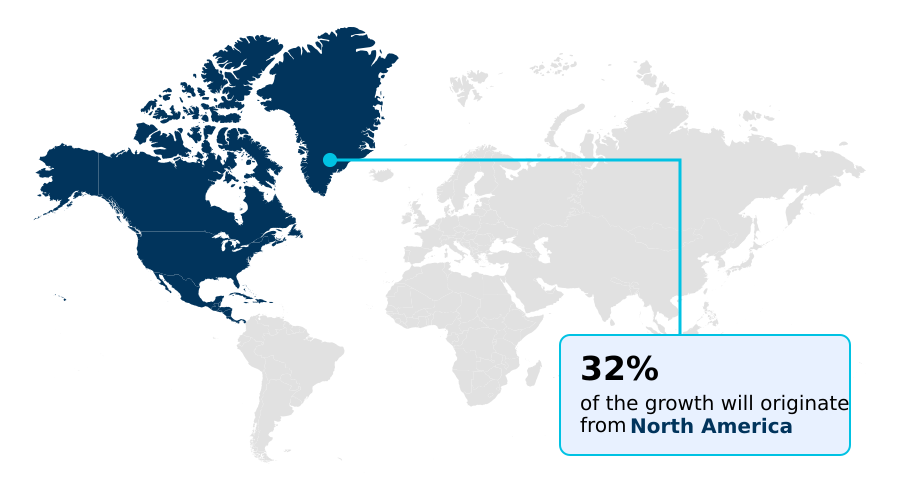
  • North America dominated the market and accounted for a 31.7% growth during the forecast period.
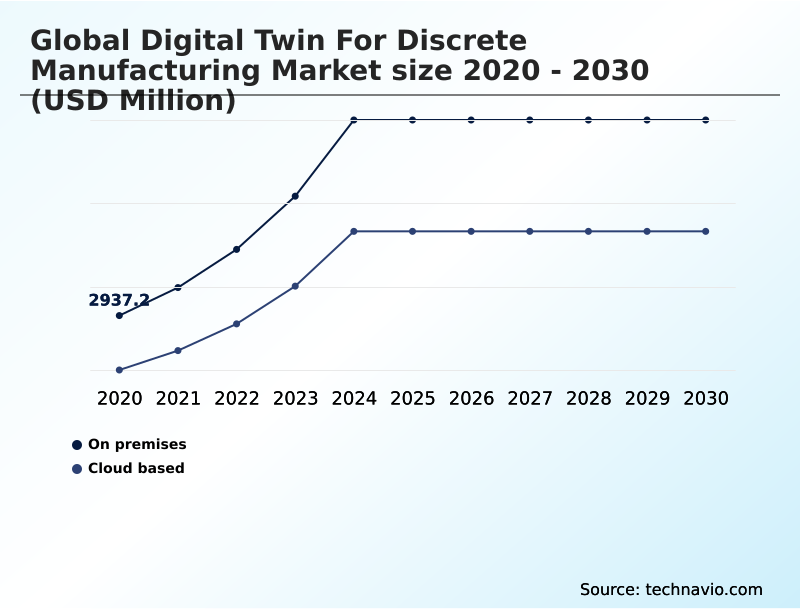
  • By Deployment - On premises segment was valued at USD 6.72 billion in 2024
  • By End-user - Automotive manufacturing segment accounted for the largest market revenue share in 2024

Market Size & Forecast

  • Market Opportunities: USD 73.35 billion
  • Market Future Opportunities: USD 63.12 billion
  • CAGR from 2025 to 2030 : 39%

Market Summary

  • The digital twin for discrete manufacturing market is advancing beyond simple visualization to become a cornerstone of intelligent industrial operations. This evolution is driven by the need for enhanced operational efficiency and accelerated product innovation in sectors like automotive and electronics.
  • The technology integrates real-time data streams into high-fidelity virtual models, enabling predictive maintenance that anticipates equipment failures and optimizes asset performance throughout its lifecycle. A key trend is the fusion with generative AI, allowing for the autonomous creation of optimized designs and production schedules.
  • For instance, an automotive OEM can simulate millions of miles for an electric vehicle's battery performance in a virtual environment, drastically reducing physical testing costs and development timelines. While implementation complexity and data security remain concerns, the strategic benefits of improved agility and reduced time-to-market are compelling.
  • The ability to create a seamless digital thread from design to service is fundamentally reshaping how complex products are made and maintained in the global digital twin for discrete manufacturing market 2026-2030.

What will be the Size of the Digital Twin For Discrete Manufacturing Market during the forecast period?

Get Key Insights on Market Forecast (PDF) Request Free Sample

How is the Digital Twin For Discrete Manufacturing Market Segmented?

The digital twin for discrete manufacturing industry research report provides comprehensive data (region-wise segment analysis), with forecasts and estimates in "USD million" for the period 2026-2030, as well as historical data from 2020-2024 for the following segments.

  • Deployment
    • On premises
    • Cloud based
  • End-user
    • Automotive manufacturing
    • Aerospace and defense
    • Industrial machinery
    • Electronics and semiconductor
    • Medical devices
  • Application
    • Predictive maintenance
    • Design and engineering
    • Production planning and scheduling
    • Quality management
  • Geography
    • North America
      • US
      • Canada
      • Mexico
    • APAC
      • China
      • Japan
      • India
    • Europe
      • UK
      • Germany
      • France
    • Middle East and Africa
      • Saudi Arabia
      • UAE
      • South Africa
    • South America
      • Brazil
      • Argentina
      • Colombia
    • Rest of World (ROW)

By Deployment Insights

The on premises segment is estimated to witness significant growth during the forecast period.

On-premises deployment remains a significant choice for discrete manufacturers, driven by stringent data security and intellectual property protection needs.

This model ensures that sensitive operational data, including proprietary designs, remains within an organization's direct control, a critical factor for sectors like aerospace and defense.

This approach facilitates low-latency connections essential for high-speed production lines and supports deep integration with legacy manufacturing systems. While requiring substantial upfront investment, the control and reliability it offers are paramount for operational resilience.

For instance, manufacturers utilizing on-premises digital twins for workforce training simulation have reported a 20% reduction in onboarding errors.

This model underpins sustainable manufacturing practices by enabling detailed energy consumption modeling and material lifecycle analysis, aligning with circular economy principles and agile product development.

Request Free Sample

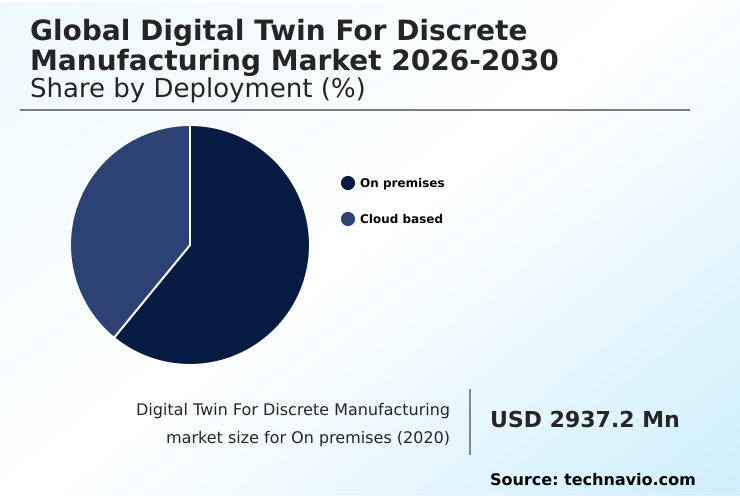
The On premises segment was valued at USD 6.72 billion in 2024 and showed a gradual increase during the forecast period.

Request Free Sample

Regional Analysis

North America is estimated to contribute 31.7% to the growth of the global market during the forecast period.Technavio’s analysts have elaborately explained the regional trends and drivers that shape the market during the forecast period.

See How Digital Twin For Discrete Manufacturing Market Demand is Rising in North America Request Free Sample

The geographic landscape is shaped by distinct regional initiatives and economic forces. In North America, a nearshoring manufacturing boom is accelerating adoption, with a focus on supply chain resilience and data sovereignty compliance.

This region accounts for 31.7% of the market's incremental growth, driven by digital infrastructure investment in the US and Canada.

In APAC, the rise of industrial internet platforms is central, as nations like China and South Korea aim for zero-defect manufacturing goals. European adoption is heavily influenced by sustainability regulations.

Across these regions, digital twins are pivotal for production line optimization and prescriptive operations, with some manufacturers achieving a 25% reduction in time spent on virtual prototyping cycles.

This allows for rapid component geometry optimization and facilitates remote collaboration tools, enhancing root cause analysis capabilities with photorealistic rendering.

Market Dynamics

Our researchers analyzed the data with 2025 as the base year, along with the key drivers, trends, and challenges. A holistic analysis of drivers will help companies refine their marketing strategies to gain a competitive advantage.

  • The application of digital twin technology is expanding across various sectors, demonstrating its versatility and impact on modern industrial practices. The digital twin for automotive manufacturing is crucial for managing the transition to electric vehicles, particularly in virtual commissioning for production lines and optimizing EV manufacturing processes.
  • Similarly, the aerospace and defense digital twin focuses on ensuring the reliability and lifecycle management of complex assets. For producers of heavy equipment, the digital twin for industrial machinery provides a pathway to predictive maintenance and enhanced service offerings.
  • In high-tech sectors, the electronics and semiconductor digital twin is indispensable for managing microscopic precision, such as in semiconductor fab digital twin optimization. The medical device manufacturing digital twin ensures regulatory compliance and product efficacy.
  • Across all these industries, specific applications are driving adoption; the digital twin for predictive maintenance, for example, shows adoption rates nearly double those of quality management applications in some sectors. Use cases like the digital twin for design engineering and production planning digital twin simulation are foundational for reducing time-to-market with digital twins.
  • Deployments vary, with cloud-based digital twin solutions offering scalability, while on-premises digital twin deployment caters to high-security needs. The technology's future is tied to trends like generative AI in digital twins and the industrial metaverse for manufacturing, which promise even greater levels of automation and insight for the digital twin for asset lifecycle and supply chain visibility.

What are the key market drivers leading to the rise in the adoption of Digital Twin For Discrete Manufacturing Industry?

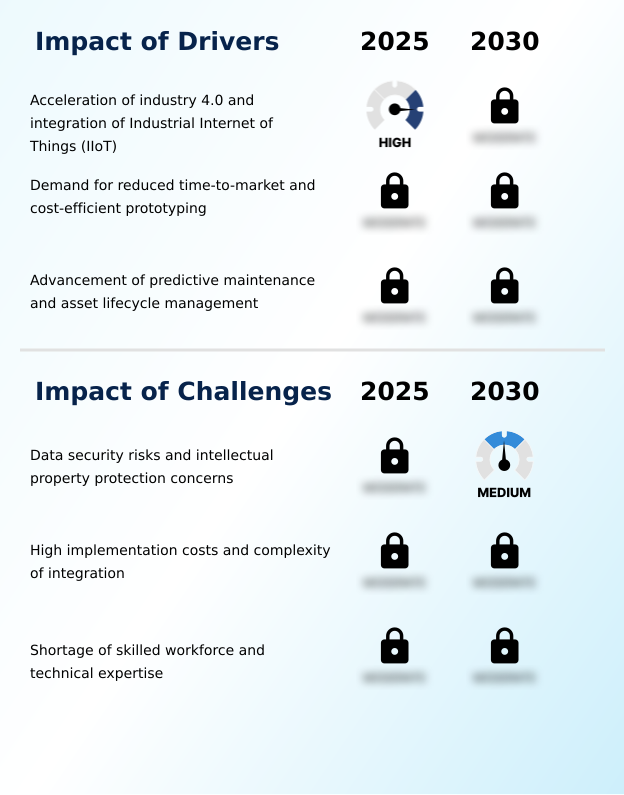
  • The acceleration of Industry 4.0, along with the deep integration of the Industrial Internet of Things (IIoT), is a primary driver for market expansion.

  • Market expansion is fueled by the drive toward smart factory implementation, which hinges on the deep integration of operational and information technologies. This IT/OT convergence, powered by IIoT sensor networks, feeds constant data from SCADA systems into high-fidelity virtual replicas.
  • The use of edge computing data processing ensures that this information is analyzed with minimal latency, enabling immediate adjustments on the factory floor and improving overall equipment effectiveness (OEE) by up to 15%.
  • This software-defined architecture is the backbone for enterprise AI applications that run complex multiphysics simulations.
  • By integrating with existing manufacturing execution system (MES) synchronization and product lifecycle management (PLM) integration frameworks, companies can achieve a 99.5% data synchronization rate between the physical asset and its digital counterpart, enabling advanced computer-aided engineering (CAE) capabilities.

What are the market trends shaping the Digital Twin For Discrete Manufacturing Industry?

  • The convergence of generative AI with cognitive capabilities is creating dynamic, self-learning digital twins. This evolution moves beyond static replicas to enable prescriptive operational models.

  • Key trends are reshaping the market by moving from static models to dynamic, intelligent systems. The emergence of cognitive digital twins, which leverage AI for self-optimization, is central to this shift. These systems support advanced asset lifecycle management (ALM) and enable true closed-loop manufacturing.
  • The industrial metaverse, a convergence of spatial computing with extended reality (XR), is creating immersive virtual reality (VR) environments for collaboration and training. An augmented reality (AR) overlay can guide technicians through complex repairs using predictive maintenance algorithms, improving first-time fix rates by up to 30%. This evolution relies on real-time data integration to maintain digital thread continuity.
  • Moreover, virtual commissioning within these environments allows for physics-based simulation of entire production lines, reducing setup times by as much as 50% before physical deployment.

What challenges does the Digital Twin For Discrete Manufacturing Industry face during its growth?

  • Significant data security risks combined with concerns over intellectual property protection present a key challenge affecting the industry's growth trajectory.

  • Despite strong drivers, significant challenges hinder widespread adoption, particularly for small and medium-sized enterprises. The high cost and complexity of the virtual validation process, which requires specialized software and skilled personnel, is a primary barrier, with initial implementation costs running 50% higher than traditional MES upgrades. Ensuring seamless data flow for cyber-physical systems is difficult, often impeded by legacy equipment.
  • This complexity makes it challenging to implement servitization business models or achieve lights-out manufacturing. Furthermore, the technology must support high-mix, low-volume production to provide a clear ROI, a capability that only 35% of current platforms adequately address. The process of dimensional data analysis and as-built vs as-designed comparison for closed-loop quality control requires substantial data harmonization.
  • Achieving effective what-if scenario analysis for mass customization enablement depends heavily on generative design capabilities and robust systems engineering, which are not yet universally available.

Exclusive Technavio Analysis on Customer Landscape

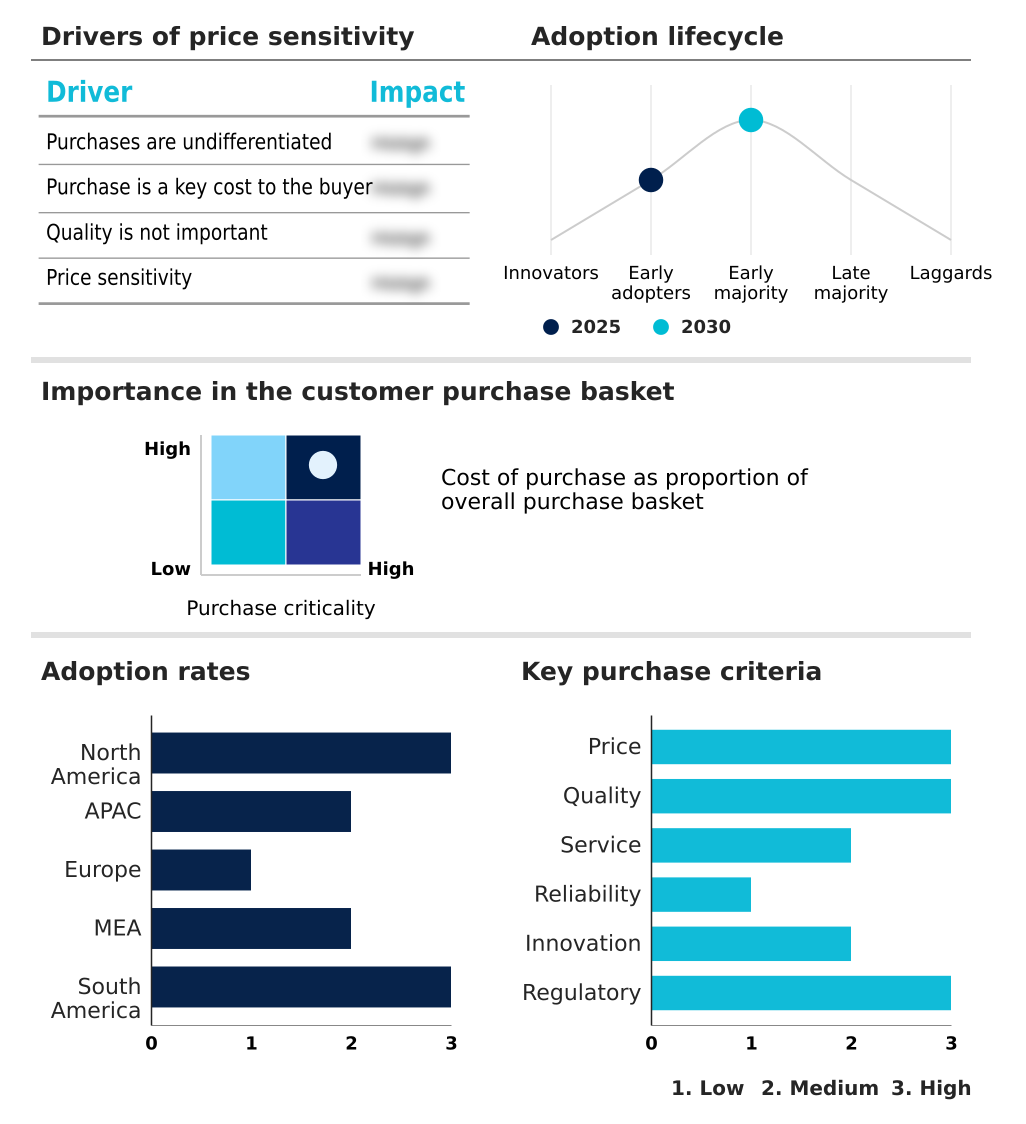
The digital twin for discrete manufacturing market forecasting report includes the adoption lifecycle of the market, covering from the innovator’s stage to the laggard’s stage. It focuses on adoption rates in different regions based on penetration. Furthermore, the digital twin for discrete manufacturing market report also includes key purchase criteria and drivers of price sensitivity to help companies evaluate and develop their market growth analysis strategies.

Customer Landscape of Digital Twin For Discrete Manufacturing Industry

Competitive Landscape

Companies are implementing various strategies, such as strategic alliances, digital twin for discrete manufacturing market forecast, partnerships, mergers and acquisitions, geographical expansion, and product/service launches, to enhance their presence in the industry.

ABB Ltd. - Solutions create dynamic digital replicas of industrial assets, enabling performance monitoring, process simulation, and data-driven operational optimization across the manufacturing lifecycle.

The industry research and growth report includes detailed analyses of the competitive landscape of the market and information about key companies, including:

  • ABB Ltd.
  • Amazon.com Inc.
  • ANSYS Inc.
  • Autodesk Inc.
  • Bentley Systems Inc.
  • C3.ai Inc.
  • Dassault Systemes SE
  • GE Vernova Inc.
  • Hexagon AB
  • Honeywell International Inc.
  • Matterport Inc.
  • Microsoft Corp.
  • NVIDIA Corp.
  • Oracle Corp.
  • PTC Inc.
  • Robert Bosch GmbH
  • Rockwell Automation Inc.
  • SAP SE
  • Schneider Electric SE
  • Siemens AG

Qualitative and quantitative analysis of companies has been conducted to help clients understand the wider business environment as well as the strengths and weaknesses of key industry players. Data is qualitatively analyzed to categorize companies as pure play, category-focused, industry-focused, and diversified; it is quantitatively analyzed to categorize companies as dominant, leading, strong, tentative, and weak.

Recent Development and News in Digital twin for discrete manufacturing market

  • In September 2024, NVIDIA Corp. launched an update to its Omniverse platform, featuring enhanced real-time physics simulation and AI-powered avatars for collaborative design reviews in virtual factory environments.
  • In November 2024, Microsoft Corp. announced a strategic collaboration with Rockwell Automation Inc. to integrate Azure OpenAI Service with FactoryTalk InnovationSuite, enabling cognitive digital twins that leverage natural language for production optimization.
  • In February 2025, Siemens Digital Industries Software announced an expansion of its Xcelerator portfolio, introducing a specialized AI-driven digital twin module for mid-sized discrete manufacturers to reduce virtual prototyping cycles by an estimated 30%.
  • In April 2025, Schneider Electric SE introduced a new module for its EcoStruxure platform that uses digital twins to create verifiable Digital Product Passports, helping discrete manufacturers comply with new European sustainability regulations.

Dive into Technavio’s robust research methodology, blending expert interviews, extensive data synthesis, and validated models for unparalleled Digital Twin For Discrete Manufacturing Market insights. See full methodology.

Market Scope
Page number 321
Base year 2025
Historic period 2020-2024
Forecast period 2026-2030
Growth momentum & CAGR Accelerate at a CAGR of 39%
Market growth 2026-2030 USD 63121.7 million
Market structure Fragmented
YoY growth 2025-2026(%) 35.0%
Key countries US, Canada, Mexico, China, Japan, India, South Korea, Australia, Indonesia, UK, Germany, France, Italy, The Netherlands, Spain, Saudi Arabia, UAE, South Africa, Israel, Turkey, Brazil, Argentina and Colombia
Competitive landscape Leading Companies, Market Positioning of Companies, Competitive Strategies, and Industry Risks

Request Free Sample

Research Analyst Overview

  • The market is defined by a sophisticated interplay of technologies that create an end-to-end digital thread continuity. At its core, physics-based simulation combines with real-time data integration from SCADA and MES synchronization to create high-fidelity virtual replicas. This enables advanced applications like virtual commissioning and closed-loop manufacturing.
  • Predictive maintenance algorithms and multiphysics simulation are pivotal for asset lifecycle management (ALM), directly improving overall equipment effectiveness (OEE). The design phase is transformed by computer-aided engineering (CAE) and generative design, with firms achieving over a 30% reduction in virtual prototyping cycles.
  • Downstream, closed-loop quality control is achieved through as-built vs as-designed comparison using dimensional data analysis for root cause analysis. This entire ecosystem, supported by photorealistic rendering and PLM integration, allows for prescriptive operations.
  • For boardrooms, the adoption of digital product passports (DPP) through systems engineering is becoming a key strategic tool for demonstrating ESG compliance and managing material lifecycle analysis for the circular economy, connecting operational technology directly to corporate governance and sustainability mandates.

What are the Key Data Covered in this Digital Twin For Discrete Manufacturing Market Research and Growth Report?

  • What is the expected growth of the Digital Twin For Discrete Manufacturing Market between 2026 and 2030?

    • USD 63.12 billion, at a CAGR of 39%

  • What segmentation does the market report cover?

    • The report is segmented by Deployment (On premises, and Cloud based), End-user (Automotive manufacturing, Aerospace and defense, Industrial machinery, Electronics and semiconductor, and Medical devices), Application (Predictive maintenance, Design and engineering, Production planning and scheduling, and Quality management) and Geography (North America, APAC, Europe, Middle East and Africa, South America)

  • Which regions are analyzed in the report?

    • North America, APAC, Europe, Middle East and Africa and South America

  • What are the key growth drivers and market challenges?

    • Acceleration of industry 4.0 and integration of Industrial Internet of Things (IIoT), Data security risks and intellectual property protection concerns

  • Who are the major players in the Digital Twin For Discrete Manufacturing Market?

    • ABB Ltd., Amazon.com Inc., ANSYS Inc., Autodesk Inc., Bentley Systems Inc., C3.ai Inc., Dassault Systemes SE, GE Vernova Inc., Hexagon AB, Honeywell International Inc., Matterport Inc., Microsoft Corp., NVIDIA Corp., Oracle Corp., PTC Inc., Robert Bosch GmbH, Rockwell Automation Inc., SAP SE, Schneider Electric SE and Siemens AG

Market Research Insights

  • The market's momentum is defined by the convergence of advanced technologies that enable smart factory implementation. The integration of IT/OT convergence and IIoT sensor networks provides the foundation for enterprise AI applications, while edge computing data processing ensures real-time responsiveness.
  • This software-defined architecture supports servitization business models and agile product development, with some firms improving new product introduction timelines by 25%. Technologies like the industrial metaverse, leveraging extended reality (XR), are transforming collaboration. The push for operational resilience is fueling the nearshoring manufacturing boom and reshoring manufacturing activities, where digital infrastructure investment is critical.
  • These systems enhance supply chain resilience and end-to-end traceability, with deployments showing up to a 15% improvement in efficiency for high-mix, low-volume production and mass customization enablement, driving toward zero-defect manufacturing goals.

We can help! Our analysts can customize this digital twin for discrete manufacturing market research report to meet your requirements.

Get in touch

1. Executive Summary

1.1 Market overview

Executive Summary - Chart on Market Overview
Executive Summary - Data Table on Market Overview
Executive Summary - Chart on Global Market Characteristics
Executive Summary - Chart on Market by Geography
Executive Summary - Chart on Market Segmentation by Deployment
Executive Summary - Chart on Market Segmentation by End-user
Executive Summary - Chart on Market Segmentation by Application
Executive Summary - Chart on Incremental Growth
Executive Summary - Data Table on Incremental Growth
Executive Summary - Chart on Company Market Positioning

2. Technavio Analysis

2.1 Analysis of price sensitivity, lifecycle, customer purchase basket, adoption rates, and purchase criteria

2.2 Criticality of inputs and Factors of differentiation

Chart on Overview on criticality of inputs and factors of differentiation

2.3 Factors of disruption

Chart on Overview on factors of disruption

2.4 Impact of drivers and challenges

Chart on Impact of drivers and challenges in 2025 and 2030

3. Market Landscape

3.1 Market ecosystem

Chart on Parent Market
Data Table on - Parent Market

3.2 Market characteristics

Chart on Market characteristics analysis

3.3 Value chain analysis

Chart on Value chain analysis

4. Market Sizing

4.1 Market definition

Data Table on Offerings of companies included in the market definition

4.2 Market segment analysis

Market segments

4.3 Market size 2025

4.4 Market outlook: Forecast for 2025-2030

Chart on Global - Market size and forecast 2025-2030 ($ million)
Data Table on Global - Market size and forecast 2025-2030 ($ million)
Chart on Global Market: Year-over-year growth 2025-2030 (%)
Data Table on Global Market: Year-over-year growth 2025-2030 (%)

5. Historic Market Size

5.1 Global Digital Twin For Discrete Manufacturing Market 2020 - 2024

Historic Market Size - Data Table on Global Digital Twin For Discrete Manufacturing Market 2020 - 2024 ($ million)

5.2 Deployment segment analysis 2020 - 2024

Historic Market Size - Deployment Segment 2020 - 2024 ($ million)

5.3 End-user segment analysis 2020 - 2024

Historic Market Size - End-user Segment 2020 - 2024 ($ million)

5.4 Application segment analysis 2020 - 2024

Historic Market Size - Application Segment 2020 - 2024 ($ million)

5.5 Geography segment analysis 2020 - 2024

Historic Market Size - Geography Segment 2020 - 2024 ($ million)

5.6 Country segment analysis 2020 - 2024

Historic Market Size - Country Segment 2020 - 2024 ($ million)

6. Qualitative Analysis

6.1 Impact of AI on the Global Digital Twin for Discrete Manufacturing Market

7. Five Forces Analysis

7.1 Five forces summary

Five forces analysis - Comparison between 2025 and 2030

7.2 Bargaining power of buyers

Bargaining power of buyers - Impact of key factors 2025 and 2030

7.3 Bargaining power of suppliers

Bargaining power of suppliers - Impact of key factors in 2025 and 2030

7.4 Threat of new entrants

Threat of new entrants - Impact of key factors in 2025 and 2030

7.5 Threat of substitutes

Threat of substitutes - Impact of key factors in 2025 and 2030

7.6 Threat of rivalry

Threat of rivalry - Impact of key factors in 2025 and 2030

7.7 Market condition

Chart on Market condition - Five forces 2025 and 2030

8. Market Segmentation by Deployment

8.1 Market segments

Chart on Deployment - Market share 2025-2030 (%)
Data Table on Deployment - Market share 2025-2030 (%)

8.2 Comparison by Deployment

Chart on Comparison by Deployment
Data Table on Comparison by Deployment

8.3 On premises - Market size and forecast 2025-2030

Chart on On premises - Market size and forecast 2025-2030 ($ million)
Data Table on On premises - Market size and forecast 2025-2030 ($ million)
Chart on On premises - Year-over-year growth 2025-2030 (%)
Data Table on On premises - Year-over-year growth 2025-2030 (%)

8.4 Cloud based - Market size and forecast 2025-2030

Chart on Cloud based - Market size and forecast 2025-2030 ($ million)
Data Table on Cloud based - Market size and forecast 2025-2030 ($ million)
Chart on Cloud based - Year-over-year growth 2025-2030 (%)
Data Table on Cloud based - Year-over-year growth 2025-2030 (%)

8.5 Market opportunity by Deployment

Market opportunity by Deployment ($ million)
Data Table on Market opportunity by Deployment ($ million)

9. Market Segmentation by End-user

9.1 Market segments

Chart on End-user - Market share 2025-2030 (%)
Data Table on End-user - Market share 2025-2030 (%)

9.2 Comparison by End-user

Chart on Comparison by End-user
Data Table on Comparison by End-user

9.3 Automotive manufacturing - Market size and forecast 2025-2030

Chart on Automotive manufacturing - Market size and forecast 2025-2030 ($ million)
Data Table on Automotive manufacturing - Market size and forecast 2025-2030 ($ million)
Chart on Automotive manufacturing - Year-over-year growth 2025-2030 (%)
Data Table on Automotive manufacturing - Year-over-year growth 2025-2030 (%)

9.4 Aerospace and defense - Market size and forecast 2025-2030

Chart on Aerospace and defense - Market size and forecast 2025-2030 ($ million)
Data Table on Aerospace and defense - Market size and forecast 2025-2030 ($ million)
Chart on Aerospace and defense - Year-over-year growth 2025-2030 (%)
Data Table on Aerospace and defense - Year-over-year growth 2025-2030 (%)

9.5 Industrial machinery - Market size and forecast 2025-2030

Chart on Industrial machinery - Market size and forecast 2025-2030 ($ million)
Data Table on Industrial machinery - Market size and forecast 2025-2030 ($ million)
Chart on Industrial machinery - Year-over-year growth 2025-2030 (%)
Data Table on Industrial machinery - Year-over-year growth 2025-2030 (%)

9.6 Electronics and semiconductor - Market size and forecast 2025-2030

Chart on Electronics and semiconductor - Market size and forecast 2025-2030 ($ million)
Data Table on Electronics and semiconductor - Market size and forecast 2025-2030 ($ million)
Chart on Electronics and semiconductor - Year-over-year growth 2025-2030 (%)
Data Table on Electronics and semiconductor - Year-over-year growth 2025-2030 (%)

9.7 Medical devices - Market size and forecast 2025-2030

Chart on Medical devices - Market size and forecast 2025-2030 ($ million)
Data Table on Medical devices - Market size and forecast 2025-2030 ($ million)
Chart on Medical devices - Year-over-year growth 2025-2030 (%)
Data Table on Medical devices - Year-over-year growth 2025-2030 (%)

9.8 Market opportunity by End-user

Market opportunity by End-user ($ million)
Data Table on Market opportunity by End-user ($ million)

10. Market Segmentation by Application

10.1 Market segments

Chart on Application - Market share 2025-2030 (%)
Data Table on Application - Market share 2025-2030 (%)

10.2 Comparison by Application

Chart on Comparison by Application
Data Table on Comparison by Application

10.3 Predictive maintenance - Market size and forecast 2025-2030

Chart on Predictive maintenance - Market size and forecast 2025-2030 ($ million)
Data Table on Predictive maintenance - Market size and forecast 2025-2030 ($ million)
Chart on Predictive maintenance - Year-over-year growth 2025-2030 (%)
Data Table on Predictive maintenance - Year-over-year growth 2025-2030 (%)

10.4 Design and engineering - Market size and forecast 2025-2030

Chart on Design and engineering - Market size and forecast 2025-2030 ($ million)
Data Table on Design and engineering - Market size and forecast 2025-2030 ($ million)
Chart on Design and engineering - Year-over-year growth 2025-2030 (%)
Data Table on Design and engineering - Year-over-year growth 2025-2030 (%)

10.5 Production planning and scheduling - Market size and forecast 2025-2030

Chart on Production planning and scheduling - Market size and forecast 2025-2030 ($ million)
Data Table on Production planning and scheduling - Market size and forecast 2025-2030 ($ million)
Chart on Production planning and scheduling - Year-over-year growth 2025-2030 (%)
Data Table on Production planning and scheduling - Year-over-year growth 2025-2030 (%)

10.6 Quality management - Market size and forecast 2025-2030

Chart on Quality management - Market size and forecast 2025-2030 ($ million)
Data Table on Quality management - Market size and forecast 2025-2030 ($ million)
Chart on Quality management - Year-over-year growth 2025-2030 (%)
Data Table on Quality management - Year-over-year growth 2025-2030 (%)

10.7 Market opportunity by Application

Market opportunity by Application ($ million)
Data Table on Market opportunity by Application ($ million)

11. Customer Landscape

11.1 Customer landscape overview

Analysis of price sensitivity, lifecycle, customer purchase basket, adoption rates, and purchase criteria

12. Geographic Landscape

12.1 Geographic segmentation

Chart on Market share by geography 2025-2030 (%)
Data Table on Market share by geography 2025-2030 (%)

12.2 Geographic comparison

Chart on Geographic comparison
Data Table on Geographic comparison

12.3 North America - Market size and forecast 2025-2030

Chart on North America - Market size and forecast 2025-2030 ($ million)
Data Table on North America - Market size and forecast 2025-2030 ($ million)
Chart on North America - Year-over-year growth 2025-2030 (%)
Data Table on North America - Year-over-year growth 2025-2030 (%)
Chart on Regional Comparison - North America
Data Table on Regional Comparison - North America

12.3.1 US - Market size and forecast 2025-2030

Chart on US - Market size and forecast 2025-2030 ($ million)
Data Table on US - Market size and forecast 2025-2030 ($ million)
Chart on US - Year-over-year growth 2025-2030 (%)
Data Table on US - Year-over-year growth 2025-2030 (%)

12.3.2 Canada - Market size and forecast 2025-2030

Chart on Canada - Market size and forecast 2025-2030 ($ million)
Data Table on Canada - Market size and forecast 2025-2030 ($ million)
Chart on Canada - Year-over-year growth 2025-2030 (%)
Data Table on Canada - Year-over-year growth 2025-2030 (%)

12.3.3 Mexico - Market size and forecast 2025-2030

Chart on Mexico - Market size and forecast 2025-2030 ($ million)
Data Table on Mexico - Market size and forecast 2025-2030 ($ million)
Chart on Mexico - Year-over-year growth 2025-2030 (%)
Data Table on Mexico - Year-over-year growth 2025-2030 (%)

12.4 APAC - Market size and forecast 2025-2030

Chart on APAC - Market size and forecast 2025-2030 ($ million)
Data Table on APAC - Market size and forecast 2025-2030 ($ million)
Chart on APAC - Year-over-year growth 2025-2030 (%)
Data Table on APAC - Year-over-year growth 2025-2030 (%)
Chart on Regional Comparison - APAC
Data Table on Regional Comparison - APAC

12.4.1 China - Market size and forecast 2025-2030

Chart on China - Market size and forecast 2025-2030 ($ million)
Data Table on China - Market size and forecast 2025-2030 ($ million)
Chart on China - Year-over-year growth 2025-2030 (%)
Data Table on China - Year-over-year growth 2025-2030 (%)

12.4.2 Japan - Market size and forecast 2025-2030

Chart on Japan - Market size and forecast 2025-2030 ($ million)
Data Table on Japan - Market size and forecast 2025-2030 ($ million)
Chart on Japan - Year-over-year growth 2025-2030 (%)
Data Table on Japan - Year-over-year growth 2025-2030 (%)

12.4.3 India - Market size and forecast 2025-2030

Chart on India - Market size and forecast 2025-2030 ($ million)
Data Table on India - Market size and forecast 2025-2030 ($ million)
Chart on India - Year-over-year growth 2025-2030 (%)
Data Table on India - Year-over-year growth 2025-2030 (%)

12.4.4 South Korea - Market size and forecast 2025-2030

Chart on South Korea - Market size and forecast 2025-2030 ($ million)
Data Table on South Korea - Market size and forecast 2025-2030 ($ million)
Chart on South Korea - Year-over-year growth 2025-2030 (%)
Data Table on South Korea - Year-over-year growth 2025-2030 (%)

12.4.5 Australia - Market size and forecast 2025-2030

Chart on Australia - Market size and forecast 2025-2030 ($ million)
Data Table on Australia - Market size and forecast 2025-2030 ($ million)
Chart on Australia - Year-over-year growth 2025-2030 (%)
Data Table on Australia - Year-over-year growth 2025-2030 (%)

12.4.6 Indonesia - Market size and forecast 2025-2030

Chart on Indonesia - Market size and forecast 2025-2030 ($ million)
Data Table on Indonesia - Market size and forecast 2025-2030 ($ million)
Chart on Indonesia - Year-over-year growth 2025-2030 (%)
Data Table on Indonesia - Year-over-year growth 2025-2030 (%)

12.5 Europe - Market size and forecast 2025-2030

Chart on Europe - Market size and forecast 2025-2030 ($ million)
Data Table on Europe - Market size and forecast 2025-2030 ($ million)
Chart on Europe - Year-over-year growth 2025-2030 (%)
Data Table on Europe - Year-over-year growth 2025-2030 (%)
Chart on Regional Comparison - Europe
Data Table on Regional Comparison - Europe

12.5.1 UK - Market size and forecast 2025-2030

Chart on UK - Market size and forecast 2025-2030 ($ million)
Data Table on UK - Market size and forecast 2025-2030 ($ million)
Chart on UK - Year-over-year growth 2025-2030 (%)
Data Table on UK - Year-over-year growth 2025-2030 (%)

12.5.2 Germany - Market size and forecast 2025-2030

Chart on Germany - Market size and forecast 2025-2030 ($ million)
Data Table on Germany - Market size and forecast 2025-2030 ($ million)
Chart on Germany - Year-over-year growth 2025-2030 (%)
Data Table on Germany - Year-over-year growth 2025-2030 (%)

12.5.3 France - Market size and forecast 2025-2030

Chart on France - Market size and forecast 2025-2030 ($ million)
Data Table on France - Market size and forecast 2025-2030 ($ million)
Chart on France - Year-over-year growth 2025-2030 (%)
Data Table on France - Year-over-year growth 2025-2030 (%)

12.5.4 Italy - Market size and forecast 2025-2030

Chart on Italy - Market size and forecast 2025-2030 ($ million)
Data Table on Italy - Market size and forecast 2025-2030 ($ million)
Chart on Italy - Year-over-year growth 2025-2030 (%)
Data Table on Italy - Year-over-year growth 2025-2030 (%)

12.5.5 The Netherlands - Market size and forecast 2025-2030

Chart on The Netherlands - Market size and forecast 2025-2030 ($ million)
Data Table on The Netherlands - Market size and forecast 2025-2030 ($ million)
Chart on The Netherlands - Year-over-year growth 2025-2030 (%)
Data Table on The Netherlands - Year-over-year growth 2025-2030 (%)

12.5.6 Spain - Market size and forecast 2025-2030

Chart on Spain - Market size and forecast 2025-2030 ($ million)
Data Table on Spain - Market size and forecast 2025-2030 ($ million)
Chart on Spain - Year-over-year growth 2025-2030 (%)
Data Table on Spain - Year-over-year growth 2025-2030 (%)

12.6 Middle East and Africa - Market size and forecast 2025-2030

Chart on Middle East and Africa - Market size and forecast 2025-2030 ($ million)
Data Table on Middle East and Africa - Market size and forecast 2025-2030 ($ million)
Chart on Middle East and Africa - Year-over-year growth 2025-2030 (%)
Data Table on Middle East and Africa - Year-over-year growth 2025-2030 (%)
Chart on Regional Comparison - Middle East and Africa
Data Table on Regional Comparison - Middle East and Africa

12.6.1 Saudi Arabia - Market size and forecast 2025-2030

Chart on Saudi Arabia - Market size and forecast 2025-2030 ($ million)
Data Table on Saudi Arabia - Market size and forecast 2025-2030 ($ million)
Chart on Saudi Arabia - Year-over-year growth 2025-2030 (%)
Data Table on Saudi Arabia - Year-over-year growth 2025-2030 (%)

12.6.2 UAE - Market size and forecast 2025-2030

Chart on UAE - Market size and forecast 2025-2030 ($ million)
Data Table on UAE - Market size and forecast 2025-2030 ($ million)
Chart on UAE - Year-over-year growth 2025-2030 (%)
Data Table on UAE - Year-over-year growth 2025-2030 (%)

12.6.3 South Africa - Market size and forecast 2025-2030

Chart on South Africa - Market size and forecast 2025-2030 ($ million)
Data Table on South Africa - Market size and forecast 2025-2030 ($ million)
Chart on South Africa - Year-over-year growth 2025-2030 (%)
Data Table on South Africa - Year-over-year growth 2025-2030 (%)

12.6.4 Israel - Market size and forecast 2025-2030

Chart on Israel - Market size and forecast 2025-2030 ($ million)
Data Table on Israel - Market size and forecast 2025-2030 ($ million)
Chart on Israel - Year-over-year growth 2025-2030 (%)
Data Table on Israel - Year-over-year growth 2025-2030 (%)

12.6.5 Turkey - Market size and forecast 2025-2030

Chart on Turkey - Market size and forecast 2025-2030 ($ million)
Data Table on Turkey - Market size and forecast 2025-2030 ($ million)
Chart on Turkey - Year-over-year growth 2025-2030 (%)
Data Table on Turkey - Year-over-year growth 2025-2030 (%)

12.7 South America - Market size and forecast 2025-2030

Chart on South America - Market size and forecast 2025-2030 ($ million)
Data Table on South America - Market size and forecast 2025-2030 ($ million)
Chart on South America - Year-over-year growth 2025-2030 (%)
Data Table on South America - Year-over-year growth 2025-2030 (%)
Chart on Regional Comparison - South America
Data Table on Regional Comparison - South America

12.7.1 Brazil - Market size and forecast 2025-2030

Chart on Brazil - Market size and forecast 2025-2030 ($ million)
Data Table on Brazil - Market size and forecast 2025-2030 ($ million)
Chart on Brazil - Year-over-year growth 2025-2030 (%)
Data Table on Brazil - Year-over-year growth 2025-2030 (%)

12.7.2 Argentina - Market size and forecast 2025-2030

Chart on Argentina - Market size and forecast 2025-2030 ($ million)
Data Table on Argentina - Market size and forecast 2025-2030 ($ million)
Chart on Argentina - Year-over-year growth 2025-2030 (%)
Data Table on Argentina - Year-over-year growth 2025-2030 (%)

12.7.3 Colombia - Market size and forecast 2025-2030

Chart on Colombia - Market size and forecast 2025-2030 ($ million)
Data Table on Colombia - Market size and forecast 2025-2030 ($ million)
Chart on Colombia - Year-over-year growth 2025-2030 (%)
Data Table on Colombia - Year-over-year growth 2025-2030 (%)

12.8 Market opportunity by geography

Market opportunity by geography ($ million)
Data Tables on Market opportunity by geography ($ million)

13. Drivers, Challenges, and Opportunity

13.1 Market drivers

Acceleration of industry 4.0 and integration of Industrial Internet of Things (IIoT)
Demand for reduced time-to-market and cost-efficient prototyping
Advancement of predictive maintenance and asset lifecycle management

13.2 Market challenges

Data security risks and intellectual property protection concerns
High implementation costs and complexity of integration
Shortage of skilled workforce and technical expertise

13.3 Impact of drivers and challenges

Impact of drivers and challenges in 2025 and 2030

13.4 Market opportunities

Convergence of generative AI and cognitive digital twins
Rise of industrial metaverse and spatial computing
Integration of sustainability and circular economy principles

14. Competitive Landscape

14.1 Overview

14.2

Overview on criticality of inputs and factors of differentiation

14.3 Landscape disruption

Overview on factors of disruption

14.4 Industry risks

Impact of key risks on business

15. Competitive Analysis

15.1 Companies profiled

Companies covered

15.2 Company ranking index

15.3 Market positioning of companies

Matrix on companies position and classification

15.4 ABB Ltd.

ABB Ltd. - Overview
ABB Ltd. - Business segments
ABB Ltd. - Key news
ABB Ltd. - Key offerings
ABB Ltd. - Segment focus
SWOT

15.5 Amazon.com Inc.

Amazon.com Inc. - Overview
Amazon.com Inc. - Business segments
Amazon.com Inc. - Key news
Amazon.com Inc. - Key offerings
Amazon.com Inc. - Segment focus
SWOT

15.6 ANSYS Inc.

ANSYS Inc. - Overview
ANSYS Inc. - Business segments
ANSYS Inc. - Key news
ANSYS Inc. - Key offerings
ANSYS Inc. - Segment focus
SWOT

15.7 Autodesk Inc.

Autodesk Inc. - Overview
Autodesk Inc. - Business segments
Autodesk Inc. - Key news
Autodesk Inc. - Key offerings
Autodesk Inc. - Segment focus
SWOT

15.8 Dassault Systemes SE

Dassault Systemes SE - Overview
Dassault Systemes SE - Business segments
Dassault Systemes SE - Key news
Dassault Systemes SE - Key offerings
Dassault Systemes SE - Segment focus
SWOT

15.9 GE Vernova Inc.

GE Vernova Inc. - Overview
GE Vernova Inc. - Business segments
GE Vernova Inc. - Key offerings
GE Vernova Inc. - Segment focus
SWOT

15.10 Hexagon AB

Hexagon AB - Overview
Hexagon AB - Business segments
Hexagon AB - Key news
Hexagon AB - Key offerings
Hexagon AB - Segment focus
SWOT

15.11 Honeywell International Inc.

Honeywell International Inc. - Overview
Honeywell International Inc. - Business segments
Honeywell International Inc. - Key news
Honeywell International Inc. - Key offerings
Honeywell International Inc. - Segment focus
SWOT

15.12 Microsoft Corp.

Microsoft Corp. - Overview
Microsoft Corp. - Business segments
Microsoft Corp. - Key news
Microsoft Corp. - Key offerings
Microsoft Corp. - Segment focus
SWOT

15.13 NVIDIA Corp.

NVIDIA Corp. - Overview
NVIDIA Corp. - Business segments
NVIDIA Corp. - Key news
NVIDIA Corp. - Key offerings
NVIDIA Corp. - Segment focus
SWOT

15.14 Robert Bosch GmbH

Robert Bosch GmbH - Overview
Robert Bosch GmbH - Product / Service
Robert Bosch GmbH - Key news
Robert Bosch GmbH - Key offerings
SWOT

15.15 Rockwell Automation Inc.

Rockwell Automation Inc. - Overview
Rockwell Automation Inc. - Business segments
Rockwell Automation Inc. - Key news
Rockwell Automation Inc. - Key offerings
Rockwell Automation Inc. - Segment focus
SWOT

15.16 SAP SE

SAP SE - Overview
SAP SE - Business segments
SAP SE - Key news
SAP SE - Key offerings
SAP SE - Segment focus
SWOT

15.17 Schneider Electric SE

Schneider Electric SE - Overview
Schneider Electric SE - Business segments
Schneider Electric SE - Key news
Schneider Electric SE - Key offerings
Schneider Electric SE - Segment focus
SWOT

15.18 Siemens AG

Siemens AG - Overview
Siemens AG - Business segments
Siemens AG - Key news
Siemens AG - Key offerings
Siemens AG - Segment focus
SWOT

16. Appendix

16.1 Scope of the report

Market definition
Objectives
Notes and caveats

16.2 Inclusions and exclusions checklist

Inclusions checklist
Exclusions checklist

16.3 Currency conversion rates for US$

16.4 Research methodology

16.5 Data procurement

Information sources

16.6 Data validation

16.7 Validation techniques employed for market sizing

16.8 Data synthesis

16.9 360 degree market analysis

16.10 List of abbreviations

Research Methodology

Technavio presents a detailed picture of the market by way of study, synthesis, and summation of data from multiple sources. The analysts have presented the various facets of the market with a particular focus on identifying the key industry influencers. The data thus presented is comprehensive, reliable, and the result of extensive research, both primary and secondary.

INFORMATION SOURCES

Primary sources

  • Manufacturers and suppliers
  • Channel partners
  • Industry experts
  • Strategic decision makers

Secondary sources

  • Industry journals and periodicals
  • Government data
  • Financial reports of key industry players
  • Historical data
  • Press releases

DATA ANALYSIS

Data Synthesis

  • Collation of data
  • Estimation of key figures
  • Analysis of derived insights

Data Validation

  • Triangulation with data models
  • Reference against proprietary databases
  • Corroboration with industry experts

REPORT WRITING

Qualitative

  • Market drivers
  • Market challenges
  • Market trends
  • Five forces analysis

Quantitative

  • Market size and forecast
  • Market segmentation
  • Geographical insights
  • Competitive landscape

Interested in this report?

Get your sample now to see our research methodology and insights!

Download Now

Frequently Asked Questions

Digital Twin For Discrete Manufacturing market growth will increase by USD 63121.7 million during 2026-2030.

The Digital Twin For Discrete Manufacturing market is expected to grow at a CAGR of 39% during 2026-2030.

Digital Twin For Discrete Manufacturing market is segmented by Deployment (On premises, Cloud based) End-user (Automotive manufacturing, Aerospace and defense, Industrial machinery, Electronics and semiconductor, Medical devices) Application (Predictive maintenance, Design and engineering, Production planning and scheduling, Quality management)

ABB Ltd., Amazon.com Inc., ANSYS Inc., Autodesk Inc., Bentley Systems Inc., C3.ai Inc., Dassault Systemes SE, GE Vernova Inc., Hexagon AB, Honeywell International Inc., Matterport Inc., Microsoft Corp., NVIDIA Corp., Oracle Corp., PTC Inc., Robert Bosch GmbH, Rockwell Automation Inc., SAP SE, Schneider Electric SE, Siemens AG are a few of the key vendors in the Digital Twin For Discrete Manufacturing market.

North America will register the highest growth rate of 31.7% among the other regions. Therefore, the Digital Twin For Discrete Manufacturing market in North America is expected to garner significant business opportunities for the vendors during the forecast period.

US, Canada, Mexico, China, Japan, India, South Korea, Australia, Indonesia, UK, Germany, France, Italy, The Netherlands, Spain, Saudi Arabia, UAE, South Africa, Israel, Turkey, Brazil, Argentina, Colombia

  • Acceleration of industry 4.0 and integration of Industrial Internet of Things (IIoT) is the driving factor this market.

The Digital Twin For Discrete Manufacturing market vendors should focus on grabbing business opportunities from the Deployment segment as it accounted for the largest market share in the base year.
RIA - Research AI Assistant
Ask RIA