Metaverse Market Analysis, Size, and Forecast 2026-2030: North America (US, Canada, and Mexico), Europe (Germany, UK, and France), APAC (China, Japan, and South Korea), South America (Brazil and Argentina), Middle East and Africa (UAE, Saudi Arabia, and South Africa), and Rest of World (ROW)

Metaverse Market Analysis, Size, and Forecast 2026-2030:
North America (US, Canada, and Mexico), Europe (Germany, UK, and France), APAC (China, Japan, and South Korea), South America (Brazil and Argentina), Middle East and Africa (UAE, Saudi Arabia, and South Africa), and Rest of World (ROW)

Published: Apr 2026 295 Pages SKU: IRTNTR73237

Market Overview at a Glance

$633.75 B
Market Opportunity
40.4%
CAGR 2025 - 2030
41%
North America Growth
$63.84 B
VR and AR devices segment 2024

Metaverse Market Size 2026-2030

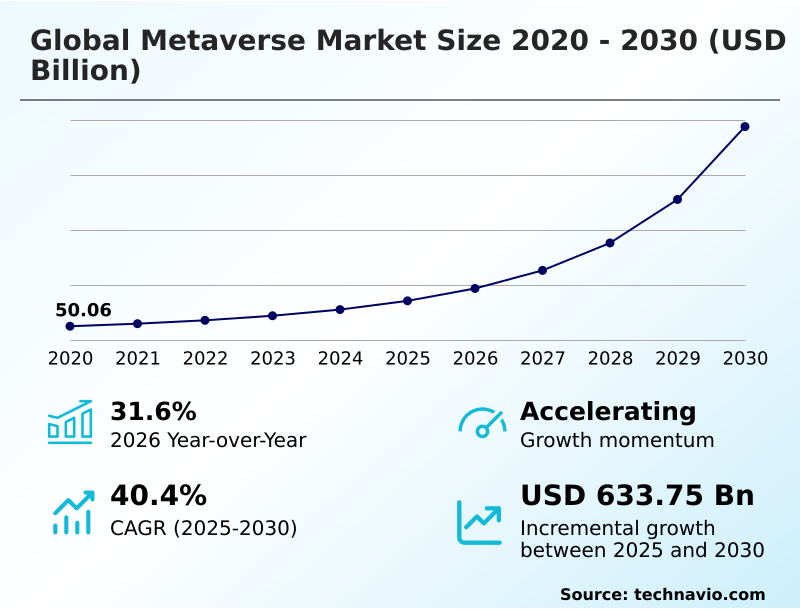
The metaverse market size is valued to increase by USD 633.75 billion, at a CAGR of 40.4% from 2025 to 2030. Acceleration of industrial digital twins and operational simulation will drive the metaverse market.

Major Market Trends & Insights

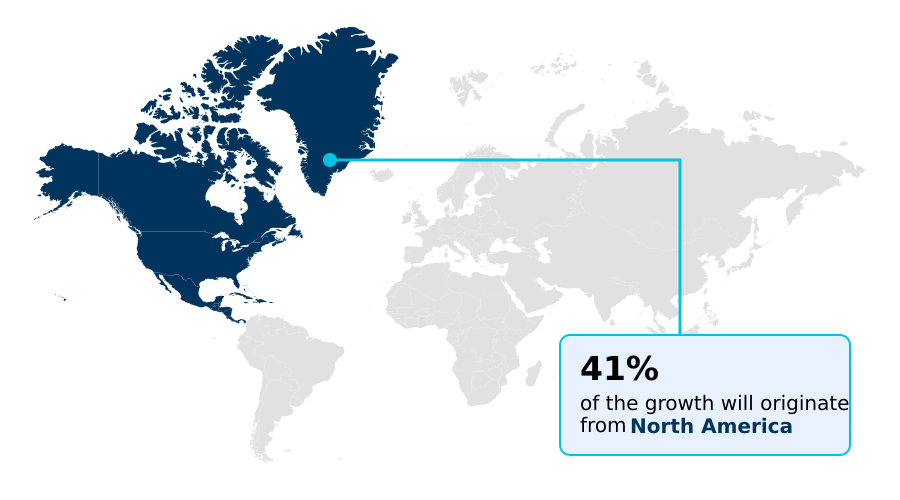
  • North America dominated the market and accounted for a 41% growth during the forecast period.
  • By Device - VR and AR devices segment was valued at USD 63.84 billion in 2024
  • By Component - Hardware segment accounted for the largest market revenue share in 2024

Market Size & Forecast

  • Market Opportunities: USD 726.07 billion
  • Market Future Opportunities: USD 633.75 billion
  • CAGR from 2025 to 2030 : 40.4%

Market Summary

  • The metaverse market is undergoing a significant transformation, moving beyond consumer-centric entertainment to establish robust, utility-driven ecosystems for enterprise and industrial sectors. This evolution is defined by the convergence of advanced technologies, including spatial computing, generative AI, and decentralized frameworks, which collectively enable the creation of persistent, interconnected virtual environments.
  • The focus has shifted toward developing high-value applications that deliver measurable returns, such as the use of digital twins in manufacturing. For instance, a firm can simulate its entire supply chain in a high-fidelity virtual replica, using predictive analytics to identify potential disruptions and optimize logistics, thereby reducing downtime and improving operational resilience.
  • While the industrial metaverse gains traction, challenges surrounding interoperability between proprietary platforms and the need for robust data governance and privacy protocols remain. The development of interoperable digital identities and cross-platform compatibility is critical for fostering a unified digital economy.
  • As hardware like mixed reality headsets becomes more accessible and powerful, and AI automates complex content creation, the market is positioned for broader adoption across diverse industries, solidifying its role as the next iteration of the internet.

What will be the Size of the Metaverse Market during the forecast period?

Get Key Insights on Market Forecast (PDF) Get Free Sample

How is the Metaverse Market Segmented?

The metaverse industry research report provides comprehensive data (region-wise segment analysis), with forecasts and estimates in "USD million" for the period 2026-2030, as well as historical data from 2020-2024 for the following segments.
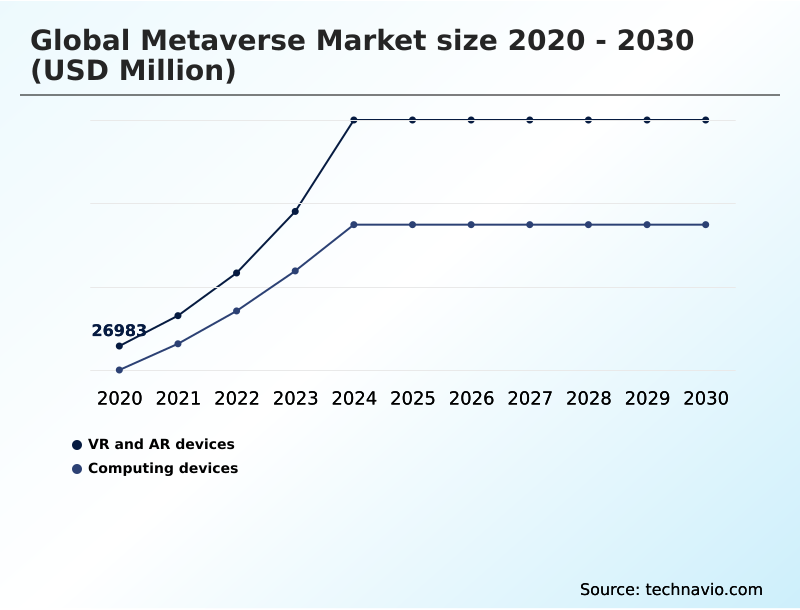
  • Device
    • VR and AR devices
    • Computing devices
  • Component
    • Hardware
    • Software
    • Services
  • Platform
    • Desktop
    • Mobile
    • Console
  • Geography
    • North America
      • US
      • Canada
      • Mexico
    • Europe
      • Germany
      • UK
      • France
    • APAC
      • China
      • Japan
      • South Korea
    • South America
      • Brazil
      • Argentina
    • Middle East and Africa
      • UAE
      • Saudi Arabia
      • South Africa
    • Rest of World (ROW)

By Device Insights

The vr and ar devices segment is estimated to witness significant growth during the forecast period.

The virtual reality (VR) and augmented reality (AR) devices segment is the primary hardware gateway for the metaverse market, shifting from tethered systems to standalone, high-performance headsets with advanced spatial computing.

These devices are now distinct computing platforms facilitating immersive interaction through high-resolution displays, foveated rendering, and sophisticated sensor arrays for eye and hand tracking.

The proliferation is driven by declining micro-OLED component costs and AI integration at the silicon level, optimizing battery life.

A key trend is the institutionalization of the industrial metaverse, where high-fidelity digital twins allow organizations to simulate and optimize physical assets in a risk-free virtual environment.

By integrating real-time sensor data with physics-based rendering engines, enterprises can conduct complex engineering tests and logistical simulations.

The synergy between industrial automation and spatial computing ensures the metaverse serves as a foundational layer for the next stage of global manufacturing and urban planning, reducing research and development costs.

Get Free Sample

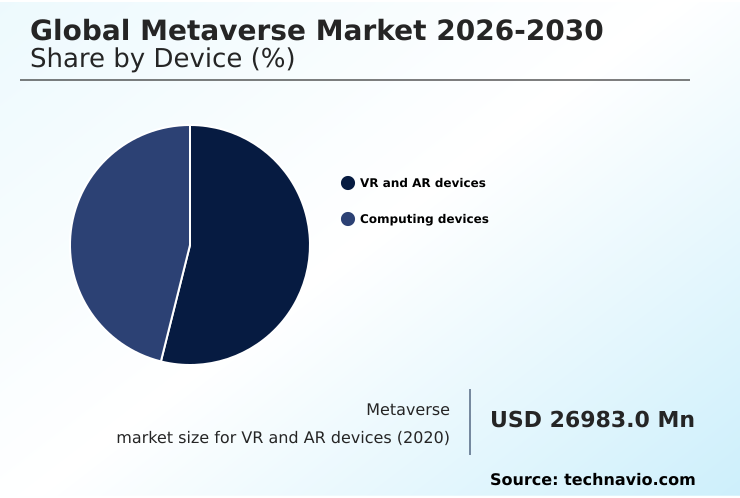
The VR and AR devices segment was valued at USD 63.84 billion in 2024 and showed a gradual increase during the forecast period.

Get Free Sample

Regional Analysis

North America is estimated to contribute 41% to the growth of the global market during the forecast period.Technavio’s analysts have elaborately explained the regional trends and drivers that shape the market during the forecast period.

See How Metaverse Market Demand is Rising in North America Get Free Sample

The geographic landscape of the metaverse market is diverse, with distinct regional specializations.

North America, contributing over 41% of the market opportunity, leads in enterprise adoption and venture capital investment, with a strong focus on the industrial metaverse and professional collaboration tools.

Europe is distinguished by its emphasis on regulatory governance, such as GDPR, and its leadership in industrial applications, particularly in Germany's automotive and manufacturing sectors. The region's commitment to data sovereignty and digital privacy shapes platform development.

Meanwhile, APAC is the fastest-growing region, driven by its massive, mobile-first user base and government support for digital infrastructure in countries like South Korea and China.

With a regional CAGR in the Middle East and Africa projected at 41.7%, nations like the UAE are making substantial investments in smart cities and virtual government services.

These regional dynamics highlight a global market that is simultaneously converging on core technologies and diverging in its application and regulatory priorities.
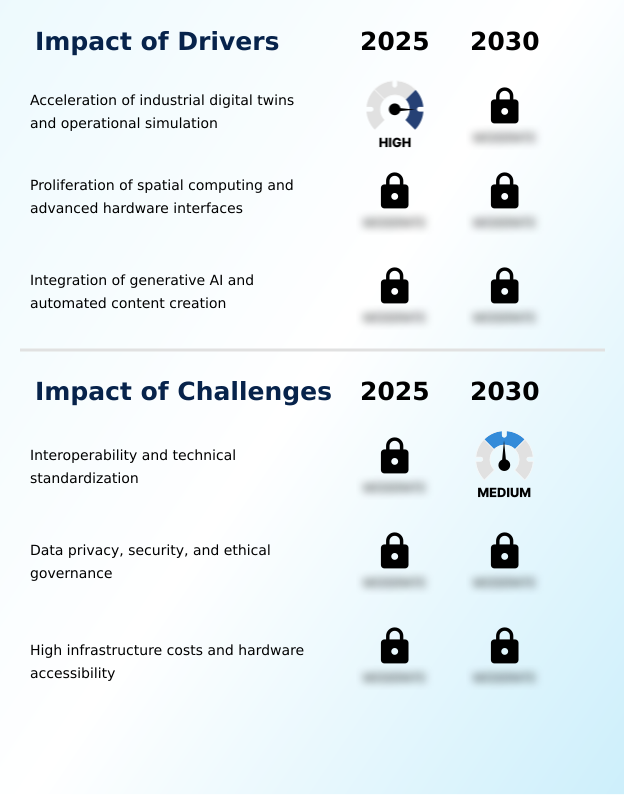
Market Dynamics

Our researchers analyzed the data with 2025 as the base year, along with the key drivers, trends, and challenges. A holistic analysis of drivers will help companies refine their marketing strategies to gain a competitive advantage.

  • The evolution of the metaverse is contingent on solving complex technical and governance challenges. Establishing decentralized governance in virtual worlds is a primary focus, ensuring that platforms are not controlled by single entities. This is closely tied to the role of DAOs in platform governance, which empowers users with decision-making authority.
  • The creator economy in decentralized platforms thrives on this model, but it also necessitates robust security protocols for virtual economies to prevent digital asset fraud. A key enabler for creators is the use of generative AI for 3D content creation, which automates the development of complex assets.
  • Concurrently, industrial metaverse digital twin simulation is revolutionizing manufacturing, allowing for real-time simulation with digital twins for predictive maintenance and operational planning.These simulations rely on high-fidelity rendering for VR and advancements in haptic feedback for immersive experiences, delivering a tangible sense of presence.
  • The success of these interconnected systems depends on spatial computing hardware advancements and the establishment of interoperability standards for metaverse platforms. Standardizing 3D asset formats and ensuring blockchain for digital asset verification are critical for a seamless user experience.
  • Virtual collaboration in enterprise settings is becoming more common, powered by enterprise applications for mixed reality and AI-driven avatars for social interaction. However, this raises concerns about user data privacy in immersive environments. The challenges of building persistent worlds are significant, particularly concerning the impact of edge computing on latency, as high-speed, responsive interaction is non-negotiable for all applications.

What are the key market drivers leading to the rise in the adoption of Metaverse Industry?

  • The acceleration of industrial digital twins and operational simulation capabilities is a key driver for market growth.

  • A primary driver for the global metaverse market is the rapid advancement and commercial availability of spatial computing hardware.
  • This includes a new generation of mixed reality headsets and augmented reality glasses with significantly improved ergonomics, higher display resolutions, and more intuitive user interfaces.
  • These devices are the main gateway for users to engage with 3D digital content, bridging the gap between flat-screen interactions and fully immersive experiences.
  • The integration of advanced eye-tracking, hand gesture recognition, and spatial audio creates a more natural user experience. This technological leap has expanded the market from gaming enthusiasts to a broad spectrum of professional users.
  • In regions like North America and APAC, high-performance devices have catalyzed the development of specialized software for architecture, healthcare, and remote collaboration.
  • As hardware becomes more capable of blending digital layers with the physical environment, the utility of the metaverse increases beyond entertainment into daily productivity.

What are the market trends shaping the Metaverse Industry?

  • The rise of the industrial metaverse, characterized by the adoption of high-fidelity digital twins, is a significant market trend. This development signals a shift toward practical, data-driven applications in virtual environments.

  • A defining trend in the global metaverse market is the deep integration of generative artificial intelligence into the foundational architecture of virtual worlds. This technology revolutionizes how virtual spaces are built, moving away from static scenes toward dynamic, responsive environments.
  • Generative AI tools empower both developers and users to create complex 3D assets, high-resolution textures, and interactive non-player characters using simple language prompts. This automation drastically reduces the time and capital required to expand the digital frontier, making it feasible for smaller enterprises to establish a robust virtual presence.
  • In the consumer segment, this trend manifests as hyper-personalized experiences where the virtual environment adapts in real-time to user behaviors, fostering a higher level of immersion. This trend is particularly strong in the APAC region, where a vibrant developer ecosystem is leveraging AI to create massive, scalable social metaverses.

What challenges does the Metaverse Industry face during its growth?

  • A lack of interoperability and technical standardization presents a key challenge affecting the industry's growth trajectory.

  • The absence of universal technical standards is a significant structural challenge hindering the seamless expansion of the global metaverse market. The market is currently fragmented into numerous proprietary ecosystems, often called 'walled gardens,' where digital assets, avatars, and identity credentials cannot be easily transferred between platforms.
  • This lack of interoperability stifles the network effects necessary for a unified digital economy, as users are forced to manage multiple accounts and repurchase assets across different virtual environments. For developers, creating content compatible with varying hardware requirements and software engines increases development costs and time-to-market.
  • Furthermore, the high computational demands for real-time, low-latency rendering in decentralized environments put immense pressure on existing network infrastructures, especially in regions with developing digital connectivity. Without a consensus on open standards, the metaverse risks becoming a collection of isolated islands rather than a cohesive digital frontier.

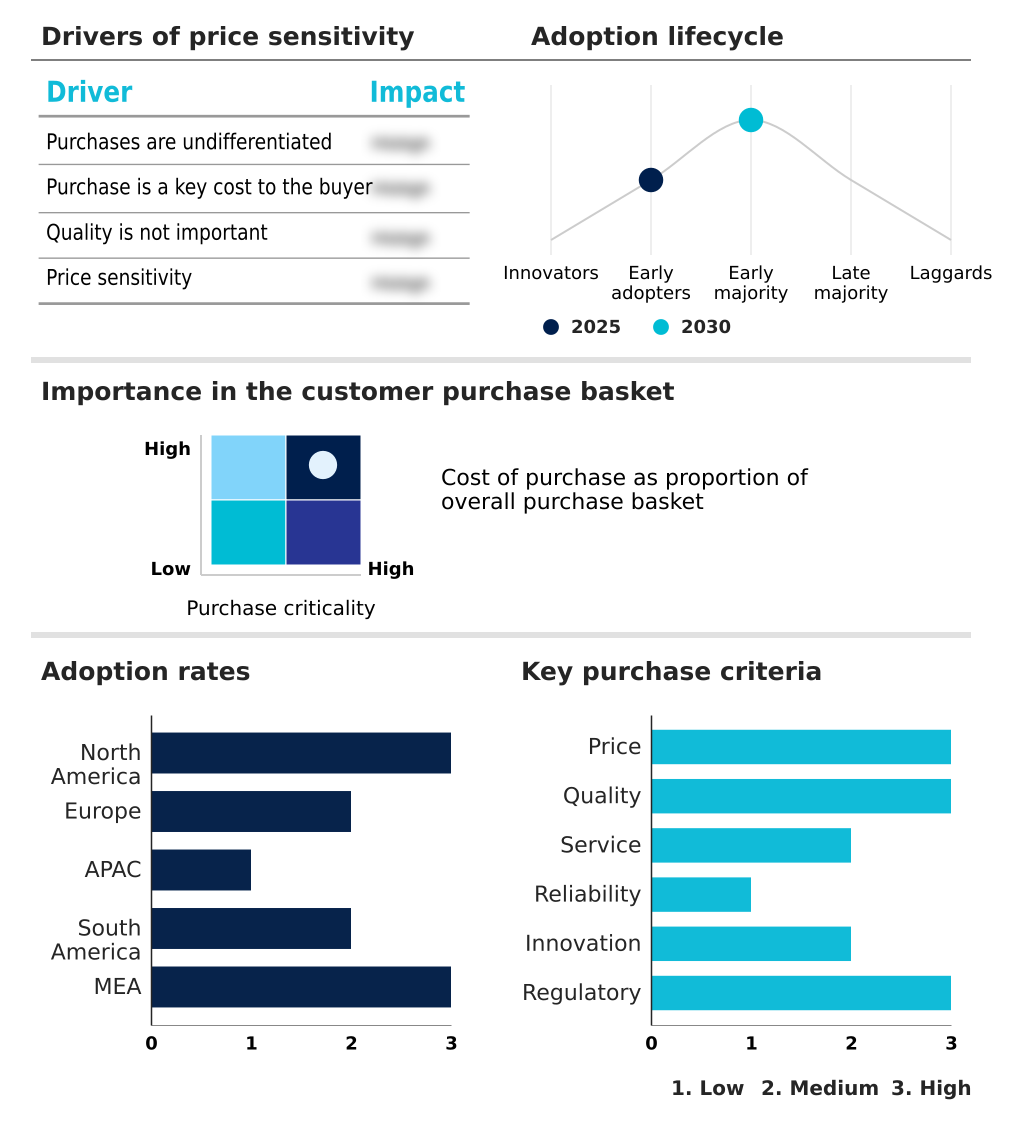
Exclusive Technavio Analysis on Customer Landscape

The metaverse market forecasting report includes the adoption lifecycle of the market, covering from the innovator’s stage to the laggard’s stage. It focuses on adoption rates in different regions based on penetration. Furthermore, the metaverse market report also includes key purchase criteria and drivers of price sensitivity to help companies evaluate and develop their market growth analysis strategies.

Customer Landscape of Metaverse Industry

Competitive Landscape

Companies are implementing various strategies, such as strategic alliances, metaverse market forecast, partnerships, mergers and acquisitions, geographical expansion, and product/service launches, to enhance their presence in the industry.

Accenture Plc - Delivers immersive enterprise services, facilitating virtual collaboration and comprehensive digital transformation for organizational growth.

The industry research and growth report includes detailed analyses of the competitive landscape of the market and information about key companies, including:

  • Accenture Plc
  • Animoca Brands Corp. Ltd.
  • Apple Inc.
  • ByteDance Ltd.
  • Decentraland Foundation
  • Electronic Arts Inc.
  • Epic Games Inc.
  • HTC Corp.
  • Magic Leap Inc.
  • Meta Platforms Inc.
  • Microsoft Corp.
  • NetEase Inc.
  • NVIDIA Corp.
  • Qualcomm Inc.
  • Roblox Corp.
  • Samsung Electronics Co. Ltd.
  • Sony Group Corp.
  • Tencent Holdings Ltd.
  • Unity Technologies Inc.
  • Verizon Communications Inc.

Qualitative and quantitative analysis of companies has been conducted to help clients understand the wider business environment as well as the strengths and weaknesses of key industry players. Data is qualitatively analyzed to categorize companies as pure play, category-focused, industry-focused, and diversified; it is quantitatively analyzed to categorize companies as dominant, leading, strong, tentative, and weak.

Recent Development and News in Metaverse market

  • In September, 2024, The Metaverse Standards Forum released the Interoperability Protocol 2.0 framework, a critical step toward establishing common ground for 3D asset formats and identity management across major platforms, aiming to lower barriers for cross-platform commerce.
  • In November, 2024, Meta Platforms strategically pivoted to a mixed-reality-first approach for its Horizon OS, launching the Meta Horizon Studio and Engine to empower a broader community of third-party developers for mobile and headset-based virtual experiences.
  • In January, 2025, Siemens and NVIDIA expanded their strategic partnership to develop an Industrial AI Operating System, integrating the Siemens Xcelerator platform with NVIDIA Omniverse to create a unified environment for autonomous digital twins and revolutionize the industrial value chain.
  • In March, 2025, The European Parliament reached a political agreement on amendments to the EU Artificial Intelligence Act, introducing strict prohibitions on non-consensual digital replicas and mandating higher transparency for AI-driven avatars that interact with human users in immersive environments.

Dive into Technavio’s robust research methodology, blending expert interviews, extensive data synthesis, and validated models for unparalleled Metaverse Market insights. See full methodology.

Market Scope
Page number 295
Base year 2025
Historic period 2020-2024
Forecast period 2026-2030
Growth momentum & CAGR Accelerate at a CAGR of 40.4%
Market growth 2026-2030 USD 633754.4 million
Market structure Fragmented
YoY growth 2025-2026(%) 31.6%
Key countries US, Canada, Mexico, Germany, UK, France, Italy, Spain, The Netherlands, China, Japan, South Korea, India, Australia, Indonesia, Brazil, Argentina, Chile, UAE, Saudi Arabia, South Africa, Israel and Turkey
Competitive landscape Leading Companies, Market Positioning of Companies, Competitive Strategies, and Industry Risks

Request Free Sample

Research Analyst Overview

  • The metaverse market is transitioning from a speculative concept to a tangible layer of the digital economy, driven by the convergence of foundational technologies. The integration of spatial computing, generative AI, and haptic feedback is enabling the creation of persistent virtual spaces that offer both immersive social experiences and high-utility enterprise solutions.
  • These platforms are powered by sophisticated physics-based rendering and real-time 3D creation tools, supported by an infrastructure that includes edge computing and neural processing units to ensure low-latency rendering. A critical boardroom-level consideration is the development of interoperable digital identities, as this strategy is essential for mitigating the risks of vendor lock-in within proprietary ecosystems.
  • The market is also addressing the need for decentralized applications and blockchain technology to secure transactions and verify ownership of digital assets. In industrial settings, the use of photorealistic environments for digital twins has demonstrated a 40% reduction in error rates for complex manual tasks, highlighting the technology's capacity to deliver measurable operational improvements.
  • As mixed reality headsets and augmented reality glasses become more advanced and accessible, the market is poised to move beyond niche applications toward widespread adoption.

What are the Key Data Covered in this Metaverse Market Research and Growth Report?

  • What is the expected growth of the Metaverse Market between 2026 and 2030?

    • USD 633.75 billion, at a CAGR of 40.4%

  • What segmentation does the market report cover?

    • The report is segmented by Device (VR and AR devices, and Computing devices), Component (Hardware, Software, and Services), Platform (Desktop, Mobile, and Console) and Geography (North America, Europe, APAC, South America, Middle East and Africa)

  • Which regions are analyzed in the report?

    • North America, Europe, APAC, South America and Middle East and Africa

  • What are the key growth drivers and market challenges?

    • Acceleration of industrial digital twins and operational simulation, Interoperability and technical standardization

  • Who are the major players in the Metaverse Market?

    • Accenture Plc, Animoca Brands Corp. Ltd., Apple Inc., ByteDance Ltd., Decentraland Foundation, Electronic Arts Inc., Epic Games Inc., HTC Corp., Magic Leap Inc., Meta Platforms Inc., Microsoft Corp., NetEase Inc., NVIDIA Corp., Qualcomm Inc., Roblox Corp., Samsung Electronics Co. Ltd., Sony Group Corp., Tencent Holdings Ltd., Unity Technologies Inc. and Verizon Communications Inc.

Market Research Insights

  • The metaverse market's dynamics are shaped by the interplay between rapid technological advancement and significant adoption hurdles. The integration of generative AI is a key driver, enabling the creation of dynamic virtual environments and automated content generation, which significantly reduces development costs.
  • Proliferation of spatial computing and advanced hardware interfaces, including mixed reality headsets and augmented reality glasses, is expanding the user base beyond gaming into professional applications. However, challenges such as the lack of interoperability and technical standardization create fragmented ecosystems, or 'walled gardens,' limiting the seamless transfer of digital assets and identities.
  • The high cost of hardware and the requirement for intensive cloud infrastructure create a digital divide, particularly in emerging economies. This balance of innovation and constraint defines the strategic landscape for companies navigating the transition to immersive digital economies.

We can help! Our analysts can customize this metaverse market research report to meet your requirements.

Get in touch

1. Executive Summary

1.1 Market overview

Executive Summary - Chart on Market Overview
Executive Summary - Data Table on Market Overview
Executive Summary - Chart on Global Market Characteristics
Executive Summary - Chart on Market by Geography
Executive Summary - Chart on Market Segmentation by Device
Executive Summary - Chart on Market Segmentation by Component
Executive Summary - Chart on Market Segmentation by Platform
Executive Summary - Chart on Incremental Growth
Executive Summary - Data Table on Incremental Growth
Executive Summary - Chart on Company Market Positioning

2. Technavio Analysis

2.1 Analysis of price sensitivity, lifecycle, customer purchase basket, adoption rates, and purchase criteria

2.2 Criticality of inputs and Factors of differentiation

Chart on Overview on criticality of inputs and factors of differentiation

2.3 Factors of disruption

Chart on Overview on factors of disruption

2.4 Impact of drivers and challenges

Chart on Impact of drivers and challenges in 2025 and 2030

3. Market Landscape

3.1 Market ecosystem

Chart on Parent Market
Data Table on - Parent Market

3.2 Market characteristics

Chart on Market characteristics analysis

3.3 Value chain analysis

Chart on Value chain analysis

4. Market Sizing

4.1 Market definition

Data Table on Offerings of companies included in the market definition

4.2 Market segment analysis

Market segments

4.3 Market size 2025

4.4 Market outlook: Forecast for 2025-2030

Chart on Global - Market size and forecast 2025-2030 ($ million)
Data Table on Global - Market size and forecast 2025-2030 ($ million)
Chart on Global Market: Year-over-year growth 2025-2030 (%)
Data Table on Global Market: Year-over-year growth 2025-2030 (%)

5. Historic Market Size

5.1 Global Metaverse Market 2020 - 2024

Historic Market Size - Data Table on Global Metaverse Market 2020 - 2024 ($ million)

5.2 Device segment analysis 2020 - 2024

Historic Market Size - Device Segment 2020 - 2024 ($ million)

5.3 Component segment analysis 2020 - 2024

Historic Market Size - Component Segment 2020 - 2024 ($ million)

5.4 Platform segment analysis 2020 - 2024

Historic Market Size - Platform Segment 2020 - 2024 ($ million)

5.5 Geography segment analysis 2020 - 2024

Historic Market Size - Geography Segment 2020 - 2024 ($ million)

5.6 Country segment analysis 2020 - 2024

Historic Market Size - Country Segment 2020 - 2024 ($ million)

6. Qualitative Analysis

6.1 Impact of AI on global metaverse market

6.2 Impact of geopolitical conflicts on global metaverse market

7. Five Forces Analysis

7.1 Five forces summary

Five forces analysis - Comparison between 2025 and 2030

7.2 Bargaining power of buyers

Bargaining power of buyers - Impact of key factors 2025 and 2030

7.3 Bargaining power of suppliers

Bargaining power of suppliers - Impact of key factors in 2025 and 2030

7.4 Threat of new entrants

Threat of new entrants - Impact of key factors in 2025 and 2030

7.5 Threat of substitutes

Threat of substitutes - Impact of key factors in 2025 and 2030

7.6 Threat of rivalry

Threat of rivalry - Impact of key factors in 2025 and 2030

7.7 Market condition

Chart on Market condition - Five forces 2025 and 2030

8. Market Segmentation by Device

8.1 Market segments

Chart on Device - Market share 2025-2030 (%)
Data Table on Device - Market share 2025-2030 (%)

8.2 Comparison by Device

Chart on Comparison by Device
Data Table on Comparison by Device

8.3 VR and AR devices - Market size and forecast 2025-2030

Chart on VR and AR devices - Market size and forecast 2025-2030 ($ million)
Data Table on VR and AR devices - Market size and forecast 2025-2030 ($ million)
Chart on VR and AR devices - Year-over-year growth 2025-2030 (%)
Data Table on VR and AR devices - Year-over-year growth 2025-2030 (%)

8.4 Computing devices - Market size and forecast 2025-2030

Chart on Computing devices - Market size and forecast 2025-2030 ($ million)
Data Table on Computing devices - Market size and forecast 2025-2030 ($ million)
Chart on Computing devices - Year-over-year growth 2025-2030 (%)
Data Table on Computing devices - Year-over-year growth 2025-2030 (%)

8.5 Market opportunity by Device

Market opportunity by Device ($ million)
Data Table on Market opportunity by Device ($ million)

9. Market Segmentation by Component

9.1 Market segments

Chart on Component - Market share 2025-2030 (%)
Data Table on Component - Market share 2025-2030 (%)

9.2 Comparison by Component

Chart on Comparison by Component
Data Table on Comparison by Component

9.3 Hardware - Market size and forecast 2025-2030

Chart on Hardware - Market size and forecast 2025-2030 ($ million)
Data Table on Hardware - Market size and forecast 2025-2030 ($ million)
Chart on Hardware - Year-over-year growth 2025-2030 (%)
Data Table on Hardware - Year-over-year growth 2025-2030 (%)

9.4 Software - Market size and forecast 2025-2030

Chart on Software - Market size and forecast 2025-2030 ($ million)
Data Table on Software - Market size and forecast 2025-2030 ($ million)
Chart on Software - Year-over-year growth 2025-2030 (%)
Data Table on Software - Year-over-year growth 2025-2030 (%)

9.5 Services - Market size and forecast 2025-2030

Chart on Services - Market size and forecast 2025-2030 ($ million)
Data Table on Services - Market size and forecast 2025-2030 ($ million)
Chart on Services - Year-over-year growth 2025-2030 (%)
Data Table on Services - Year-over-year growth 2025-2030 (%)

9.6 Market opportunity by Component

Market opportunity by Component ($ million)
Data Table on Market opportunity by Component ($ million)

10. Market Segmentation by Platform

10.1 Market segments

Chart on Platform - Market share 2025-2030 (%)
Data Table on Platform - Market share 2025-2030 (%)

10.2 Comparison by Platform

Chart on Comparison by Platform
Data Table on Comparison by Platform

10.3 Desktop - Market size and forecast 2025-2030

Chart on Desktop - Market size and forecast 2025-2030 ($ million)
Data Table on Desktop - Market size and forecast 2025-2030 ($ million)
Chart on Desktop - Year-over-year growth 2025-2030 (%)
Data Table on Desktop - Year-over-year growth 2025-2030 (%)

10.4 Mobile - Market size and forecast 2025-2030

Chart on Mobile - Market size and forecast 2025-2030 ($ million)
Data Table on Mobile - Market size and forecast 2025-2030 ($ million)
Chart on Mobile - Year-over-year growth 2025-2030 (%)
Data Table on Mobile - Year-over-year growth 2025-2030 (%)

10.5 Console - Market size and forecast 2025-2030

Chart on Console - Market size and forecast 2025-2030 ($ million)
Data Table on Console - Market size and forecast 2025-2030 ($ million)
Chart on Console - Year-over-year growth 2025-2030 (%)
Data Table on Console - Year-over-year growth 2025-2030 (%)

10.6 Market opportunity by Platform

Market opportunity by Platform ($ million)
Data Table on Market opportunity by Platform ($ million)

11. Customer Landscape

11.1 Customer landscape overview

Analysis of price sensitivity, lifecycle, customer purchase basket, adoption rates, and purchase criteria

12. Geographic Landscape

12.1 Geographic segmentation

Chart on Market share by geography 2025-2030 (%)
Data Table on Market share by geography 2025-2030 (%)

12.2 Geographic comparison

Chart on Geographic comparison
Data Table on Geographic comparison

12.3 North America - Market size and forecast 2025-2030

Chart on North America - Market size and forecast 2025-2030 ($ million)
Data Table on North America - Market size and forecast 2025-2030 ($ million)
Chart on North America - Year-over-year growth 2025-2030 (%)
Data Table on North America - Year-over-year growth 2025-2030 (%)
Chart on Regional Comparison - North America
Data Table on Regional Comparison - North America

12.3.1 US - Market size and forecast 2025-2030

Chart on US - Market size and forecast 2025-2030 ($ million)
Data Table on US - Market size and forecast 2025-2030 ($ million)
Chart on US - Year-over-year growth 2025-2030 (%)
Data Table on US - Year-over-year growth 2025-2030 (%)

12.3.2 Canada - Market size and forecast 2025-2030

Chart on Canada - Market size and forecast 2025-2030 ($ million)
Data Table on Canada - Market size and forecast 2025-2030 ($ million)
Chart on Canada - Year-over-year growth 2025-2030 (%)
Data Table on Canada - Year-over-year growth 2025-2030 (%)

12.3.3 Mexico - Market size and forecast 2025-2030

Chart on Mexico - Market size and forecast 2025-2030 ($ million)
Data Table on Mexico - Market size and forecast 2025-2030 ($ million)
Chart on Mexico - Year-over-year growth 2025-2030 (%)
Data Table on Mexico - Year-over-year growth 2025-2030 (%)

12.4 Europe - Market size and forecast 2025-2030

Chart on Europe - Market size and forecast 2025-2030 ($ million)
Data Table on Europe - Market size and forecast 2025-2030 ($ million)
Chart on Europe - Year-over-year growth 2025-2030 (%)
Data Table on Europe - Year-over-year growth 2025-2030 (%)
Chart on Regional Comparison - Europe
Data Table on Regional Comparison - Europe

12.4.1 Germany - Market size and forecast 2025-2030

Chart on Germany - Market size and forecast 2025-2030 ($ million)
Data Table on Germany - Market size and forecast 2025-2030 ($ million)
Chart on Germany - Year-over-year growth 2025-2030 (%)
Data Table on Germany - Year-over-year growth 2025-2030 (%)

12.4.2 UK - Market size and forecast 2025-2030

Chart on UK - Market size and forecast 2025-2030 ($ million)
Data Table on UK - Market size and forecast 2025-2030 ($ million)
Chart on UK - Year-over-year growth 2025-2030 (%)
Data Table on UK - Year-over-year growth 2025-2030 (%)

12.4.3 France - Market size and forecast 2025-2030

Chart on France - Market size and forecast 2025-2030 ($ million)
Data Table on France - Market size and forecast 2025-2030 ($ million)
Chart on France - Year-over-year growth 2025-2030 (%)
Data Table on France - Year-over-year growth 2025-2030 (%)

12.4.4 Italy - Market size and forecast 2025-2030

Chart on Italy - Market size and forecast 2025-2030 ($ million)
Data Table on Italy - Market size and forecast 2025-2030 ($ million)
Chart on Italy - Year-over-year growth 2025-2030 (%)
Data Table on Italy - Year-over-year growth 2025-2030 (%)

12.4.5 Spain - Market size and forecast 2025-2030

Chart on Spain - Market size and forecast 2025-2030 ($ million)
Data Table on Spain - Market size and forecast 2025-2030 ($ million)
Chart on Spain - Year-over-year growth 2025-2030 (%)
Data Table on Spain - Year-over-year growth 2025-2030 (%)

12.4.6 The Netherlands - Market size and forecast 2025-2030

Chart on The Netherlands - Market size and forecast 2025-2030 ($ million)
Data Table on The Netherlands - Market size and forecast 2025-2030 ($ million)
Chart on The Netherlands - Year-over-year growth 2025-2030 (%)
Data Table on The Netherlands - Year-over-year growth 2025-2030 (%)

12.5 APAC - Market size and forecast 2025-2030

Chart on APAC - Market size and forecast 2025-2030 ($ million)
Data Table on APAC - Market size and forecast 2025-2030 ($ million)
Chart on APAC - Year-over-year growth 2025-2030 (%)
Data Table on APAC - Year-over-year growth 2025-2030 (%)
Chart on Regional Comparison - APAC
Data Table on Regional Comparison - APAC

12.5.1 China - Market size and forecast 2025-2030

Chart on China - Market size and forecast 2025-2030 ($ million)
Data Table on China - Market size and forecast 2025-2030 ($ million)
Chart on China - Year-over-year growth 2025-2030 (%)
Data Table on China - Year-over-year growth 2025-2030 (%)

12.5.2 Japan - Market size and forecast 2025-2030

Chart on Japan - Market size and forecast 2025-2030 ($ million)
Data Table on Japan - Market size and forecast 2025-2030 ($ million)
Chart on Japan - Year-over-year growth 2025-2030 (%)
Data Table on Japan - Year-over-year growth 2025-2030 (%)

12.5.3 South Korea - Market size and forecast 2025-2030

Chart on South Korea - Market size and forecast 2025-2030 ($ million)
Data Table on South Korea - Market size and forecast 2025-2030 ($ million)
Chart on South Korea - Year-over-year growth 2025-2030 (%)
Data Table on South Korea - Year-over-year growth 2025-2030 (%)

12.5.4 India - Market size and forecast 2025-2030

Chart on India - Market size and forecast 2025-2030 ($ million)
Data Table on India - Market size and forecast 2025-2030 ($ million)
Chart on India - Year-over-year growth 2025-2030 (%)
Data Table on India - Year-over-year growth 2025-2030 (%)

12.5.5 Australia - Market size and forecast 2025-2030

Chart on Australia - Market size and forecast 2025-2030 ($ million)
Data Table on Australia - Market size and forecast 2025-2030 ($ million)
Chart on Australia - Year-over-year growth 2025-2030 (%)
Data Table on Australia - Year-over-year growth 2025-2030 (%)

12.5.6 Indonesia - Market size and forecast 2025-2030

Chart on Indonesia - Market size and forecast 2025-2030 ($ million)
Data Table on Indonesia - Market size and forecast 2025-2030 ($ million)
Chart on Indonesia - Year-over-year growth 2025-2030 (%)
Data Table on Indonesia - Year-over-year growth 2025-2030 (%)

12.6 South America - Market size and forecast 2025-2030

Chart on South America - Market size and forecast 2025-2030 ($ million)
Data Table on South America - Market size and forecast 2025-2030 ($ million)
Chart on South America - Year-over-year growth 2025-2030 (%)
Data Table on South America - Year-over-year growth 2025-2030 (%)
Chart on Regional Comparison - South America
Data Table on Regional Comparison - South America

12.6.1 Brazil - Market size and forecast 2025-2030

Chart on Brazil - Market size and forecast 2025-2030 ($ million)
Data Table on Brazil - Market size and forecast 2025-2030 ($ million)
Chart on Brazil - Year-over-year growth 2025-2030 (%)
Data Table on Brazil - Year-over-year growth 2025-2030 (%)

12.6.2 Argentina - Market size and forecast 2025-2030

Chart on Argentina - Market size and forecast 2025-2030 ($ million)
Data Table on Argentina - Market size and forecast 2025-2030 ($ million)
Chart on Argentina - Year-over-year growth 2025-2030 (%)
Data Table on Argentina - Year-over-year growth 2025-2030 (%)

12.6.3 Chile - Market size and forecast 2025-2030

Chart on Chile - Market size and forecast 2025-2030 ($ million)
Data Table on Chile - Market size and forecast 2025-2030 ($ million)
Chart on Chile - Year-over-year growth 2025-2030 (%)
Data Table on Chile - Year-over-year growth 2025-2030 (%)

12.7 Middle East and Africa - Market size and forecast 2025-2030

Chart on Middle East and Africa - Market size and forecast 2025-2030 ($ million)
Data Table on Middle East and Africa - Market size and forecast 2025-2030 ($ million)
Chart on Middle East and Africa - Year-over-year growth 2025-2030 (%)
Data Table on Middle East and Africa - Year-over-year growth 2025-2030 (%)
Chart on Regional Comparison - Middle East and Africa
Data Table on Regional Comparison - Middle East and Africa

12.7.1 UAE - Market size and forecast 2025-2030

Chart on UAE - Market size and forecast 2025-2030 ($ million)
Data Table on UAE - Market size and forecast 2025-2030 ($ million)
Chart on UAE - Year-over-year growth 2025-2030 (%)
Data Table on UAE - Year-over-year growth 2025-2030 (%)

12.7.2 Saudi Arabia - Market size and forecast 2025-2030

Chart on Saudi Arabia - Market size and forecast 2025-2030 ($ million)
Data Table on Saudi Arabia - Market size and forecast 2025-2030 ($ million)
Chart on Saudi Arabia - Year-over-year growth 2025-2030 (%)
Data Table on Saudi Arabia - Year-over-year growth 2025-2030 (%)

12.7.3 South Africa - Market size and forecast 2025-2030

Chart on South Africa - Market size and forecast 2025-2030 ($ million)
Data Table on South Africa - Market size and forecast 2025-2030 ($ million)
Chart on South Africa - Year-over-year growth 2025-2030 (%)
Data Table on South Africa - Year-over-year growth 2025-2030 (%)

12.7.4 Israel - Market size and forecast 2025-2030

Chart on Israel - Market size and forecast 2025-2030 ($ million)
Data Table on Israel - Market size and forecast 2025-2030 ($ million)
Chart on Israel - Year-over-year growth 2025-2030 (%)
Data Table on Israel - Year-over-year growth 2025-2030 (%)

12.7.5 Turkey - Market size and forecast 2025-2030

Chart on Turkey - Market size and forecast 2025-2030 ($ million)
Data Table on Turkey - Market size and forecast 2025-2030 ($ million)
Chart on Turkey - Year-over-year growth 2025-2030 (%)
Data Table on Turkey - Year-over-year growth 2025-2030 (%)

12.8 Market opportunity by geography

Market opportunity by geography ($ million)
Data Tables on Market opportunity by geography ($ million)

13. Drivers, Challenges, and Opportunity

13.1 Market drivers

Acceleration of industrial digital twins and operational simulation
Proliferation of spatial computing and advanced hardware interfaces
Integration of generative AI and automated content creation

13.2 Market challenges

Interoperability and technical standardization
Data privacy, security, and ethical governance
High infrastructure costs and hardware accessibility

13.3 Impact of drivers and challenges

Impact of drivers and challenges in 2025 and 2030

13.4 Market opportunities

Rise of industrial metaverse and high fidelity digital twins
Integration of generative AI for dynamic content creation
Evolution toward decentralized governance and interoperable digital identities

14. Competitive Landscape

14.1 Overview

14.2

Overview on criticality of inputs and factors of differentiation

14.3 Landscape disruption

Overview on factors of disruption

14.4 Industry risks

Impact of key risks on business

15. Competitive Analysis

15.1 Companies profiled

Companies covered

15.2 Company ranking index

15.3 Market positioning of companies

Matrix on companies position and classification

15.4 Accenture Plc

Accenture Plc - Overview
Accenture Plc - Business segments
Accenture Plc - Key news
Accenture Plc - Key offerings
Accenture Plc - Segment focus
SWOT

15.5 Animoca Brands Corp. Ltd.

Animoca Brands Corp. Ltd. - Overview
Animoca Brands Corp. Ltd. - Product / Service
Animoca Brands Corp. Ltd. - Key offerings
SWOT

15.6 Apple Inc.

Apple Inc. - Overview
Apple Inc. - Business segments
Apple Inc. - Key news
Apple Inc. - Key offerings
Apple Inc. - Segment focus
SWOT

15.7 Electronic Arts Inc.

Electronic Arts Inc. - Overview
Electronic Arts Inc. - Product / Service
Electronic Arts Inc. - Key offerings
SWOT

15.8 HTC Corp.

HTC Corp. - Overview
HTC Corp. - Product / Service
HTC Corp. - Key offerings
SWOT

15.9 Meta Platforms Inc.

Meta Platforms Inc. - Overview
Meta Platforms Inc. - Business segments
Meta Platforms Inc. - Key offerings
Meta Platforms Inc. - Segment focus
SWOT

15.10 Microsoft Corp.

Microsoft Corp. - Overview
Microsoft Corp. - Business segments
Microsoft Corp. - Key news
Microsoft Corp. - Key offerings
Microsoft Corp. - Segment focus
SWOT

15.11 NetEase Inc.

NetEase Inc. - Overview
NetEase Inc. - Business segments
NetEase Inc. - Key offerings
NetEase Inc. - Segment focus
SWOT

15.12 NVIDIA Corp.

NVIDIA Corp. - Overview
NVIDIA Corp. - Business segments
NVIDIA Corp. - Key news
NVIDIA Corp. - Key offerings
NVIDIA Corp. - Segment focus
SWOT

15.13 Qualcomm Inc.

Qualcomm Inc. - Overview
Qualcomm Inc. - Business segments
Qualcomm Inc. - Key news
Qualcomm Inc. - Key offerings
Qualcomm Inc. - Segment focus
SWOT

15.14 Samsung Electronics Co. Ltd.

Samsung Electronics Co. Ltd. - Overview
Samsung Electronics Co. Ltd. - Business segments
Samsung Electronics Co. Ltd. - Key news
Samsung Electronics Co. Ltd. - Key offerings
Samsung Electronics Co. Ltd. - Segment focus
SWOT

15.15 Sony Group Corp.

Sony Group Corp. - Overview
Sony Group Corp. - Business segments
Sony Group Corp. - Key news
Sony Group Corp. - Key offerings
Sony Group Corp. - Segment focus
SWOT

15.16 Tencent Holdings Ltd.

Tencent Holdings Ltd. - Overview
Tencent Holdings Ltd. - Business segments
Tencent Holdings Ltd. - Key offerings
Tencent Holdings Ltd. - Segment focus
SWOT

15.17 Unity Technologies Inc.

Unity Technologies Inc. - Overview
Unity Technologies Inc. - Business segments
Unity Technologies Inc. - Key offerings
Unity Technologies Inc. - Segment focus
SWOT

15.18 Verizon Communications Inc.

Verizon Communications Inc. - Overview
Verizon Communications Inc. - Business segments
Verizon Communications Inc. - Key offerings
Verizon Communications Inc. - Segment focus
SWOT

16. Appendix

16.1 Scope of the report

Market definition
Objectives
Notes and caveats

16.2 Inclusions and exclusions checklist

Inclusions checklist
Exclusions checklist

16.3 Currency conversion rates for US$

16.4 Research methodology

16.5 Data procurement

Information sources

16.6 Data validation

16.7 Validation techniques employed for market sizing

16.8 Data synthesis

16.9 360 degree market analysis

16.10 List of abbreviations

Research Methodology

Technavio presents a detailed picture of the market by way of study, synthesis, and summation of data from multiple sources. The analysts have presented the various facets of the market with a particular focus on identifying the key industry influencers. The data thus presented is comprehensive, reliable, and the result of extensive research, both primary and secondary.

INFORMATION SOURCES

Primary sources

  • Manufacturers and suppliers
  • Channel partners
  • Industry experts
  • Strategic decision makers

Secondary sources

  • Industry journals and periodicals
  • Government data
  • Financial reports of key industry players
  • Historical data
  • Press releases

DATA ANALYSIS

Data Synthesis

  • Collation of data
  • Estimation of key figures
  • Analysis of derived insights

Data Validation

  • Triangulation with data models
  • Reference against proprietary databases
  • Corroboration with industry experts

REPORT WRITING

Qualitative

  • Market drivers
  • Market challenges
  • Market trends
  • Five forces analysis

Quantitative

  • Market size and forecast
  • Market segmentation
  • Geographical insights
  • Competitive landscape

Interested in this report?

Get your sample now to see our research methodology and insights!

Download Now

Frequently Asked Questions

Metaverse market growth will increase by USD 633754.4 million during 2026-2030.

The Metaverse market is expected to grow at a CAGR of 40.4% during 2026-2030.

Metaverse market is segmented by Device (VR and AR devices, Computing devices) Component (Hardware, Software, Services) Platform (Desktop, Mobile, Console)

Accenture Plc, Animoca Brands Corp. Ltd., Apple Inc., ByteDance Ltd., Decentraland Foundation, Electronic Arts Inc., Epic Games Inc., HTC Corp., Magic Leap Inc., Meta Platforms Inc., Microsoft Corp., NetEase Inc., NVIDIA Corp., Qualcomm Inc., Roblox Corp., Samsung Electronics Co. Ltd., Sony Group Corp., Tencent Holdings Ltd., Unity Technologies Inc., Verizon Communications Inc. are a few of the key vendors in the Metaverse market.

North America will register the highest growth rate of 41% among the other regions. Therefore, the Metaverse market in North America is expected to garner significant business opportunities for the vendors during the forecast period.

US, Canada, Mexico, Germany, UK, France, Italy, Spain, The Netherlands, China, Japan, South Korea, India, Australia, Indonesia, Brazil, Argentina, Chile, UAE, Saudi Arabia, South Africa, Israel, Turkey

  • Acceleration of industrial digital twins and operational simulation is the driving factor this market.

The Metaverse market vendors should focus on grabbing business opportunities from the Device segment as it accounted for the largest market share in the base year.
RIA - Research AI Assistant
Ask RIA