Disaster Recovery-as-a-service (draas) Market Analysis, Size, and Forecast 2026-2030: North America (US, Canada, and Mexico), APAC (China, Japan, and India), Europe (UK, Germany, and France), South America (Brazil and Argentina), Middle East and Africa (Saudi Arabia, UAE, and South Africa), and Rest of World (ROW)

Disaster Recovery-as-a-service (draas) Market Analysis, Size, and Forecast 2026-2030:
North America (US, Canada, and Mexico), APAC (China, Japan, and India), Europe (UK, Germany, and France), South America (Brazil and Argentina), Middle East and Africa (Saudi Arabia, UAE, and South Africa), and Rest of World (ROW)

Published: Mar 2026 296 Pages SKU: IRTNTR43407

Market Overview at a Glance

$22.37 B
Market Opportunity
12%
CAGR 2025 - 2030
29.8%
APAC Growth
$11.22 B
Public cloud segment 2024

Disaster Recovery-as-a-service (draas) Market Size 2026-2030

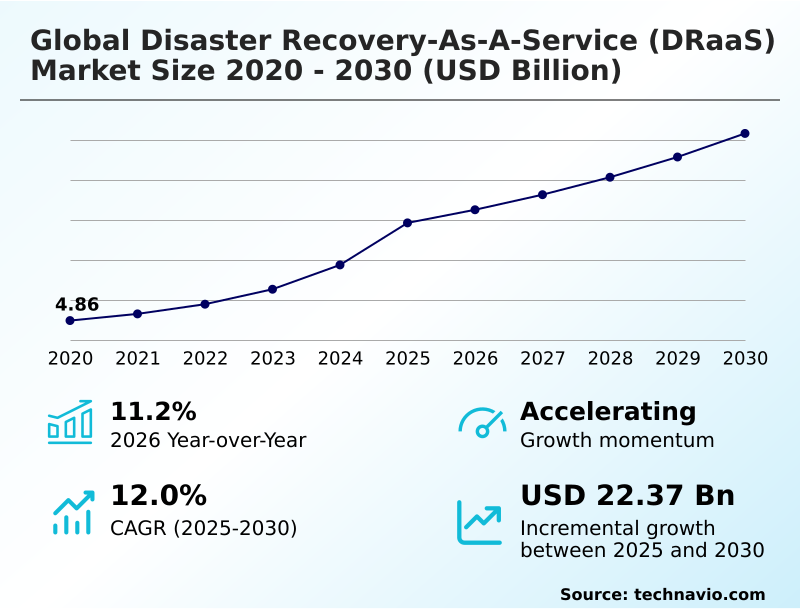
The disaster recovery-as-a-service (draas) market size is valued to increase by USD 22.37 billion, at a CAGR of 12% from 2025 to 2030. Digital transformation and cloud adoption as a foundation for business continuity will drive the disaster recovery-as-a-service (draas) market.

Major Market Trends & Insights

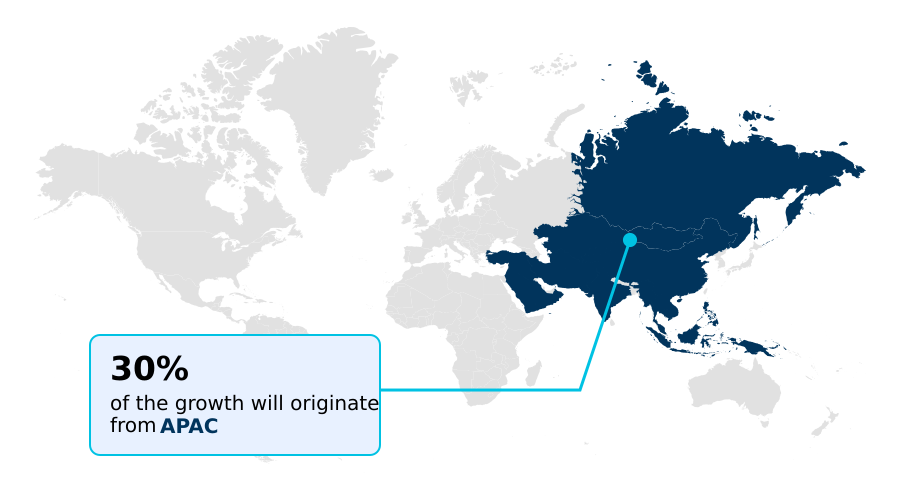
  • APAC dominated the market and accounted for a 29.8% growth during the forecast period.
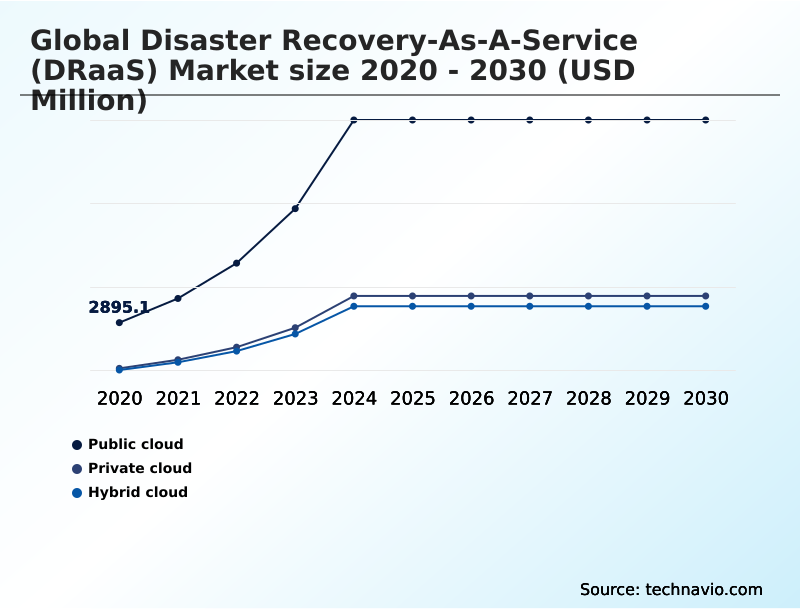
  • By Deployment - Public cloud segment was valued at USD 11.22 billion in 2024
  • By Service Type - Managed DRaaS segment accounted for the largest market revenue share in 2024

Market Size & Forecast

  • Market Opportunities: USD 46.78 billion
  • Market Future Opportunities: USD 22.37 billion
  • CAGR from 2025 to 2030 : 12%

Market Summary

  • The Disaster Recovery-as-a-Service (DRaaS) market is undergoing a significant transformation, moving beyond simple backup to become a cornerstone of enterprise resilience. Key market drivers include the widespread adoption of cloud-native architectures and the operational necessities of a distributed workforce, which demand sophisticated orchestration and high availability.
  • A major trend is the integration of AI-driven cyber resilience, where predictive analytics are used to pre-empt system failures. At the same time, the market is shaped by the persistent challenge of ransomware mitigation, pushing providers to offer solutions like immutable storage and air-gapped immutable cloud vaults.
  • For instance, a financial services firm, facing stringent regulatory requirements for data protection and operational continuity, may implement a zero-trust architecture for all recovery requests. This ensures that in the event of a breach, data is restored from a verified, untainted source within a clean room recovery environment, maintaining data integrity and compliance.
  • This evolution highlights a shift from reactive recovery to a proactive, intelligent, and secure approach to business continuity.

What will be the Size of the Disaster Recovery-as-a-service (draas) Market during the forecast period?

Get Key Insights on Market Forecast (PDF) Request Free Sample

How is the Disaster Recovery-as-a-service (draas) Market Segmented?

The disaster recovery-as-a-service (draas) industry research report provides comprehensive data (region-wise segment analysis), with forecasts and estimates in "USD million" for the period 2026-2030, as well as historical data from 2020-2024 for the following segments.

  • Deployment
    • Public cloud
    • Private cloud
    • Hybrid cloud
  • Service type
    • Managed DRaaS
    • Assisted DRaaS
    • Self-service DRaaS
  • End-user
    • Large enterprise
    • SMEs
  • Geography
    • North America
      • US
      • Canada
      • Mexico
    • APAC
      • China
      • Japan
      • India
    • Europe
      • UK
      • Germany
      • France
    • South America
      • Brazil
      • Argentina
    • Middle East and Africa
      • Saudi Arabia
      • UAE
      • South Africa
    • Rest of World (ROW)

By Deployment Insights

The public cloud segment is estimated to witness significant growth during the forecast period.

The public cloud segment is central to the disaster recovery-as-a-service (DRaaS) market, offering inherent scalability and consumption-based pricing that eliminates large capital expenditures.

This model facilitates rapid deployment of resilient recovery solutions, allowing enterprises to leverage sophisticated orchestration for both failover and failback processes.

By using geographically dispersed regions, organizations can achieve robust data protection and maintain high availability, which is critical in today's digital economy.

The adoption of cloud-native recovery protocols within public cloud environments has improved recovery time objectives by over 30% for many firms.

This approach is key for maintaining operational continuity, especially for virtual desktop infrastructures that support a distributed workforce, and relies on automated runbooks to ensure consistency.

Request Free Sample

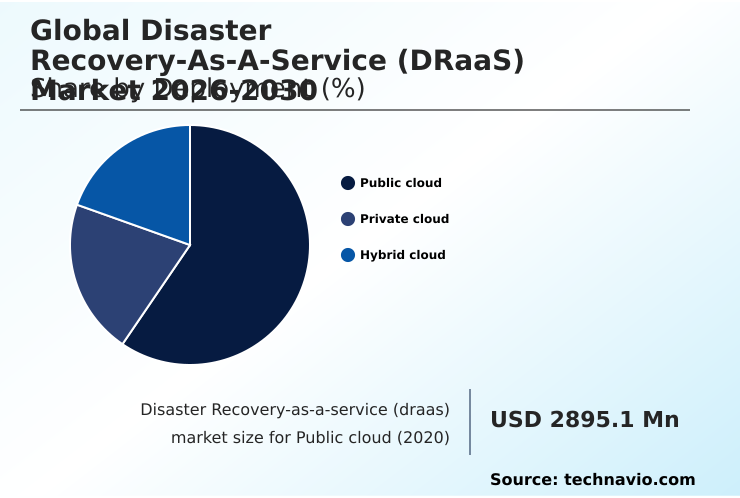
The Public cloud segment was valued at USD 11.22 billion in 2024 and showed a gradual increase during the forecast period.

Request Free Sample

Regional Analysis

APAC is estimated to contribute 29.8% to the growth of the global market during the forecast period.Technavio’s analysts have elaborately explained the regional trends and drivers that shape the market during the forecast period.

See How Disaster Recovery-as-a-service (draas) Market Demand is Rising in APAC Request Free Sample

The geographic landscape of the disaster recovery-as-a-service market is defined by varied regional priorities and growth rates. North America remains the largest market, driven by mature cloud adoption and stringent regulations.

In contrast, the APAC region is the fastest-growing, expanding at 13.7% annually, fueled by rapid digitalization and the need to protect against both cyber threats and natural disasters.

Europe's market is heavily influenced by a focus on data sovereignty compliance and the demand for locally hosted recovery nodes.

The strategic need for power instabilities mitigation and protection against localized infrastructure failures is a significant factor in emerging markets across South America and Africa.

The adoption of hybrid solutions is common globally, with organizations leveraging policy-driven recovery to balance cost and performance across diverse geographic footprints.

Market Dynamics

Our researchers analyzed the data with 2025 as the base year, along with the key drivers, trends, and challenges. A holistic analysis of drivers will help companies refine their marketing strategies to gain a competitive advantage.

  • As organizations navigate increasingly complex digital ecosystems, the evolution of disaster recovery strategies has become paramount. Achieving compliance with data residency mandates in DRaaS is no longer a niche requirement but a standard for global operations, compelling a shift towards solutions that can guarantee data sovereignty. Concurrently, the challenge of managing DRaaS in hybrid cloud architectures demands advanced orchestration.
  • The focus is now on achieving near-zero RTO and RPO with DRaaS, a goal made possible by automated failover triggers for workload migration. The threat of sophisticated cyberattacks has also redefined resilience, making ransomware mitigation using immutable storage a critical defense.
  • This is often paired with clean room recovery for validated data restoration, ensuring that only untainted data is returned to production. A zero-trust architecture for recovery requests adds another layer of security. For businesses with advanced IT capabilities, using IaC for self-service DRaaS automation offers granular control, while others rely on managed clean room recovery services.
  • We are also seeing specialized solutions emerge, such as assisted recovery for VMware environments and disaster recovery for virtual desktop infrastructures. Strategies now account for resilience against single-region cloud outages and protect backup repositories from targeted attacks. This comprehensive approach, which often includes AI-driven predictive analytics for system failures, ensures that organizations can maintain operations effectively.
  • Firms that implement such tested, automated strategies report compliance audit pass rates more than double those of peers relying on outdated manual processes.

What are the key market drivers leading to the rise in the adoption of Disaster Recovery-as-a-service (draas) Industry?

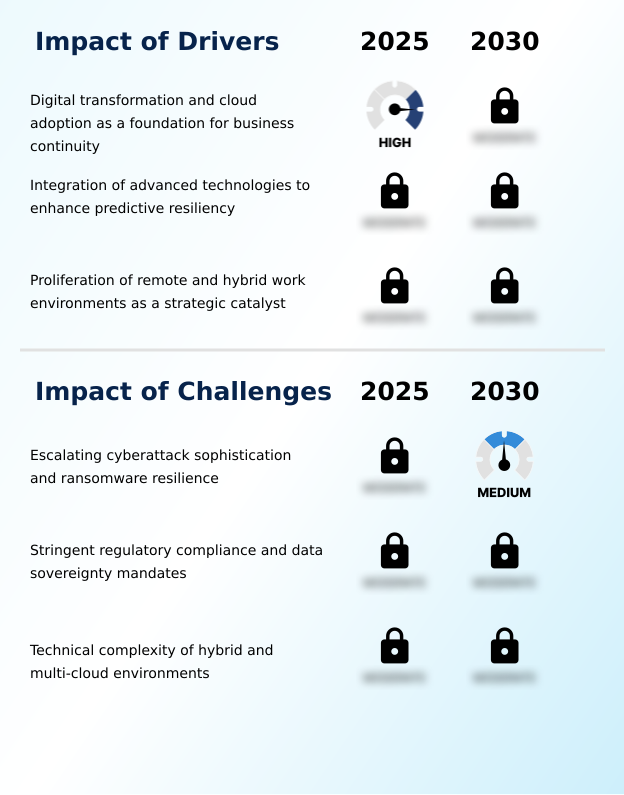
  • Digital transformation and widespread cloud adoption serve as the foundational drivers for business continuity, propelling the growth of the disaster recovery-as-a-service market.

  • The primary driver for the disaster recovery-as-a-service market is the enterprise-wide push for digital transformation and cloud adoption as core pillars of business continuity.
  • As organizations transition from on-premises data centers to cloud-native architectures, the demand for specialized, resilient recovery solutions has surged.
  • This shift allows businesses to move from a capital expenditure model to a more flexible operational expenditure model, reducing infrastructure overhead by up to 30%.
  • The proliferation of remote and hybrid work environments has also catalyzed market growth, as a distributed workforce relies on the high availability of virtual desktop infrastructures and cloud applications.
  • Ensuring operational continuity for a remote workforce has become a top priority, with downtime costs increasing by 25% year-over-year for many firms.

What are the market trends shaping the Disaster Recovery-as-a-service (draas) Industry?

  • The integration of AI and ML for predictive resilience is an emerging market trend. This shift enables the proactive identification of potential system failures before they escalate into disasters.

  • Key trends in the disaster recovery-as-a-service market are centered on proactive and intelligent resilience. The integration of AI and machine learning into recovery frameworks allows for predictive analytics that can identify potential system failures before they occur, improving threat detection accuracy by over 40%. This shift from reactive to proactive strategies is critical for managing complex, distributed environments.
  • Another major trend is the focus on ransomware mitigation through technologies like immutable storage and clean room recovery, which ensures that restored data is free from malware. Organizations adopting immutable backups have reported a near-100% success rate in data restoration following an attack.
  • The move towards multi-cloud strategies also drives the need for sophisticated orchestration and automated runbooks to ensure seamless failover across different platforms.

What challenges does the Disaster Recovery-as-a-service (draas) Industry face during its growth?

  • The escalating sophistication of cyberattacks and the challenge of ensuring ransomware resilience present significant obstacles to industry growth.

  • The disaster recovery-as-a-service market faces significant challenges from the escalating sophistication of cyber threats and the complexity of modern IT environments. Ransomware attacks now frequently target backup repositories, forcing providers to innovate with air-gapped storage and immutable data vaulting.
  • The technical complexity of managing disaster recovery across hybrid and multi-cloud architectures is another major hurdle, where incompatible replication technologies can increase recovery times by over 50% if not properly orchestrated. Furthermore, navigating stringent regulatory frameworks and data residency mandates adds another layer of complexity.
  • Failure to meet these compliance standards, which often require documented and tested recovery plans, can result in significant financial penalties, making robust compliance-mapping tools and automated runbooks essential.

Exclusive Technavio Analysis on Customer Landscape

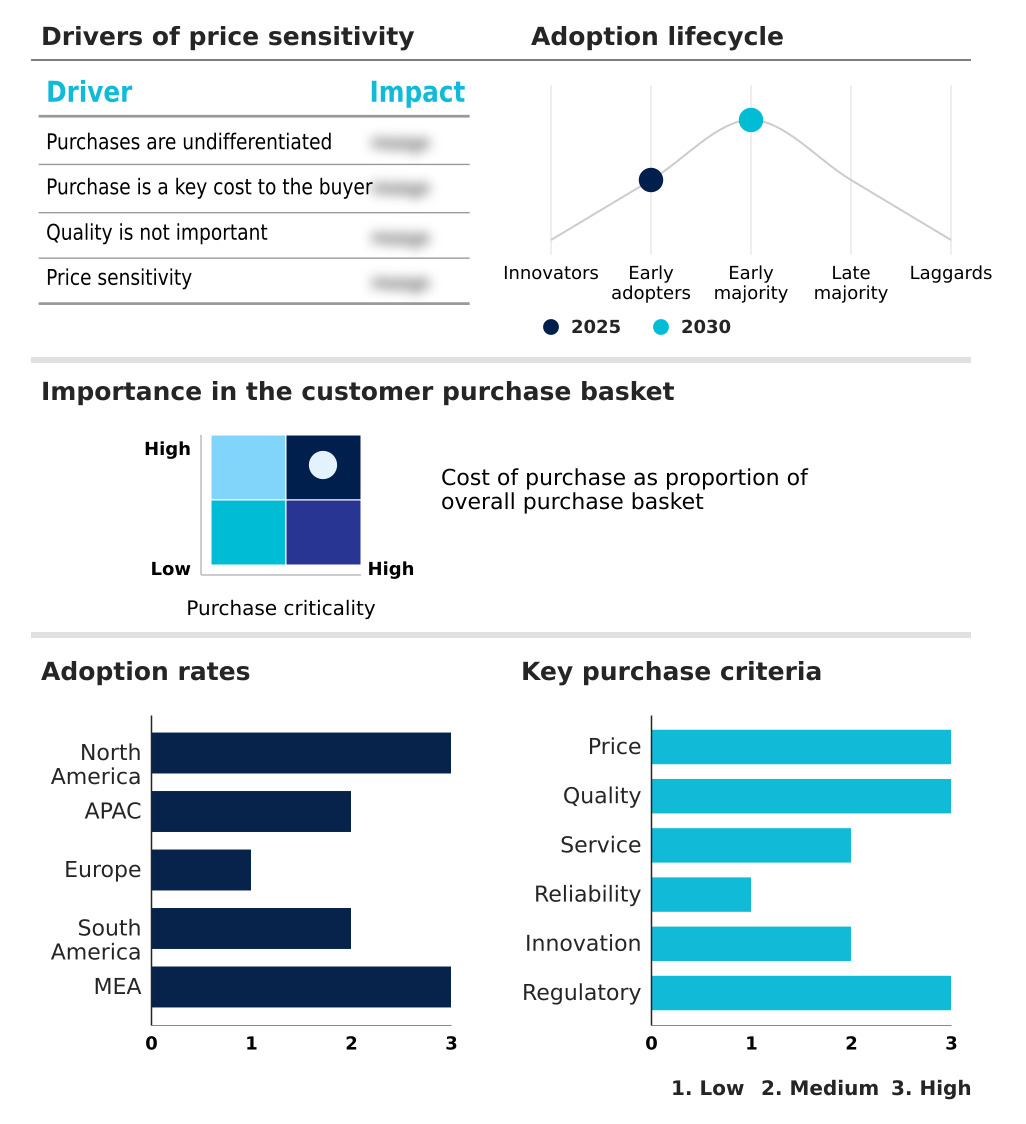
The disaster recovery-as-a-service (draas) market forecasting report includes the adoption lifecycle of the market, covering from the innovator’s stage to the laggard’s stage. It focuses on adoption rates in different regions based on penetration. Furthermore, the disaster recovery-as-a-service (draas) market report also includes key purchase criteria and drivers of price sensitivity to help companies evaluate and develop their market growth analysis strategies.

Customer Landscape of Disaster Recovery-as-a-service (draas) Industry

Competitive Landscape

Companies are implementing various strategies, such as strategic alliances, disaster recovery-as-a-service (draas) market forecast, partnerships, mergers and acquisitions, geographical expansion, and product/service launches, to enhance their presence in the industry.

11 11 Systems Inc. - Provides integrated data protection and disaster recovery solutions, ensuring robust cybersecurity and scalable backup for modern cloud and hybrid environments.

The industry research and growth report includes detailed analyses of the competitive landscape of the market and information about key companies, including:

  • 11 11 Systems Inc.
  • Acronis International GmbH
  • Amazon Web Services Inc.
  • Arcserve USA LLC
  • Carbonite Inc.
  • Commvault Systems Inc.
  • Datto Holdings Corp.
  • Druva Inc.
  • Flexential Corp.
  • Google LLC
  • Hewlett Packard Enterprise Co.
  • IBM Corp.
  • Infrascale Inc.
  • Lumen Technologies Inc.
  • Microsoft Corp.
  • Nippon Telegraph and Corp.
  • Recovery Point Systems Inc.
  • TierPoint LLC
  • Veeam Software Group GmbH
  • VMware Inc.

Qualitative and quantitative analysis of companies has been conducted to help clients understand the wider business environment as well as the strengths and weaknesses of key industry players. Data is qualitatively analyzed to categorize companies as pure play, category-focused, industry-focused, and diversified; it is quantitatively analyzed to categorize companies as dominant, leading, strong, tentative, and weak.

Recent Development and News in Disaster recovery-as-a-service (draas) market

  • In October 2024, Cohesity and 11:11 Systems expanded their partnership to introduce a managed Clean Room Recovery service, providing an isolated environment for secure data validation and ransomware response.
  • In December 2024, Dell Technologies enhanced its PowerProtect portfolio with advanced machine learning capabilities to accelerate data recovery and improve the detection of sophisticated cyber threats in hybrid environments.
  • In January 2025, Veeam Software released its new Data Platform, which incorporates advanced forensic analysis tools and intelligent automation to help organizations counter emerging data security threats.
  • In March 2025, Microsoft deployed its Azure Site Recovery and Azure Local solutions for Publix Employees Federal Credit Union, significantly reducing virtual machine recovery times and enhancing resilience against regional disruptions.

Dive into Technavio’s robust research methodology, blending expert interviews, extensive data synthesis, and validated models for unparalleled Disaster Recovery-as-a-service (draas) Market insights. See full methodology.

Market Scope
Page number 296
Base year 2025
Historic period 2020-2024
Forecast period 2026-2030
Growth momentum & CAGR Accelerate at a CAGR of 12%
Market growth 2026-2030 USD 22367.5 million
Market structure Fragmented
YoY growth 2025-2026(%) 11.2%
Key countries US, Canada, Mexico, China, Japan, India, South Korea, Singapore, Australia, UK, Germany, France, The Netherlands, Spain, Italy, Brazil, Argentina, Chile, Saudi Arabia, UAE, South Africa, Egypt and Nigeria
Competitive landscape Leading Companies, Market Positioning of Companies, Competitive Strategies, and Industry Risks

Request Free Sample

Research Analyst Overview

  • The Disaster Recovery-as-a-Service (DRaaS) market has matured from a simple backup function to a strategic imperative for ensuring enterprise resilience. The core of this evolution is the shift toward AI-driven cyber resilience and the adoption of cloud-native architectures. Businesses now demand sophisticated orchestration to manage complex, distributed environments, making high availability and effective failover and failback processes standard expectations.
  • This trend is directly influencing boardroom decisions around cybersecurity insurance, as implementing advanced data protection measures like immutable storage and clean room recovery can significantly lower premiums. The market's technical landscape is defined by the integration of predictive analytics and automated failover triggers, which reduce human error during a crisis by up to 60%.
  • As ransomware mitigation becomes a primary concern, features such as immutable data vaulting and zero-trust architectures are no longer optional. This push toward intelligent workload migration and resilient recovery solutions demonstrates that maintaining operational continuity in the face of both cyber threats and infrastructure failures is the market's fundamental value proposition.

What are the Key Data Covered in this Disaster Recovery-as-a-service (draas) Market Research and Growth Report?

  • What is the expected growth of the Disaster Recovery-as-a-service (draas) Market between 2026 and 2030?

    • USD 22.37 billion, at a CAGR of 12%

  • What segmentation does the market report cover?

    • The report is segmented by Deployment (Public cloud, Private cloud, and Hybrid cloud), Service Type (Managed DRaaS, Assisted DRaaS, and Self-service DRaaS), End-user (Large enterprise, and SMEs) and Geography (North America, APAC, Europe, South America, Middle East and Africa)

  • Which regions are analyzed in the report?

    • North America, APAC, Europe, South America and Middle East and Africa

  • What are the key growth drivers and market challenges?

    • Digital transformation and cloud adoption as a foundation for business continuity, Escalating cyberattack sophistication and ransomware resilience

  • Who are the major players in the Disaster Recovery-as-a-service (draas) Market?

    • 11 11 Systems Inc., Acronis International GmbH, Amazon Web Services Inc., Arcserve USA LLC, Carbonite Inc., Commvault Systems Inc., Datto Holdings Corp., Druva Inc., Flexential Corp., Google LLC, Hewlett Packard Enterprise Co., IBM Corp., Infrascale Inc., Lumen Technologies Inc., Microsoft Corp., Nippon Telegraph and Corp., Recovery Point Systems Inc., TierPoint LLC, Veeam Software Group GmbH and VMware Inc.

Market Research Insights

  • The dynamics of the disaster recovery-as-a-service market are increasingly shaped by a focus on proactive and verifiable resilience. Organizations are adopting assisted recovery services to achieve sub-minute recovery time objectives, a metric that has become a competitive differentiator.
  • The implementation of zero-trust recovery protocols has been shown to reduce unauthorized recovery attempts by over 90%, a critical factor for securing hybrid-IT environments. Furthermore, firms utilizing managed cyber-resilience services restore critical operations 75% faster than those with self-managed plans. The move toward sovereign cloud recovery is also gaining traction as data sovereignty compliance becomes a non-negotiable boardroom issue.
  • This is complemented by policy-driven recovery automation, which minimizes manual error and ensures consistent execution during a crisis.

We can help! Our analysts can customize this disaster recovery-as-a-service (draas) market research report to meet your requirements.

Get in touch

1. Executive Summary

1.1 Market overview

Executive Summary - Chart on Market Overview
Executive Summary - Data Table on Market Overview
Executive Summary - Chart on Global Market Characteristics
Executive Summary - Chart on Market by Geography
Executive Summary - Chart on Market Segmentation by Deployment
Executive Summary - Chart on Market Segmentation by Service Type
Executive Summary - Chart on Market Segmentation by End-user
Executive Summary - Chart on Incremental Growth
Executive Summary - Data Table on Incremental Growth
Executive Summary - Chart on Company Market Positioning

2. Technavio Analysis

2.1 Analysis of price sensitivity, lifecycle, customer purchase basket, adoption rates, and purchase criteria

2.2 Criticality of inputs and Factors of differentiation

Chart on Overview on criticality of inputs and factors of differentiation

2.3 Factors of disruption

Chart on Overview on factors of disruption

2.4 Impact of drivers and challenges

Chart on Impact of drivers and challenges in 2025 and 2030

3. Market Landscape

3.1 Market ecosystem

Chart on Parent Market
Data Table on - Parent Market

3.2 Market characteristics

Chart on Market characteristics analysis

3.3 Value chain analysis

Chart on Value chain analysis

4. Market Sizing

4.1 Market definition

Data Table on Offerings of companies included in the market definition

4.2 Market segment analysis

Market segments

4.3 Market size 2025

4.4 Market outlook: Forecast for 2025-2030

Chart on Global - Market size and forecast 2025-2030 ($ million)
Data Table on Global - Market size and forecast 2025-2030 ($ million)
Chart on Global Market: Year-over-year growth 2025-2030 (%)
Data Table on Global Market: Year-over-year growth 2025-2030 (%)

5. Historic Market Size

5.1 Global Disaster Recovery-As-A-Service (DRaaS) Market 2020 - 2024

Historic Market Size - Data Table on Global Disaster Recovery-As-A-Service (DRaaS) Market 2020 - 2024 ($ million)

5.2 Deployment segment analysis 2020 - 2024

Historic Market Size - Deployment Segment 2020 - 2024 ($ million)

5.3 Service Type segment analysis 2020 - 2024

Historic Market Size - Service Type Segment 2020 - 2024 ($ million)

5.4 End-user segment analysis 2020 - 2024

Historic Market Size - End-user Segment 2020 - 2024 ($ million)

5.5 Geography segment analysis 2020 - 2024

Historic Market Size - Geography Segment 2020 - 2024 ($ million)

5.6 Country segment analysis 2020 - 2024

Historic Market Size - Country Segment 2020 - 2024 ($ million)

6. Qualitative Analysis

6.1 Impact of AI in Global disaster recovery-as-a-service (DRaaS) Market

6.2 Impact of Geopolitical Conflict for Global disaster recovery-as-a-service (DRaaS) Market

7. Five Forces Analysis

7.1 Five forces summary

Five forces analysis - Comparison between 2025 and 2030

7.2 Bargaining power of buyers

Bargaining power of buyers - Impact of key factors 2025 and 2030

7.3 Bargaining power of suppliers

Bargaining power of suppliers - Impact of key factors in 2025 and 2030

7.4 Threat of new entrants

Threat of new entrants - Impact of key factors in 2025 and 2030

7.5 Threat of substitutes

Threat of substitutes - Impact of key factors in 2025 and 2030

7.6 Threat of rivalry

Threat of rivalry - Impact of key factors in 2025 and 2030

7.7 Market condition

Chart on Market condition - Five forces 2025 and 2030

8. Market Segmentation by Deployment

8.1 Market segments

Chart on Deployment - Market share 2025-2030 (%)
Data Table on Deployment - Market share 2025-2030 (%)

8.2 Comparison by Deployment

Chart on Comparison by Deployment
Data Table on Comparison by Deployment

8.3 Public cloud - Market size and forecast 2025-2030

Chart on Public cloud - Market size and forecast 2025-2030 ($ million)
Data Table on Public cloud - Market size and forecast 2025-2030 ($ million)
Chart on Public cloud - Year-over-year growth 2025-2030 (%)
Data Table on Public cloud - Year-over-year growth 2025-2030 (%)

8.4 Private cloud - Market size and forecast 2025-2030

Chart on Private cloud - Market size and forecast 2025-2030 ($ million)
Data Table on Private cloud - Market size and forecast 2025-2030 ($ million)
Chart on Private cloud - Year-over-year growth 2025-2030 (%)
Data Table on Private cloud - Year-over-year growth 2025-2030 (%)

8.5 Hybrid cloud - Market size and forecast 2025-2030

Chart on Hybrid cloud - Market size and forecast 2025-2030 ($ million)
Data Table on Hybrid cloud - Market size and forecast 2025-2030 ($ million)
Chart on Hybrid cloud - Year-over-year growth 2025-2030 (%)
Data Table on Hybrid cloud - Year-over-year growth 2025-2030 (%)

8.6 Market opportunity by Deployment

Market opportunity by Deployment ($ million)
Data Table on Market opportunity by Deployment ($ million)

9. Market Segmentation by Service Type

9.1 Market segments

Chart on Service Type - Market share 2025-2030 (%)
Data Table on Service Type - Market share 2025-2030 (%)

9.2 Comparison by Service Type

Chart on Comparison by Service Type
Data Table on Comparison by Service Type

9.3 Managed DRaaS - Market size and forecast 2025-2030

Chart on Managed DRaaS - Market size and forecast 2025-2030 ($ million)
Data Table on Managed DRaaS - Market size and forecast 2025-2030 ($ million)
Chart on Managed DRaaS - Year-over-year growth 2025-2030 (%)
Data Table on Managed DRaaS - Year-over-year growth 2025-2030 (%)

9.4 Assisted DRaaS - Market size and forecast 2025-2030

Chart on Assisted DRaaS - Market size and forecast 2025-2030 ($ million)
Data Table on Assisted DRaaS - Market size and forecast 2025-2030 ($ million)
Chart on Assisted DRaaS - Year-over-year growth 2025-2030 (%)
Data Table on Assisted DRaaS - Year-over-year growth 2025-2030 (%)

9.5 Self-service DRaaS - Market size and forecast 2025-2030

Chart on Self-service DRaaS - Market size and forecast 2025-2030 ($ million)
Data Table on Self-service DRaaS - Market size and forecast 2025-2030 ($ million)
Chart on Self-service DRaaS - Year-over-year growth 2025-2030 (%)
Data Table on Self-service DRaaS - Year-over-year growth 2025-2030 (%)

9.6 Market opportunity by Service Type

Market opportunity by Service Type ($ million)
Data Table on Market opportunity by Service Type ($ million)

10. Market Segmentation by End-user

10.1 Market segments

Chart on End-user - Market share 2025-2030 (%)
Data Table on End-user - Market share 2025-2030 (%)

10.2 Comparison by End-user

Chart on Comparison by End-user
Data Table on Comparison by End-user

10.3 Large enterprise - Market size and forecast 2025-2030

Chart on Large enterprise - Market size and forecast 2025-2030 ($ million)
Data Table on Large enterprise - Market size and forecast 2025-2030 ($ million)
Chart on Large enterprise - Year-over-year growth 2025-2030 (%)
Data Table on Large enterprise - Year-over-year growth 2025-2030 (%)

10.4 SMEs - Market size and forecast 2025-2030

Chart on SMEs - Market size and forecast 2025-2030 ($ million)
Data Table on SMEs - Market size and forecast 2025-2030 ($ million)
Chart on SMEs - Year-over-year growth 2025-2030 (%)
Data Table on SMEs - Year-over-year growth 2025-2030 (%)

10.5 Market opportunity by End-user

Market opportunity by End-user ($ million)
Data Table on Market opportunity by End-user ($ million)

11. Customer Landscape

11.1 Customer landscape overview

Analysis of price sensitivity, lifecycle, customer purchase basket, adoption rates, and purchase criteria

12. Geographic Landscape

12.1 Geographic segmentation

Chart on Market share by geography 2025-2030 (%)
Data Table on Market share by geography 2025-2030 (%)

12.2 Geographic comparison

Chart on Geographic comparison
Data Table on Geographic comparison

12.3 North America - Market size and forecast 2025-2030

Chart on North America - Market size and forecast 2025-2030 ($ million)
Data Table on North America - Market size and forecast 2025-2030 ($ million)
Chart on North America - Year-over-year growth 2025-2030 (%)
Data Table on North America - Year-over-year growth 2025-2030 (%)
Chart on Regional Comparison - North America
Data Table on Regional Comparison - North America

12.3.1 US - Market size and forecast 2025-2030

Chart on US - Market size and forecast 2025-2030 ($ million)
Data Table on US - Market size and forecast 2025-2030 ($ million)
Chart on US - Year-over-year growth 2025-2030 (%)
Data Table on US - Year-over-year growth 2025-2030 (%)

12.3.2 Canada - Market size and forecast 2025-2030

Chart on Canada - Market size and forecast 2025-2030 ($ million)
Data Table on Canada - Market size and forecast 2025-2030 ($ million)
Chart on Canada - Year-over-year growth 2025-2030 (%)
Data Table on Canada - Year-over-year growth 2025-2030 (%)

12.3.3 Mexico - Market size and forecast 2025-2030

Chart on Mexico - Market size and forecast 2025-2030 ($ million)
Data Table on Mexico - Market size and forecast 2025-2030 ($ million)
Chart on Mexico - Year-over-year growth 2025-2030 (%)
Data Table on Mexico - Year-over-year growth 2025-2030 (%)

12.4 APAC - Market size and forecast 2025-2030

Chart on APAC - Market size and forecast 2025-2030 ($ million)
Data Table on APAC - Market size and forecast 2025-2030 ($ million)
Chart on APAC - Year-over-year growth 2025-2030 (%)
Data Table on APAC - Year-over-year growth 2025-2030 (%)
Chart on Regional Comparison - APAC
Data Table on Regional Comparison - APAC

12.4.1 China - Market size and forecast 2025-2030

Chart on China - Market size and forecast 2025-2030 ($ million)
Data Table on China - Market size and forecast 2025-2030 ($ million)
Chart on China - Year-over-year growth 2025-2030 (%)
Data Table on China - Year-over-year growth 2025-2030 (%)

12.4.2 Japan - Market size and forecast 2025-2030

Chart on Japan - Market size and forecast 2025-2030 ($ million)
Data Table on Japan - Market size and forecast 2025-2030 ($ million)
Chart on Japan - Year-over-year growth 2025-2030 (%)
Data Table on Japan - Year-over-year growth 2025-2030 (%)

12.4.3 India - Market size and forecast 2025-2030

Chart on India - Market size and forecast 2025-2030 ($ million)
Data Table on India - Market size and forecast 2025-2030 ($ million)
Chart on India - Year-over-year growth 2025-2030 (%)
Data Table on India - Year-over-year growth 2025-2030 (%)

12.4.4 South Korea - Market size and forecast 2025-2030

Chart on South Korea - Market size and forecast 2025-2030 ($ million)
Data Table on South Korea - Market size and forecast 2025-2030 ($ million)
Chart on South Korea - Year-over-year growth 2025-2030 (%)
Data Table on South Korea - Year-over-year growth 2025-2030 (%)

12.4.5 Singapore - Market size and forecast 2025-2030

Chart on Singapore - Market size and forecast 2025-2030 ($ million)
Data Table on Singapore - Market size and forecast 2025-2030 ($ million)
Chart on Singapore - Year-over-year growth 2025-2030 (%)
Data Table on Singapore - Year-over-year growth 2025-2030 (%)

12.4.6 Australia - Market size and forecast 2025-2030

Chart on Australia - Market size and forecast 2025-2030 ($ million)
Data Table on Australia - Market size and forecast 2025-2030 ($ million)
Chart on Australia - Year-over-year growth 2025-2030 (%)
Data Table on Australia - Year-over-year growth 2025-2030 (%)

12.5 Europe - Market size and forecast 2025-2030

Chart on Europe - Market size and forecast 2025-2030 ($ million)
Data Table on Europe - Market size and forecast 2025-2030 ($ million)
Chart on Europe - Year-over-year growth 2025-2030 (%)
Data Table on Europe - Year-over-year growth 2025-2030 (%)
Chart on Regional Comparison - Europe
Data Table on Regional Comparison - Europe

12.5.1 UK - Market size and forecast 2025-2030

Chart on UK - Market size and forecast 2025-2030 ($ million)
Data Table on UK - Market size and forecast 2025-2030 ($ million)
Chart on UK - Year-over-year growth 2025-2030 (%)
Data Table on UK - Year-over-year growth 2025-2030 (%)

12.5.2 Germany - Market size and forecast 2025-2030

Chart on Germany - Market size and forecast 2025-2030 ($ million)
Data Table on Germany - Market size and forecast 2025-2030 ($ million)
Chart on Germany - Year-over-year growth 2025-2030 (%)
Data Table on Germany - Year-over-year growth 2025-2030 (%)

12.5.3 France - Market size and forecast 2025-2030

Chart on France - Market size and forecast 2025-2030 ($ million)
Data Table on France - Market size and forecast 2025-2030 ($ million)
Chart on France - Year-over-year growth 2025-2030 (%)
Data Table on France - Year-over-year growth 2025-2030 (%)

12.5.4 The Netherlands - Market size and forecast 2025-2030

Chart on The Netherlands - Market size and forecast 2025-2030 ($ million)
Data Table on The Netherlands - Market size and forecast 2025-2030 ($ million)
Chart on The Netherlands - Year-over-year growth 2025-2030 (%)
Data Table on The Netherlands - Year-over-year growth 2025-2030 (%)

12.5.5 Spain - Market size and forecast 2025-2030

Chart on Spain - Market size and forecast 2025-2030 ($ million)
Data Table on Spain - Market size and forecast 2025-2030 ($ million)
Chart on Spain - Year-over-year growth 2025-2030 (%)
Data Table on Spain - Year-over-year growth 2025-2030 (%)

12.5.6 Italy - Market size and forecast 2025-2030

Chart on Italy - Market size and forecast 2025-2030 ($ million)
Data Table on Italy - Market size and forecast 2025-2030 ($ million)
Chart on Italy - Year-over-year growth 2025-2030 (%)
Data Table on Italy - Year-over-year growth 2025-2030 (%)

12.6 South America - Market size and forecast 2025-2030

Chart on South America - Market size and forecast 2025-2030 ($ million)
Data Table on South America - Market size and forecast 2025-2030 ($ million)
Chart on South America - Year-over-year growth 2025-2030 (%)
Data Table on South America - Year-over-year growth 2025-2030 (%)
Chart on Regional Comparison - South America
Data Table on Regional Comparison - South America

12.6.1 Brazil - Market size and forecast 2025-2030

Chart on Brazil - Market size and forecast 2025-2030 ($ million)
Data Table on Brazil - Market size and forecast 2025-2030 ($ million)
Chart on Brazil - Year-over-year growth 2025-2030 (%)
Data Table on Brazil - Year-over-year growth 2025-2030 (%)

12.6.2 Argentina - Market size and forecast 2025-2030

Chart on Argentina - Market size and forecast 2025-2030 ($ million)
Data Table on Argentina - Market size and forecast 2025-2030 ($ million)
Chart on Argentina - Year-over-year growth 2025-2030 (%)
Data Table on Argentina - Year-over-year growth 2025-2030 (%)

12.6.3 Chile - Market size and forecast 2025-2030

Chart on Chile - Market size and forecast 2025-2030 ($ million)
Data Table on Chile - Market size and forecast 2025-2030 ($ million)
Chart on Chile - Year-over-year growth 2025-2030 (%)
Data Table on Chile - Year-over-year growth 2025-2030 (%)

12.7 Middle East and Africa - Market size and forecast 2025-2030

Chart on Middle East and Africa - Market size and forecast 2025-2030 ($ million)
Data Table on Middle East and Africa - Market size and forecast 2025-2030 ($ million)
Chart on Middle East and Africa - Year-over-year growth 2025-2030 (%)
Data Table on Middle East and Africa - Year-over-year growth 2025-2030 (%)
Chart on Regional Comparison - Middle East and Africa
Data Table on Regional Comparison - Middle East and Africa

12.7.1 Saudi Arabia - Market size and forecast 2025-2030

Chart on Saudi Arabia - Market size and forecast 2025-2030 ($ million)
Data Table on Saudi Arabia - Market size and forecast 2025-2030 ($ million)
Chart on Saudi Arabia - Year-over-year growth 2025-2030 (%)
Data Table on Saudi Arabia - Year-over-year growth 2025-2030 (%)

12.7.2 UAE - Market size and forecast 2025-2030

Chart on UAE - Market size and forecast 2025-2030 ($ million)
Data Table on UAE - Market size and forecast 2025-2030 ($ million)
Chart on UAE - Year-over-year growth 2025-2030 (%)
Data Table on UAE - Year-over-year growth 2025-2030 (%)

12.7.3 South Africa - Market size and forecast 2025-2030

Chart on South Africa - Market size and forecast 2025-2030 ($ million)
Data Table on South Africa - Market size and forecast 2025-2030 ($ million)
Chart on South Africa - Year-over-year growth 2025-2030 (%)
Data Table on South Africa - Year-over-year growth 2025-2030 (%)

12.7.4 Egypt - Market size and forecast 2025-2030

Chart on Egypt - Market size and forecast 2025-2030 ($ million)
Data Table on Egypt - Market size and forecast 2025-2030 ($ million)
Chart on Egypt - Year-over-year growth 2025-2030 (%)
Data Table on Egypt - Year-over-year growth 2025-2030 (%)

12.7.5 Nigeria - Market size and forecast 2025-2030

Chart on Nigeria - Market size and forecast 2025-2030 ($ million)
Data Table on Nigeria - Market size and forecast 2025-2030 ($ million)
Chart on Nigeria - Year-over-year growth 2025-2030 (%)
Data Table on Nigeria - Year-over-year growth 2025-2030 (%)

12.8 Market opportunity by geography

Market opportunity by geography ($ million)
Data Tables on Market opportunity by geography ($ million)

13. Drivers, Challenges, and Opportunity

13.1 Market drivers

Digital transformation and cloud adoption as a foundation for business continuity
Integration of advanced technologies to enhance predictive resiliency
Proliferation of remote and hybrid work environments as a strategic catalyst

13.2 Market challenges

Escalating cyberattack sophistication and ransomware resilience
Stringent regulatory compliance and data sovereignty mandates
Technical complexity of hybrid and multi-cloud environments

13.3 Impact of drivers and challenges

Impact of drivers and challenges in 2025 and 2030

13.4 Market opportunities

Integration of AL and ML for predictive resilience
Accelerated demand for ransomware mitigation and immutable recovery
Shift towards multi-cloud and hybrid infrastructure adoption

14. Competitive Landscape

14.1 Overview

14.2

Overview on criticality of inputs and factors of differentiation

14.3 Landscape disruption

Overview on factors of disruption

14.4 Industry risks

Impact of key risks on business

15. Competitive Analysis

15.1 Companies profiled

Companies covered

15.2 Company ranking index

15.3 Market positioning of companies

Matrix on companies position and classification

15.4 Acronis International GmbH

Acronis International GmbH - Overview
Acronis International GmbH - Product / Service
Acronis International GmbH - Key offerings
SWOT

15.5 Amazon Web Services Inc.

Amazon Web Services Inc. - Overview
Amazon Web Services Inc. - Product / Service
Amazon Web Services Inc. - Key offerings
SWOT

15.6 Arcserve USA LLC

Arcserve USA LLC - Overview
Arcserve USA LLC - Product / Service
Arcserve USA LLC - Key offerings
SWOT

15.7 Carbonite Inc.

Carbonite Inc. - Overview
Carbonite Inc. - Product / Service
Carbonite Inc. - Key offerings
SWOT

15.8 Commvault Systems Inc.

Commvault Systems Inc. - Overview
Commvault Systems Inc. - Product / Service
Commvault Systems Inc. - Key news
Commvault Systems Inc. - Key offerings
SWOT

15.9 Datto Holdings Corp.

Datto Holdings Corp. - Overview
Datto Holdings Corp. - Product / Service
Datto Holdings Corp. - Key offerings
SWOT

15.10 Druva Inc.

Druva Inc. - Overview
Druva Inc. - Product / Service
Druva Inc. - Key offerings
SWOT

15.11 Google LLC

Google LLC - Overview
Google LLC - Product / Service
Google LLC - Key offerings
SWOT

15.12 Hewlett Packard Enterprise Co.

Hewlett Packard Enterprise Co. - Overview
Hewlett Packard Enterprise Co. - Business segments
Hewlett Packard Enterprise Co. - Key news
Hewlett Packard Enterprise Co. - Key offerings
Hewlett Packard Enterprise Co. - Segment focus
SWOT

15.13 IBM Corp.

IBM Corp. - Overview
IBM Corp. - Business segments
IBM Corp. - Key news
IBM Corp. - Key offerings
IBM Corp. - Segment focus
SWOT

15.14 Lumen Technologies Inc.

Lumen Technologies Inc. - Overview
Lumen Technologies Inc. - Business segments
Lumen Technologies Inc. - Key news
Lumen Technologies Inc. - Key offerings
Lumen Technologies Inc. - Segment focus
SWOT

15.15 Microsoft Corp.

Microsoft Corp. - Overview
Microsoft Corp. - Business segments
Microsoft Corp. - Key news
Microsoft Corp. - Key offerings
Microsoft Corp. - Segment focus
SWOT

15.16 Nippon Telegraph and Corp.

Nippon Telegraph and Corp. - Overview
Nippon Telegraph and Corp. - Business segments
Nippon Telegraph and Corp. - Key news
Nippon Telegraph and Corp. - Key offerings
Nippon Telegraph and Corp. - Segment focus
SWOT

15.17 Veeam Software Group GmbH

Veeam Software Group GmbH - Overview
Veeam Software Group GmbH - Product / Service
Veeam Software Group GmbH - Key offerings
SWOT

15.18 VMware Inc.

VMware Inc. - Overview
VMware Inc. - Product / Service
VMware Inc. - Key offerings
SWOT

16. Appendix

16.1 Scope of the report

Market definition
Objectives
Notes and caveats

16.2 Inclusions and exclusions checklist

Inclusions checklist
Exclusions checklist

16.3 Currency conversion rates for US$

16.4 Research methodology

16.5 Data procurement

Information sources

16.6 Data validation

16.7 Validation techniques employed for market sizing

16.8 Data synthesis

16.9 360 degree market analysis

16.10 List of abbreviations

Research Methodology

Technavio presents a detailed picture of the market by way of study, synthesis, and summation of data from multiple sources. The analysts have presented the various facets of the market with a particular focus on identifying the key industry influencers. The data thus presented is comprehensive, reliable, and the result of extensive research, both primary and secondary.

INFORMATION SOURCES

Primary sources

  • Manufacturers and suppliers
  • Channel partners
  • Industry experts
  • Strategic decision makers

Secondary sources

  • Industry journals and periodicals
  • Government data
  • Financial reports of key industry players
  • Historical data
  • Press releases

DATA ANALYSIS

Data Synthesis

  • Collation of data
  • Estimation of key figures
  • Analysis of derived insights

Data Validation

  • Triangulation with data models
  • Reference against proprietary databases
  • Corroboration with industry experts

REPORT WRITING

Qualitative

  • Market drivers
  • Market challenges
  • Market trends
  • Five forces analysis

Quantitative

  • Market size and forecast
  • Market segmentation
  • Geographical insights
  • Competitive landscape

Interested in this report?

Get your sample now to see our research methodology and insights!

Download Now

Frequently Asked Questions

Disaster Recovery-as-a-service (draas) market growth will increase by USD 22367.5 million during 2026-2030.

The Disaster Recovery-as-a-service (draas) market is expected to grow at a CAGR of 12% during 2026-2030.

Disaster Recovery-as-a-service (draas) market is segmented by Deployment (Public cloud, Private cloud, Hybrid cloud) Service type (Managed DRaaS, Assisted DRaaS, Self-service DRaaS) End-user (Large enterprise, SMEs)

11 11 Systems Inc., Acronis International GmbH, Amazon Web Services Inc., Arcserve USA LLC, Carbonite Inc., Commvault Systems Inc., Datto Holdings Corp., Druva Inc., Flexential Corp., Google LLC, Hewlett Packard Enterprise Co., IBM Corp., Infrascale Inc., Lumen Technologies Inc., Microsoft Corp., Nippon Telegraph and Corp., Recovery Point Systems Inc., TierPoint LLC, Veeam Software Group GmbH, VMware Inc. are a few of the key vendors in the Disaster Recovery-as-a-service (draas) market.

APAC will register the highest growth rate of 29.8% among the other regions. Therefore, the Disaster Recovery-as-a-service (draas) market in APAC is expected to garner significant business opportunities for the vendors during the forecast period.

US, Canada, Mexico, China, Japan, India, South Korea, Singapore, Australia, UK, Germany, France, The Netherlands, Spain, Italy, Brazil, Argentina, Chile, Saudi Arabia, UAE, South Africa, Egypt, Nigeria

  • Digital transformation and cloud adoption as a foundation for business continuity is the driving factor this market.

The Disaster Recovery-as-a-service (draas) market vendors should focus on grabbing business opportunities from the Deployment segment as it accounted for the largest market share in the base year.
RIA - Research AI Assistant
Ask RIA