Distributed AI Computing Market Analysis, Size, and Forecast 2025-2029: North America (US, Canada, and Mexico), APAC (China, India, and Japan), Europe (Germany, UK, and France), South America (Brazil, Argentina, and Colombia), Middle East and Africa (Saudi Arabia, UAE, and South Africa), and Rest of World (ROW)

Distributed AI Computing Market Analysis, Size, and Forecast 2025-2029:
North America (US, Canada, and Mexico), APAC (China, India, and Japan), Europe (Germany, UK, and France), South America (Brazil, Argentina, and Colombia), Middle East and Africa (Saudi Arabia, UAE, and South Africa), and Rest of World (ROW)

Published: Dec 2025 289 Pages SKU: IRTNTR81038

Market Overview at a Glance

$8.73 B
Market Opportunity
21.5%
CAGR
36.1%
North America Growth

Distributed AI Computing Market Size 2025-2029

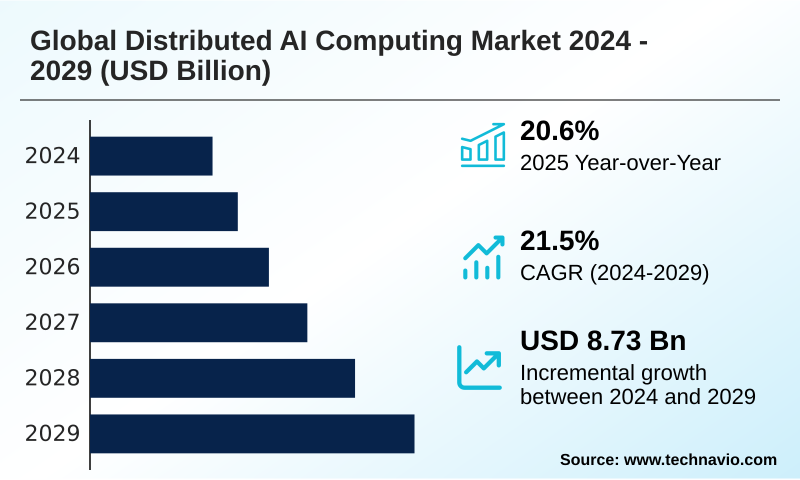
The distributed ai computing market size is valued to increase by USD 8.73 billion, at a CAGR of 21.5% from 2024 to 2029. Proliferation of generative AI and Large Language Models (LLM) demands unprecedented computational scale will drive the distributed ai computing market.

Major Market Trends & Insights

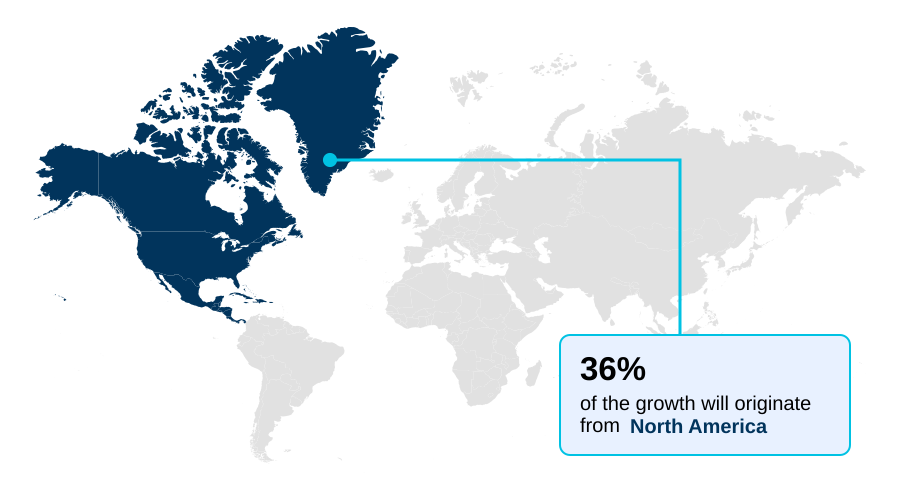
  • North America dominated the market and accounted for a 36.1% growth during the forecast period.
  • CAGR from 2024 to 2029 : 21.5%

Market Summary

  • The distributed AI computing market is defined by its architectural shift away from centralized processing toward decentralized, interconnected nodes. This paradigm enables the execution of AI workloads across cloud servers, on-premises data centers, and edge devices, facilitating parallel processing and enhanced scalability.
  • A key driver is the expansion of IoT, where real-time analytics and predictive maintenance demand low-latency communication that centralized models cannot provide. In a business scenario, a logistics company uses on-device AI for real-time decision making in its warehouses, optimizing routes for autonomous systems and improving operational efficiency.
  • A defining trend is the move toward a hybrid AI model and the edge-to-cloud continuum, where workload orchestration is managed by an MLOps platform. This approach uses techniques like model quantization to run sophisticated AI on resource-constrained devices. However, this distribution introduces challenges in data governance and system integration.
  • Organizations must navigate the complexity of managing a heterogeneous computational infrastructure while ensuring security, a critical factor for successful digital transformation initiatives and achieving scalable AI infrastructure across the enterprise.

What will be the Size of the Distributed AI Computing Market during the forecast period?

Get Key Insights on Market Forecast (PDF) Request Free Sample

How is the Distributed AI Computing Market Segmented?

The distributed ai computing industry research report provides comprehensive data (region-wise segment analysis), with forecasts and estimates in "USD million" for the period 2025-2029.
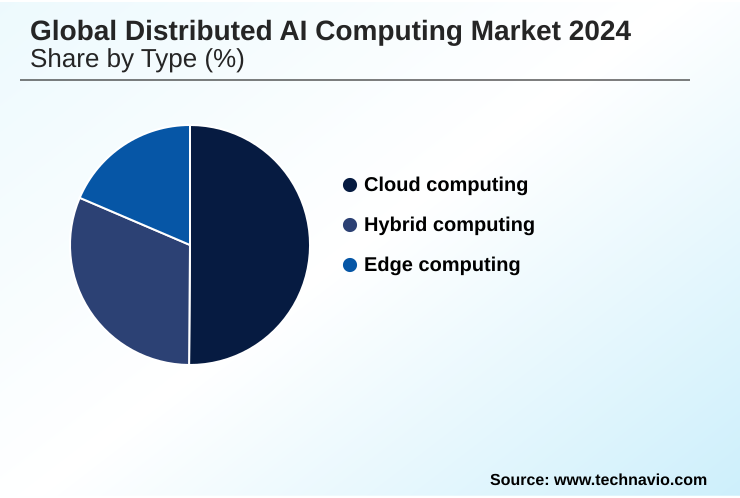
  • Type
    • Cloud computing
    • Hybrid computing
    • Edge computing
  • Software
    • TensorFlow
    • PyTorch
    • ONNX
  • Application
    • Predictive analytics
    • Natural language processing
    • Autonomous systems
  • Geography
    • North America
      • US
      • Canada
      • Mexico
    • APAC
      • China
      • India
      • Japan
    • Europe
      • Germany
      • UK
      • France
    • South America
      • Brazil
      • Argentina
      • Colombia
    • Middle East and Africa
      • Saudi Arabia
      • UAE
      • South Africa
    • Rest of World (ROW)

By Type Insights

The cloud computing segment is estimated to witness significant growth during the forecast period.

The cloud computing segment provides the foundational computational infrastructure for the distributed AI computing market. It enables organizations to execute large-scale distributed training and complex model inference without incurring prohibitive hardware investment.

This architecture is essential for developing sophisticated autonomous systems, where vast datasets are processed using parallel computing techniques. Modern platforms leverage AI accelerator resources and methods like knowledge distillation for AI model optimization.

By utilizing scalable cloud resources for tasks like AI workload partitioning, organizations can achieve significant efficiencies, with some reporting a reduction in model training times by up to 60%.

This approach supports both real-time decision making and the underlying processes of distributed machine learning and federated averaging.

Request Free Sample

Regional Analysis

North America is estimated to contribute 36.1% to the growth of the global market during the forecast period.Technavio’s analysts have elaborately explained the regional trends and drivers that shape the market during the forecast period.

See How Distributed AI Computing Market Demand is Rising in North America Request Free Sample

The geographic landscape of the distributed AI computing market is characterized by distinct regional priorities and growth trajectories.

North America, contributing over 36% of the market's incremental growth, leads in foundational model development, leveraging its robust ecosystem of cloud-native services and advanced tensor processing unit infrastructure.

Europe is concentrating on industrial applications, deploying edge AI for predictive maintenance and collaborative robotics, driven by data sovereignty regulations.

In APAC, which is forecast to be the fastest-growing region, the focus is on smart city projects and scalable AI infrastructure, with widespread adoption of distributed data processing for public services.

Emerging applications in South America and the Middle East, such as remote patient monitoring and smart grid management, showcase the technology's expanding global footprint.

Across all regions, data preprocessing at the edge and on-premises AI deployment are becoming standard practices to enhance efficiency.

Market Dynamics

Our researchers analyzed the data with 2024 as the base year, along with the key drivers, trends, and challenges. A holistic analysis of drivers will help companies refine their marketing strategies to gain a competitive advantage.

  • Strategic implementation of distributed AI is becoming a critical differentiator for businesses. Evaluating the benefits of federated learning in healthcare reveals a clear path to developing robust predictive models without compromising patient data privacy, a significant advantage over centralized training methods.
  • However, enterprises must assess the cost of on-device AI model deployment, which involves not just hardware but also specialized talent. In industrial sectors, distributed AI for predictive maintenance is a primary use case, though success depends on overcoming security risks in edge AI networks.
  • Financial services firms are exploring the hybrid AI model for financial services to balance low-latency fraud detection with large-scale risk analytics. For autonomous systems, addressing edge AI latency in autonomous driving is paramount for safety and reliability.
  • Successfully scaling MLOps for distributed systems requires a sophisticated approach to optimizing workload orchestration in AI and managing resource allocation in distributed computing, a challenge that is more complex than in centralized environments. This is evident as organizations deploying distributed machine learning frameworks see a nearly 2x increase in management overhead compared to monolithic systems.
  • The rise of on-device generative AI use cases and TinyML for industrial IoT sensors is pushing the boundaries of what is possible on resource-constrained hardware. Concurrently, data governance in distributed AI and the challenges in hybrid AI implementation require careful architectural planning to ensure compliance and maintainability.

What are the key market drivers leading to the rise in the adoption of Distributed AI Computing Industry?

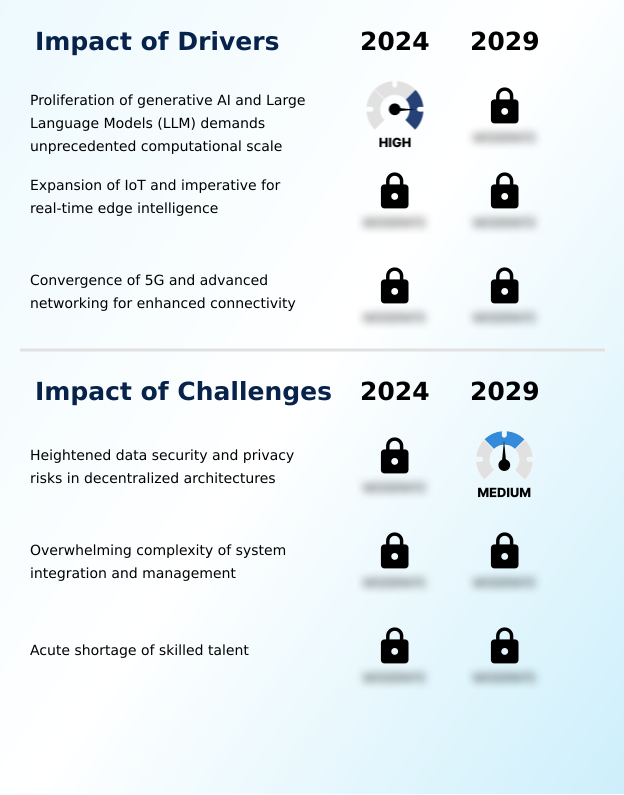
  • The proliferation of generative AI and large language models (LLMs) is a key market driver, demanding unprecedented computational scale that only distributed architectures can provide.

  • The market's primary driver is the demand for real-time intelligence at scale. The expansion of IoT and industrial automation fuels the need for real-time analytics and intelligent automation, where decisions must be made in milliseconds.
  • This is enabled by a robust computational infrastructure that combines powerful AI accelerators for parallel processing with advanced, low-latency communication networks like 5G, which provide 99.9% reliability.
  • In sectors like manufacturing and logistics, this translates to smart factory integration and the operation of autonomous mobility platforms. For instance, AI-powered computer vision systems on production lines can identify defects with greater than 98% accuracy.
  • This convergence of technologies is also critical for emerging applications like smart grid management, where distributed intelligence is essential for optimizing energy distribution and ensuring grid stability.

What are the market trends shaping the Distributed AI Computing Industry?

  • A strategic shift toward a hybrid AI and edge-to-cloud continuum is emerging as a defining market trend. This approach treats edge and cloud as a fluid computational spectrum for intelligent workload allocation.

  • Key market trends are converging around efficiency and privacy. The strategic shift toward a hybrid AI model reflects a maturation from a simple cloud-versus-edge debate to a sophisticated edge-to-cloud continuum. This hybrid computing approach allows for intelligent partitioning of tasks, with on-device AI handling immediate processing while the cloud manages intensive training.
  • This is amplified by the proliferation of on-device generative AI, made possible by advanced model quantization techniques that reduce model sizes by up to 75%. Furthermore, the rise of federated learning as a leading form of privacy-preserving AI is critical, especially in regulated industries.
  • By training on decentralized data, organizations can improve model accuracy without centralizing sensitive information, unlocking new TinyML applications while adhering to strict data policies.

What challenges does the Distributed AI Computing Industry face during its growth?

  • Heightened data security and privacy risks inherent in decentralized architectures present a key challenge to industry growth and adoption.

  • The primary challenges in the market stem from operational complexity and security vulnerabilities. The decentralized nature of the network architecture creates an expanded attack surface, with some analyses suggesting a 500% increase in potential entry points compared to centralized systems, complicating data governance.
  • System integration is another significant hurdle, as orchestrating a heterogeneous mix of hardware and software requires a sophisticated MLOps platform and expertise in AI algorithm deployment. Managing MLOps for edge environments is particularly difficult, as it involves continuous monitoring and updating of models on thousands of resource-constrained devices.
  • This complexity is compounded by a severe talent shortage, with hiring cycles for engineers skilled in workload orchestration and secure multi-party computation often exceeding 120 days, slowing down digital transformation initiatives.

Exclusive Technavio Analysis on Customer Landscape

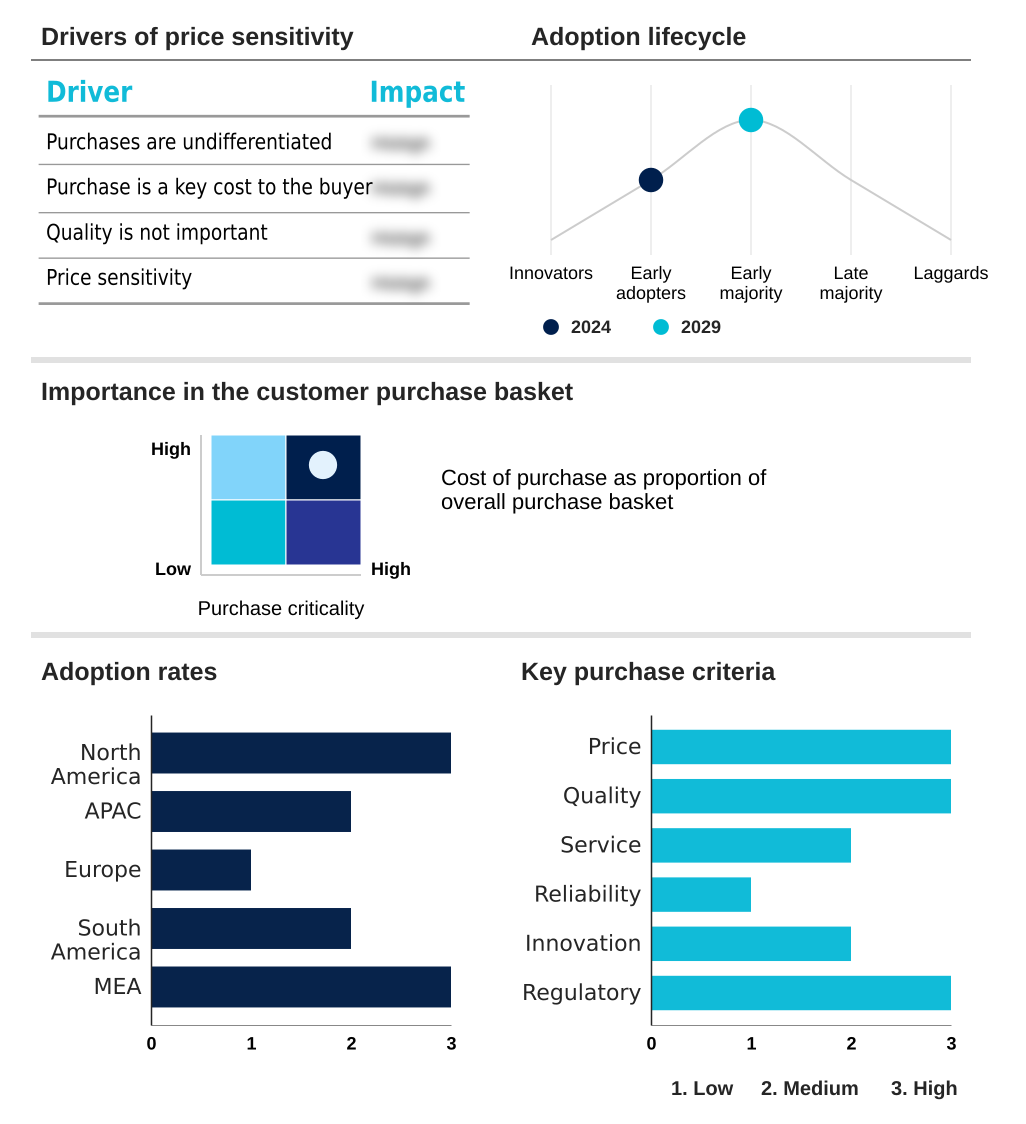
The distributed ai computing market forecasting report includes the adoption lifecycle of the market, covering from the innovator’s stage to the laggard’s stage. It focuses on adoption rates in different regions based on penetration. Furthermore, the distributed ai computing market report also includes key purchase criteria and drivers of price sensitivity to help companies evaluate and develop their market growth analysis strategies.

Customer Landscape of Distributed AI Computing Industry

Competitive Landscape

Companies are implementing various strategies, such as strategic alliances, distributed ai computing market forecast, partnerships, mergers and acquisitions, geographical expansion, and product/service launches, to enhance their presence in the industry.

Advanced Micro Devices Inc. - The company delivers specialized GPU and CPU architectures optimized for parallel processing, enabling scalable, large-scale distributed AI computing workloads for advanced enterprise applications.

The industry research and growth report includes detailed analyses of the competitive landscape of the market and information about key companies, including:

  • Advanced Micro Devices Inc.
  • Alibaba Cloud
  • Amazon.com Inc.
  • Baidu Inc.
  • Fujitsu Ltd.
  • Google LLC
  • Graphcore Ltd.
  • Hewlett Packard
  • Huawei Technologies Co. Ltd.
  • Infosys Ltd.
  • Intel Corp.
  • IBM Corp.
  • Meta Platforms Inc.
  • Microsoft Corp.
  • NEC Corp.
  • NVIDIA Corp.
  • Oracle Corp.
  • Samsung Electronics Co. Ltd.
  • SAP SE
  • Siemens AG
  • Tencent Holdings Ltd.

Qualitative and quantitative analysis of companies has been conducted to help clients understand the wider business environment as well as the strengths and weaknesses of key industry players. Data is qualitatively analyzed to categorize companies as pure play, category-focused, industry-focused, and diversified; it is quantitatively analyzed to categorize companies as dominant, leading, strong, tentative, and weak.

Recent Development and News in Distributed ai computing market

  • In September 2024, A leading European automotive consortium launched a cross-border initiative to standardize federated learning protocols for developing advanced driver-assistance systems (ADAS), aiming to improve vehicle safety without centralizing sensitive driving data.
  • In January 2025, A major cloud service provider unveiled a new suite of tools for its distributed cloud platform, specifically designed to simplify MLOps for hybrid AI models, reducing deployment complexity by an estimated 40% for enterprise users.
  • In March 2025, The South Korean government announced plans to establish a USD 34 billion fund to support companies in strategic technology sectors, including semiconductors and AI, to bolster its sovereign capabilities.
  • In May 2025, Qualcomm announced its latest AI Engine offers native, hardware-accelerated support for a wider range of ONNX operators, improving efficiency for complex models on battery-powered mobile platforms.

Dive into Technavio’s robust research methodology, blending expert interviews, extensive data synthesis, and validated models for unparalleled Distributed AI Computing Market insights. See full methodology.

Market Scope
Page number 289
Base year 2024
Forecast period 2025-2029
Growth momentum & CAGR Accelerate at a CAGR of 21.5%
Market growth 2025-2029 USD 8733.7 million
Market structure Fragmented
YoY growth 2024-2025(%) 20.6%
Key countries US, Canada, Mexico, China, India, Japan, Australia, South Korea, Indonesia, Germany, UK, France, Italy, Spain, The Netherlands, Brazil, Argentina, Colombia, Saudi Arabia, UAE, South Africa, Israel and Turkey
Competitive landscape Leading Companies, Market Positioning of Companies, Competitive Strategies, and Industry Risks

Request Free Sample

Research Analyst Overview

  • The distributed AI computing market is driven by the imperative to process data closer to its source, fundamentally reshaping computational infrastructure. The adoption of a hybrid AI model, which intelligently partitions workloads between the cloud and edge, is now a mainstream strategy.
  • This is enabled by federated learning and other techniques for handling decentralized data, allowing for complex model inference and distributed training without centralizing sensitive information. Key components facilitating this shift include the neural processing unit and the tensor processing unit, which serve as powerful AI accelerators for both on-device AI and large-scale parallel processing.
  • Managing these complex ecosystems requires a sophisticated MLOps platform for continuous workload orchestration, deployment, and robust data governance. For boardroom consideration, the choice of network architecture directly impacts the efficacy of low-latency communication, a critical factor for real-time analytics in autonomous systems. For example, systems leveraging optimized architectures have demonstrated a 30% reduction in decision-making latency.
  • As models become more complex, techniques like model quantization, knowledge distillation, and efficient data preprocessing, managed through a high-performance inference engine, are essential for deploying AI on resource-constrained devices for applications such as predictive maintenance.

What are the Key Data Covered in this Distributed AI Computing Market Research and Growth Report?

  • What is the expected growth of the Distributed AI Computing Market between 2025 and 2029?

    • USD 8.73 billion, at a CAGR of 21.5%

  • What segmentation does the market report cover?

    • The report is segmented by Type (Cloud computing, Hybrid computing, Edge computing), Software (TensorFlow, PyTorch, ONNX), Application (Predictive analytics, Natural language processing, Autonomous systems) and Geography (North America, APAC, Europe, South America, Middle East and Africa)

  • Which regions are analyzed in the report?

    • North America, APAC, Europe, South America and Middle East and Africa

  • What are the key growth drivers and market challenges?

    • Proliferation of generative AI and Large Language Models (LLM) demands unprecedented computational scale, Heightened data security and privacy risks in decentralized architectures

  • Who are the major players in the Distributed AI Computing Market?

    • Advanced Micro Devices Inc., Alibaba Cloud, Amazon.com Inc., Baidu Inc., Fujitsu Ltd., Google LLC, Graphcore Ltd., Hewlett Packard, Huawei Technologies Co. Ltd., Infosys Ltd., Intel Corp., IBM Corp., Meta Platforms Inc., Microsoft Corp., NEC Corp., NVIDIA Corp., Oracle Corp., Samsung Electronics Co. Ltd., SAP SE, Siemens AG and Tencent Holdings Ltd.

Market Research Insights

  • The dynamics of the distributed AI computing market are shaped by the strategic need for real-time decision making and operational resilience. Adoption of hybrid computing models is accelerating, with enterprises that partition AI workloads between edge and cloud reporting up to a 40% reduction in data transmission costs.
  • Furthermore, the integration of on-device generative AI into consumer electronics is a significant factor, with such devices demonstrating a 3X faster response time compared to cloud-dependent alternatives. This shift is enabled by advancements in AI model optimization and TinyML applications.
  • In industrial settings, smart factory integration driven by AI-powered computer vision and intelligent automation is delivering measurable ROI, with some facilities achieving a 15% improvement in production throughput by deploying privacy-preserving AI for quality control directly on the assembly line.

We can help! Our analysts can customize this distributed ai computing market research report to meet your requirements.

Get in touch

1. Executive Summary

1.1 Market overview

Executive Summary - Chart on Market Overview
Executive Summary - Data Table on Market Overview
Executive Summary - Chart on Global Market Characteristics
Executive Summary - Chart on Market by Geography
Executive Summary - Chart on Market Segmentation by Type
Executive Summary - Chart on Market Segmentation by Software
Executive Summary - Chart on Market Segmentation by Application
Executive Summary - Chart on Incremental Growth
Executive Summary - Data Table on Incremental Growth
Executive Summary - Chart on Company Market Positioning

2. Technavio Analysis

2.1 Analysis of price sensitivity, lifecycle, customer purchase basket, adoption rates, and purchase criteria

2.2 Criticality of inputs and Factors of differentiation

Chart on Overview on criticality of inputs and factors of differentiation

2.3 Factors of disruption

Chart on Overview on factors of disruption

2.4 Impact of drivers and challenges

Chart on Impact of drivers and challenges in 2024 and 2029

3. Market Landscape

3.1 Market ecosystem

Chart on Parent Market
Data Table on - Parent Market

3.2 Market characteristics

Chart on Market characteristics analysis

3.3 Value chain analysis

Chart on Value chain analysis

4. Market Sizing

4.1 Market definition

Data Table on Offerings of companies included in the market definition

4.2 Market segment analysis

Market segments

4.3 Market size 2024

4.4 Market outlook: Forecast for 2024-2029

Chart on Global - Market size and forecast 2024-2029 ($ million)
Data Table on Global - Market size and forecast 2024-2029 ($ million)
Chart on Global Market: Year-over-year growth 2024-2029 (%)
Data Table on Global Market: Year-over-year growth 2024-2029 (%)

5. Five Forces Analysis

5.1 Five forces summary

Five forces analysis - Comparison between 2024 and 2029

5.2 Bargaining power of buyers

Bargaining power of buyers - Impact of key factors 2024 and 2029

5.3 Bargaining power of suppliers

Bargaining power of suppliers - Impact of key factors in 2024 and 2029

5.4 Threat of new entrants

Threat of new entrants - Impact of key factors in 2024 and 2029

5.5 Threat of substitutes

Threat of substitutes - Impact of key factors in 2024 and 2029

5.6 Threat of rivalry

Threat of rivalry - Impact of key factors in 2024 and 2029

5.7 Market condition

Chart on Market condition - Five forces 2024 and 2029

6. Market Segmentation by Type

6.1 Market segments

Chart on Type - Market share 2024-2029 (%)
Data Table on Type - Market share 2024-2029 (%)

6.2 Comparison by Type

Chart on Comparison by Type
Data Table on Comparison by Type

6.3 Cloud computing - Market size and forecast 2024-2029

Chart on Cloud computing - Market size and forecast 2024-2029 ($ million)
Data Table on Cloud computing - Market size and forecast 2024-2029 ($ million)
Chart on Cloud computing - Year-over-year growth 2024-2029 (%)
Data Table on Cloud computing - Year-over-year growth 2024-2029 (%)

6.4 Hybrid computing - Market size and forecast 2024-2029

Chart on Hybrid computing - Market size and forecast 2024-2029 ($ million)
Data Table on Hybrid computing - Market size and forecast 2024-2029 ($ million)
Chart on Hybrid computing - Year-over-year growth 2024-2029 (%)
Data Table on Hybrid computing - Year-over-year growth 2024-2029 (%)

6.5 Edge computing - Market size and forecast 2024-2029

Chart on Edge computing - Market size and forecast 2024-2029 ($ million)
Data Table on Edge computing - Market size and forecast 2024-2029 ($ million)
Chart on Edge computing - Year-over-year growth 2024-2029 (%)
Data Table on Edge computing - Year-over-year growth 2024-2029 (%)

6.6 Market opportunity by Type

Market opportunity by Type ($ million)
Data Table on Market opportunity by Type ($ million)

7. Market Segmentation by Software

7.1 Market segments

Chart on Software - Market share 2024-2029 (%)
Data Table on Software - Market share 2024-2029 (%)

7.2 Comparison by Software

Chart on Comparison by Software
Data Table on Comparison by Software

7.3 TensorFlow - Market size and forecast 2024-2029

Chart on TensorFlow - Market size and forecast 2024-2029 ($ million)
Data Table on TensorFlow - Market size and forecast 2024-2029 ($ million)
Chart on TensorFlow - Year-over-year growth 2024-2029 (%)
Data Table on TensorFlow - Year-over-year growth 2024-2029 (%)

7.4 PyTorch - Market size and forecast 2024-2029

Chart on PyTorch - Market size and forecast 2024-2029 ($ million)
Data Table on PyTorch - Market size and forecast 2024-2029 ($ million)
Chart on PyTorch - Year-over-year growth 2024-2029 (%)
Data Table on PyTorch - Year-over-year growth 2024-2029 (%)

7.5 ONNX - Market size and forecast 2024-2029

Chart on ONNX - Market size and forecast 2024-2029 ($ million)
Data Table on ONNX - Market size and forecast 2024-2029 ($ million)
Chart on ONNX - Year-over-year growth 2024-2029 (%)
Data Table on ONNX - Year-over-year growth 2024-2029 (%)

7.6 Market opportunity by Software

Market opportunity by Software ($ million)
Data Table on Market opportunity by Software ($ million)

8. Market Segmentation by Application

8.1 Market segments

Chart on Application - Market share 2024-2029 (%)
Data Table on Application - Market share 2024-2029 (%)

8.2 Comparison by Application

Chart on Comparison by Application
Data Table on Comparison by Application

8.3 Predictive analytics - Market size and forecast 2024-2029

Chart on Predictive analytics - Market size and forecast 2024-2029 ($ million)
Data Table on Predictive analytics - Market size and forecast 2024-2029 ($ million)
Chart on Predictive analytics - Year-over-year growth 2024-2029 (%)
Data Table on Predictive analytics - Year-over-year growth 2024-2029 (%)

8.4 Natural language processing - Market size and forecast 2024-2029

Chart on Natural language processing - Market size and forecast 2024-2029 ($ million)
Data Table on Natural language processing - Market size and forecast 2024-2029 ($ million)
Chart on Natural language processing - Year-over-year growth 2024-2029 (%)
Data Table on Natural language processing - Year-over-year growth 2024-2029 (%)

8.5 Autonomous systems - Market size and forecast 2024-2029

Chart on Autonomous systems - Market size and forecast 2024-2029 ($ million)
Data Table on Autonomous systems - Market size and forecast 2024-2029 ($ million)
Chart on Autonomous systems - Year-over-year growth 2024-2029 (%)
Data Table on Autonomous systems - Year-over-year growth 2024-2029 (%)

8.6 Market opportunity by Application

Market opportunity by Application ($ million)
Data Table on Market opportunity by Application ($ million)

9. Customer Landscape

9.1 Customer landscape overview

Analysis of price sensitivity, lifecycle, customer purchase basket, adoption rates, and purchase criteria

10. Geographic Landscape

10.1 Geographic segmentation

Chart on Market share by geography 2024-2029 (%)
Data Table on Market share by geography 2024-2029 (%)

10.2 Geographic comparison

Chart on Geographic comparison
Data Table on Geographic comparison

10.3 North America - Market size and forecast 2024-2029

Chart on North America - Market size and forecast 2024-2029 ($ million)
Data Table on North America - Market size and forecast 2024-2029 ($ million)
Chart on North America - Year-over-year growth 2024-2029 (%)
Data Table on North America - Year-over-year growth 2024-2029 (%)
Chart on Regional Comparison - North America
Data Table on Regional Comparison - North America

10.3.1 US - Market size and forecast 2024-2029

Chart on US - Market size and forecast 2024-2029 ($ million)
Data Table on US - Market size and forecast 2024-2029 ($ million)
Chart on US - Year-over-year growth 2024-2029 (%)
Data Table on US - Year-over-year growth 2024-2029 (%)

10.3.2 Canada - Market size and forecast 2024-2029

Chart on Canada - Market size and forecast 2024-2029 ($ million)
Data Table on Canada - Market size and forecast 2024-2029 ($ million)
Chart on Canada - Year-over-year growth 2024-2029 (%)
Data Table on Canada - Year-over-year growth 2024-2029 (%)

10.3.3 Mexico - Market size and forecast 2024-2029

Chart on Mexico - Market size and forecast 2024-2029 ($ million)
Data Table on Mexico - Market size and forecast 2024-2029 ($ million)
Chart on Mexico - Year-over-year growth 2024-2029 (%)
Data Table on Mexico - Year-over-year growth 2024-2029 (%)

10.4 APAC - Market size and forecast 2024-2029

Chart on APAC - Market size and forecast 2024-2029 ($ million)
Data Table on APAC - Market size and forecast 2024-2029 ($ million)
Chart on APAC - Year-over-year growth 2024-2029 (%)
Data Table on APAC - Year-over-year growth 2024-2029 (%)
Chart on Regional Comparison - APAC
Data Table on Regional Comparison - APAC

10.4.1 China - Market size and forecast 2024-2029

Chart on China - Market size and forecast 2024-2029 ($ million)
Data Table on China - Market size and forecast 2024-2029 ($ million)
Chart on China - Year-over-year growth 2024-2029 (%)
Data Table on China - Year-over-year growth 2024-2029 (%)

10.4.2 India - Market size and forecast 2024-2029

Chart on India - Market size and forecast 2024-2029 ($ million)
Data Table on India - Market size and forecast 2024-2029 ($ million)
Chart on India - Year-over-year growth 2024-2029 (%)
Data Table on India - Year-over-year growth 2024-2029 (%)

10.4.3 Japan - Market size and forecast 2024-2029

Chart on Japan - Market size and forecast 2024-2029 ($ million)
Data Table on Japan - Market size and forecast 2024-2029 ($ million)
Chart on Japan - Year-over-year growth 2024-2029 (%)
Data Table on Japan - Year-over-year growth 2024-2029 (%)

10.4.4 Australia - Market size and forecast 2024-2029

Chart on Australia - Market size and forecast 2024-2029 ($ million)
Data Table on Australia - Market size and forecast 2024-2029 ($ million)
Chart on Australia - Year-over-year growth 2024-2029 (%)
Data Table on Australia - Year-over-year growth 2024-2029 (%)

10.4.5 South Korea - Market size and forecast 2024-2029

Chart on South Korea - Market size and forecast 2024-2029 ($ million)
Data Table on South Korea - Market size and forecast 2024-2029 ($ million)
Chart on South Korea - Year-over-year growth 2024-2029 (%)
Data Table on South Korea - Year-over-year growth 2024-2029 (%)

10.4.6 Indonesia - Market size and forecast 2024-2029

Chart on Indonesia - Market size and forecast 2024-2029 ($ million)
Data Table on Indonesia - Market size and forecast 2024-2029 ($ million)
Chart on Indonesia - Year-over-year growth 2024-2029 (%)
Data Table on Indonesia - Year-over-year growth 2024-2029 (%)

10.5 Europe - Market size and forecast 2024-2029

Chart on Europe - Market size and forecast 2024-2029 ($ million)
Data Table on Europe - Market size and forecast 2024-2029 ($ million)
Chart on Europe - Year-over-year growth 2024-2029 (%)
Data Table on Europe - Year-over-year growth 2024-2029 (%)
Chart on Regional Comparison - Europe
Data Table on Regional Comparison - Europe

10.5.1 Germany - Market size and forecast 2024-2029

Chart on Germany - Market size and forecast 2024-2029 ($ million)
Data Table on Germany - Market size and forecast 2024-2029 ($ million)
Chart on Germany - Year-over-year growth 2024-2029 (%)
Data Table on Germany - Year-over-year growth 2024-2029 (%)

10.5.2 UK - Market size and forecast 2024-2029

Chart on UK - Market size and forecast 2024-2029 ($ million)
Data Table on UK - Market size and forecast 2024-2029 ($ million)
Chart on UK - Year-over-year growth 2024-2029 (%)
Data Table on UK - Year-over-year growth 2024-2029 (%)

10.5.3 France - Market size and forecast 2024-2029

Chart on France - Market size and forecast 2024-2029 ($ million)
Data Table on France - Market size and forecast 2024-2029 ($ million)
Chart on France - Year-over-year growth 2024-2029 (%)
Data Table on France - Year-over-year growth 2024-2029 (%)

10.5.4 Italy - Market size and forecast 2024-2029

Chart on Italy - Market size and forecast 2024-2029 ($ million)
Data Table on Italy - Market size and forecast 2024-2029 ($ million)
Chart on Italy - Year-over-year growth 2024-2029 (%)
Data Table on Italy - Year-over-year growth 2024-2029 (%)

10.5.5 Spain - Market size and forecast 2024-2029

Chart on Spain - Market size and forecast 2024-2029 ($ million)
Data Table on Spain - Market size and forecast 2024-2029 ($ million)
Chart on Spain - Year-over-year growth 2024-2029 (%)
Data Table on Spain - Year-over-year growth 2024-2029 (%)

10.5.6 The Netherlands - Market size and forecast 2024-2029

Chart on The Netherlands - Market size and forecast 2024-2029 ($ million)
Data Table on The Netherlands - Market size and forecast 2024-2029 ($ million)
Chart on The Netherlands - Year-over-year growth 2024-2029 (%)
Data Table on The Netherlands - Year-over-year growth 2024-2029 (%)

10.6 South America - Market size and forecast 2024-2029

Chart on South America - Market size and forecast 2024-2029 ($ million)
Data Table on South America - Market size and forecast 2024-2029 ($ million)
Chart on South America - Year-over-year growth 2024-2029 (%)
Data Table on South America - Year-over-year growth 2024-2029 (%)
Chart on Regional Comparison - South America
Data Table on Regional Comparison - South America

10.6.1 Brazil - Market size and forecast 2024-2029

Chart on Brazil - Market size and forecast 2024-2029 ($ million)
Data Table on Brazil - Market size and forecast 2024-2029 ($ million)
Chart on Brazil - Year-over-year growth 2024-2029 (%)
Data Table on Brazil - Year-over-year growth 2024-2029 (%)

10.6.2 Argentina - Market size and forecast 2024-2029

Chart on Argentina - Market size and forecast 2024-2029 ($ million)
Data Table on Argentina - Market size and forecast 2024-2029 ($ million)
Chart on Argentina - Year-over-year growth 2024-2029 (%)
Data Table on Argentina - Year-over-year growth 2024-2029 (%)

10.6.3 Colombia - Market size and forecast 2024-2029

Chart on Colombia - Market size and forecast 2024-2029 ($ million)
Data Table on Colombia - Market size and forecast 2024-2029 ($ million)
Chart on Colombia - Year-over-year growth 2024-2029 (%)
Data Table on Colombia - Year-over-year growth 2024-2029 (%)

10.7 Middle East and Africa - Market size and forecast 2024-2029

Chart on Middle East and Africa - Market size and forecast 2024-2029 ($ million)
Data Table on Middle East and Africa - Market size and forecast 2024-2029 ($ million)
Chart on Middle East and Africa - Year-over-year growth 2024-2029 (%)
Data Table on Middle East and Africa - Year-over-year growth 2024-2029 (%)
Chart on Regional Comparison - Middle East and Africa
Data Table on Regional Comparison - Middle East and Africa

10.7.1 Saudi Arabia - Market size and forecast 2024-2029

Chart on Saudi Arabia - Market size and forecast 2024-2029 ($ million)
Data Table on Saudi Arabia - Market size and forecast 2024-2029 ($ million)
Chart on Saudi Arabia - Year-over-year growth 2024-2029 (%)
Data Table on Saudi Arabia - Year-over-year growth 2024-2029 (%)

10.7.2 UAE - Market size and forecast 2024-2029

Chart on UAE - Market size and forecast 2024-2029 ($ million)
Data Table on UAE - Market size and forecast 2024-2029 ($ million)
Chart on UAE - Year-over-year growth 2024-2029 (%)
Data Table on UAE - Year-over-year growth 2024-2029 (%)

10.7.3 South Africa - Market size and forecast 2024-2029

Chart on South Africa - Market size and forecast 2024-2029 ($ million)
Data Table on South Africa - Market size and forecast 2024-2029 ($ million)
Chart on South Africa - Year-over-year growth 2024-2029 (%)
Data Table on South Africa - Year-over-year growth 2024-2029 (%)

10.7.4 Israel - Market size and forecast 2024-2029

Chart on Israel - Market size and forecast 2024-2029 ($ million)
Data Table on Israel - Market size and forecast 2024-2029 ($ million)
Chart on Israel - Year-over-year growth 2024-2029 (%)
Data Table on Israel - Year-over-year growth 2024-2029 (%)

10.7.5 Turkey - Market size and forecast 2024-2029

Chart on Turkey - Market size and forecast 2024-2029 ($ million)
Data Table on Turkey - Market size and forecast 2024-2029 ($ million)
Chart on Turkey - Year-over-year growth 2024-2029 (%)
Data Table on Turkey - Year-over-year growth 2024-2029 (%)

10.8 Market opportunity by geography

Market opportunity by geography ($ million)
Data Tables on Market opportunity by geography ($ million)

11. Drivers, Challenges, and Opportunity

11.1 Market drivers

Proliferation of generative AI and Large Language Models (LLM) demands unprecedented computational scale
Expansion of IoT and imperative for real-time edge intelligence
Convergence of 5G and advanced networking for enhanced connectivity

11.2 Market challenges

Heightened data security and privacy risks in decentralized architectures
Overwhelming complexity of system integration and management
Acute shortage of skilled talent

11.3 Impact of drivers and challenges

Impact of drivers and challenges in 2024 and 2029

11.4 Market opportunities

Strategic shift towards hybrid AI and edge-to-cloud continuum
Proliferation of TinyML and on-device generative AI
Ascendancy of federated Learning and Privacy-Preserving AI

12. Competitive Landscape

12.1 Overview

12.2

Overview on criticality of inputs and factors of differentiation

12.3 Landscape disruption

Overview on factors of disruption

12.4 Industry risks

Impact of key risks on business

13. Competitive Analysis

13.1 Companies profiled

Companies covered

13.2 Company ranking index

13.3 Market positioning of companies

Matrix on companies position and classification

13.4 Advanced Micro Devices Inc.

Advanced Micro Devices Inc. - Overview
Advanced Micro Devices Inc. - Business segments
Advanced Micro Devices Inc. - Key news
Advanced Micro Devices Inc. - Key offerings
Advanced Micro Devices Inc. - Segment focus
SWOT

13.5 Alibaba Cloud

Alibaba Cloud - Overview
Alibaba Cloud - Product / Service
Alibaba Cloud - Key offerings
SWOT

13.6 Amazon.com Inc.

Amazon.com Inc. - Overview
Amazon.com Inc. - Business segments
Amazon.com Inc. - Key news
Amazon.com Inc. - Key offerings
Amazon.com Inc. - Segment focus
SWOT

13.7 Fujitsu Ltd.

Fujitsu Ltd. - Overview
Fujitsu Ltd. - Business segments
Fujitsu Ltd. - Key news
Fujitsu Ltd. - Key offerings
Fujitsu Ltd. - Segment focus
SWOT

13.8 Google LLC

Google LLC - Overview
Google LLC - Product / Service
Google LLC - Key offerings
SWOT

13.9 Hewlett Packard

Hewlett Packard - Overview
Hewlett Packard - Business segments
Hewlett Packard - Key news
Hewlett Packard - Key offerings
Hewlett Packard - Segment focus
SWOT

13.10 Huawei Technologies Co. Ltd.

Huawei Technologies Co. Ltd. - Overview
Huawei Technologies Co. Ltd. - Product / Service
Huawei Technologies Co. Ltd. - Key news
Huawei Technologies Co. Ltd. - Key offerings
SWOT

13.11 Intel Corp.

Intel Corp. - Overview
Intel Corp. - Business segments
Intel Corp. - Key news
Intel Corp. - Key offerings
Intel Corp. - Segment focus
SWOT

13.12 IBM Corp.

IBM Corp. - Overview
IBM Corp. - Business segments
IBM Corp. - Key news
IBM Corp. - Key offerings
IBM Corp. - Segment focus
SWOT

13.13 Microsoft Corp.

Microsoft Corp. - Overview
Microsoft Corp. - Business segments
Microsoft Corp. - Key news
Microsoft Corp. - Key offerings
Microsoft Corp. - Segment focus
SWOT

13.14 NEC Corp.

NEC Corp. - Overview
NEC Corp. - Business segments
NEC Corp. - Key news
NEC Corp. - Key offerings
NEC Corp. - Segment focus
SWOT

13.15 NVIDIA Corp.

NVIDIA Corp. - Overview
NVIDIA Corp. - Business segments
NVIDIA Corp. - Key news
NVIDIA Corp. - Key offerings
NVIDIA Corp. - Segment focus
SWOT

13.16 Oracle Corp.

Oracle Corp. - Overview
Oracle Corp. - Business segments
Oracle Corp. - Key news
Oracle Corp. - Key offerings
Oracle Corp. - Segment focus
SWOT

13.17 SAP SE

SAP SE - Overview
SAP SE - Business segments
SAP SE - Key news
SAP SE - Key offerings
SAP SE - Segment focus
SWOT

13.18 Tencent Holdings Ltd.

Tencent Holdings Ltd. - Overview
Tencent Holdings Ltd. - Business segments
Tencent Holdings Ltd. - Key news
Tencent Holdings Ltd. - Key offerings
Tencent Holdings Ltd. - Segment focus
SWOT

14. Appendix

14.1 Scope of the report

Market definition
Objectives
Notes and caveats

14.2 Inclusions and exclusions checklist

Inclusions checklist
Exclusions checklist

14.3 Currency conversion rates for US$

14.4 Research methodology

14.5 Data procurement

Information sources

14.6 Data validation

14.7 Validation techniques employed for market sizing

14.8 Data synthesis

14.9 360 degree market analysis

14.10 List of abbreviations

Research Methodology

Technavio presents a detailed picture of the market by way of study, synthesis, and summation of data from multiple sources. The analysts have presented the various facets of the market with a particular focus on identifying the key industry influencers. The data thus presented is comprehensive, reliable, and the result of extensive research, both primary and secondary.

INFORMATION SOURCES

Primary sources

  • Manufacturers and suppliers
  • Channel partners
  • Industry experts
  • Strategic decision makers

Secondary sources

  • Industry journals and periodicals
  • Government data
  • Financial reports of key industry players
  • Historical data
  • Press releases

DATA ANALYSIS

Data Synthesis

  • Collation of data
  • Estimation of key figures
  • Analysis of derived insights

Data Validation

  • Triangulation with data models
  • Reference against proprietary databases
  • Corroboration with industry experts

REPORT WRITING

Qualitative

  • Market drivers
  • Market challenges
  • Market trends
  • Five forces analysis

Quantitative

  • Market size and forecast
  • Market segmentation
  • Geographical insights
  • Competitive landscape

Interested in this report?

Get your sample now to see our research methodology and insights!

Download Now

Frequently Asked Questions

Distributed AI Computing market growth will increase by USD 8733.7 million during 2025-2029.

The Distributed AI Computing market is expected to grow at a CAGR of 21.5% during 2025-2029.

Distributed AI Computing market is segmented by Type (Cloud computing, Hybrid computing, Edge computing) Software (TensorFlow, PyTorch, ONNX) Application (Predictive analytics, Natural language processing, Autonomous systems)

Advanced Micro Devices Inc., Alibaba Cloud, Amazon.com Inc., Baidu Inc., Fujitsu Ltd., Google LLC, Graphcore Ltd., Hewlett Packard, Huawei Technologies Co. Ltd., Infosys Ltd., Intel Corp., IBM Corp., Meta Platforms Inc., Microsoft Corp., NEC Corp., NVIDIA Corp., Oracle Corp., Samsung Electronics Co. Ltd., SAP SE, Siemens AG, Tencent Holdings Ltd. are a few of the key vendors in the Distributed AI Computing market.

North America will register the highest growth rate of 36.1% among the other regions. Therefore, the Distributed AI Computing market in North America is expected to garner significant business opportunities for the vendors during the forecast period.

US, Canada, Mexico, China, India, Japan, Australia, South Korea, Indonesia, Germany, UK, France, Italy, Spain, The Netherlands, Brazil, Argentina, Colombia, Saudi Arabia, UAE, South Africa, Israel, Turkey

  • Proliferation of generative AI and Large Language Models (LLM) demands unprecedented computational scale is the driving factor this market.

The Distributed AI Computing market vendors should focus on grabbing business opportunities from the Type segment as it accounted for the largest market share in the base year.