
Distributed Control Systems (DCS) In Oil And Gas Industry Market Size 2026-2030
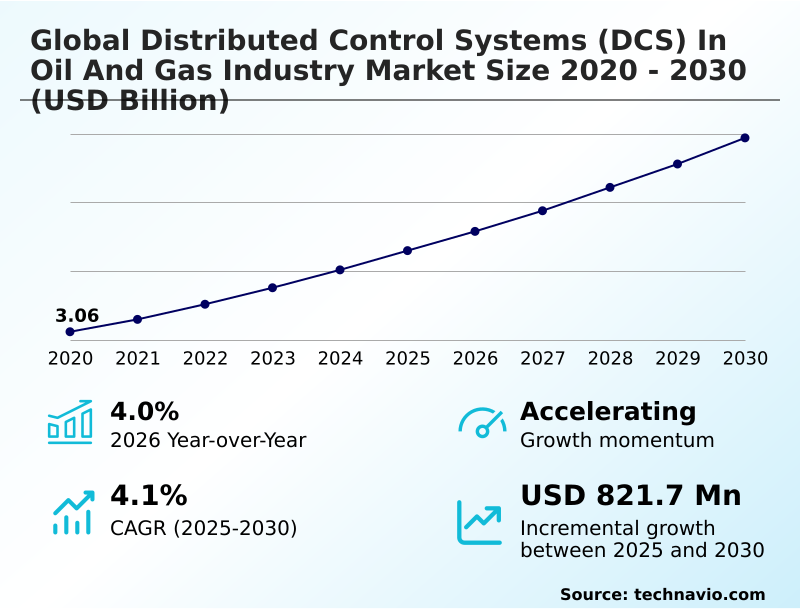
The distributed control systems (dcs) in oil and gas industry market size is valued to increase by USD 821.7 million, at a CAGR of 4.1% from 2025 to 2030. Imperative for modernization of aging infrastructure will drive the distributed control systems (dcs) in oil and gas industry market.
Major Market Trends & Insights
- North America dominated the market and accounted for a 33.2% growth during the forecast period.
- By Application - Oil processing segment was valued at USD 1.52 billion in 2024
- By Component - Software segment accounted for the largest market revenue share in 2024
Market Size & Forecast
- Market Opportunities: USD 1.41 billion
- Market Future Opportunities: USD 821.7 million
- CAGR from 2025 to 2030 : 4.1%
Market Summary
- The distributed control systems (DCS) in oil and gas industry market is fundamentally shifting from a focus on basic process regulation to enabling enterprise-wide operational intelligence. The primary impetus for investment is the need to modernize aging infrastructure, where system obsolescence risk introduces significant safety and financial liabilities.
- This modernization is not just about replacing hardware but about creating a future-proof automation foundation. For instance, a downstream refinery operator leverages a modern DCS to do more than just manage distillation columns; it integrates predictive maintenance algorithms that analyze real-time data from thousands of sensors, anticipating pump failures before they occur.
- This proactive approach, powered by the convergence of operational technology and information technology, minimizes unplanned downtime and enhances asset performance management. Simultaneously, adherence to stringent safety and environmental regulations necessitates platforms with integrated safety instrumented systems and robust cybersecurity protocols.
- This evolution positions the DCS as a strategic asset for achieving operational excellence, optimizing energy efficiency, and ensuring secure, compliant operations in a competitive and highly regulated environment.
What will be the Size of the Distributed Control Systems (DCS) In Oil And Gas Industry Market during the forecast period?
Get Key Insights on Market Forecast (PDF) Get Free Sample
How is the Distributed Control Systems (DCS) In Oil And Gas Industry Market Segmented?
The distributed control systems (dcs) in oil and gas industry industry research report provides comprehensive data (region-wise segment analysis), with forecasts and estimates in "USD million" for the period 2026-2030, as well as historical data from 2020-2024 for the following segments.
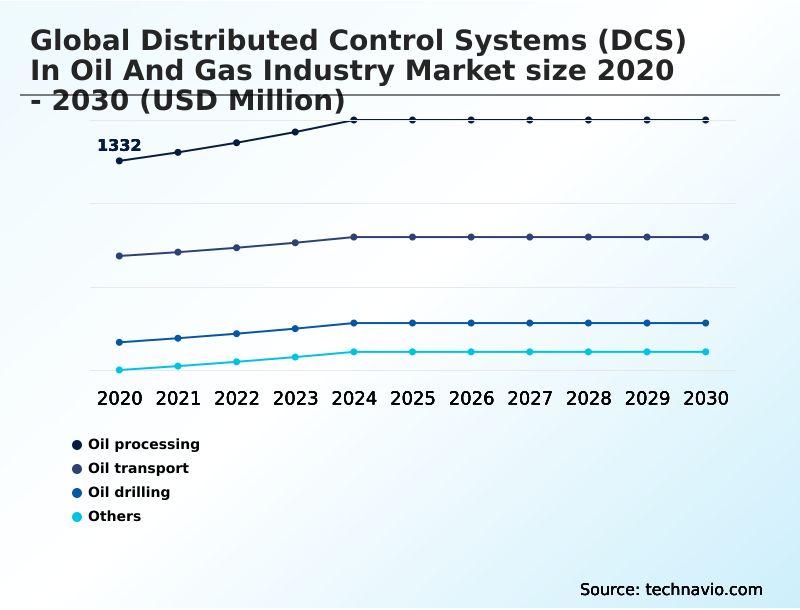
- Application
- Oil processing
- Oil transport
- Oil drilling
- Others
- Component
- Software
- Hardware
- Services
- End-user
- Onshore
- Offshore
- Geography
- North America
- US
- Canada
- Mexico
- Middle East and Africa
- Saudi Arabia
- UAE
- South Africa
- Europe
- Germany
- UK
- France
- APAC
- China
- India
- Japan
- South America
- Brazil
- Argentina
- Colombia
- Rest of World (ROW)
- North America
By Application Insights
The oil processing segment is estimated to witness significant growth during the forecast period.
The oil processing segment is foundational, focused on stabilizing raw hydrocarbon streams by separating crude oil, gas, and water.
A distributed control system (DCS) serves as the facility's central nervous system, providing integrated control and safety functions for complex and hazardous unit operations like multi-stage separation and acid gas removal.
The imperative is precise management of pressure and temperature to meet quality specifications for transport, a function executed with high reliability via sophisticated process automation platforms.
This integrated approach to process control loop management can improve phase separation efficiency by up to 5%, ensuring maximum hydrocarbon recovery.
These systems are evolving into critical data hubs, enabling advanced process control and enterprise resource planning integration for broader operational intelligence.
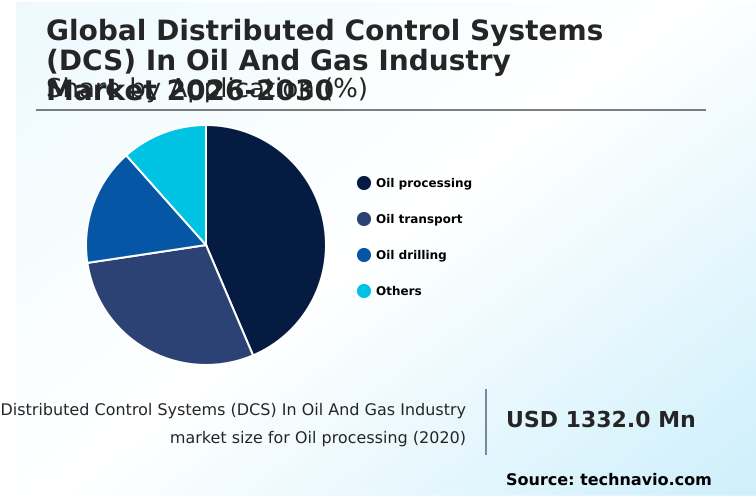
The Oil processing segment was valued at USD 1.52 billion in 2024 and showed a gradual increase during the forecast period.
Regional Analysis
North America is estimated to contribute 33.2% to the growth of the global market during the forecast period.Technavio’s analysts have elaborately explained the regional trends and drivers that shape the market during the forecast period.

See How Distributed Control Systems (DCS) In Oil And Gas Industry Market Demand is Rising in North America Get Free Sample
The geographic landscape of the market reveals a tale of two distinct strategic priorities.
In mature regions like North America and Europe, the focus is on brownfield migration projects and managing system obsolescence risk, where operators replace legacy platforms to enhance process safety management and integrate cybersecurity protocols. These regions emphasize lifecycle support services.
In contrast, high-growth markets in APAC and the Middle East are characterized by large-scale greenfield investments, driven by surging energy demand.
These projects contribute significantly to market expansion, with North America and APAC accounting for approximately 33% and 23% of the incremental growth, respectively.
Digitalization initiatives in these new builds often target ambitious efficiency gains; for instance, integrated operations centers in the Middle East aim to improve production throughput by over 8% through real-time data analytics and remote operations monitoring.
Market Dynamics
Our researchers analyzed the data with 2025 as the base year, along with the key drivers, trends, and challenges. A holistic analysis of drivers will help companies refine their marketing strategies to gain a competitive advantage.
- Strategic decisions within the global distributed control systems (DCS) in oil and gas industry market hinge on a complex evaluation of technology, cost, and long-term performance. The initial debate often centers on dcs vs plc for refinery control, where the integrated nature of a DCS is typically favored for complex, continuous processes.
- For existing facilities, brownfield dcs migration strategies are critical to mitigating risks associated with aging infrastructure. The architectural approach is also evolving, with virtualization benefits in dcs architecture offering reduced hardware footprint and simplified maintenance, a significant factor in reducing operational costs with dcs.
- A key challenge remains the iot integration with legacy dcs, requiring careful planning to bridge technology gaps without compromising security. Advanced applications are a major value driver, with advanced process control in oil refining delivering tangible improvements in yield and energy efficiency. The tight coupling of safety instrumented system integration dcs is non-negotiable for ensuring process safety.
- Furthermore, the push toward digitalization is making digital twin implementation using dcs a key enabler for operator training and process simulation; these initiatives have shown a twofold increase in training effectiveness over traditional methods. The move toward open architectures is highlighted by discussions around opas standard adoption impact, promising greater interoperability.
- This is crucial for applications like optimizing drilling operations with dcs and managing a dcs for floating production storage offloading (FPSO) units. Ultimately, success depends on a holistic view, from managing dcs for subsea production systems to addressing cybersecurity for industrial control systems and understanding the impact of universal i/o on project costs.
What are the key market drivers leading to the rise in the adoption of Distributed Control Systems (DCS) In Oil And Gas Industry Industry?
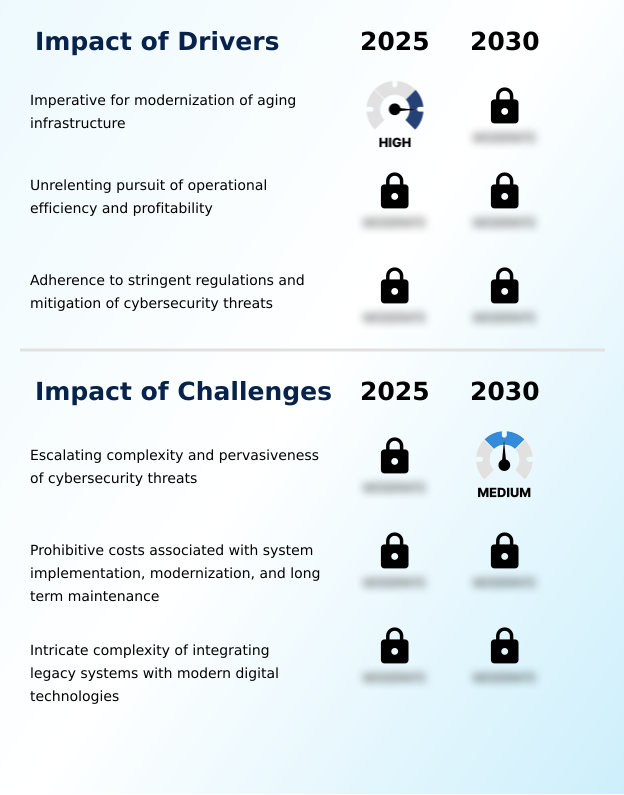
- The imperative to modernize aging industrial automation infrastructure is a key driver for the market.
- The market is propelled by the unrelenting pursuit of operational excellence, with operators leveraging modern systems to maximize profitability.
- The implementation of advanced process control (APC) within a distributed control system can increase the yield of high-value products by 3–5%, directly impacting the bottom line.
- A second major driver is the need for modernization due to system obsolescence risk in aging facilities, compelling investment in brownfield migration projects.
- This is closely tied to the third driver: adherence to stringent regulations and the mitigation of cybersecurity threats.
- Modern platforms with an integrated safety instrumented system and robust cybersecurity protocols can reduce compliance reporting efforts by up to 20%, ensuring adherence to process safety management standards while protecting critical assets from cyber-attacks and ensuring operational uptime maximization.
What are the market trends shaping the Distributed Control Systems (DCS) In Oil And Gas Industry Industry?
- The market is increasingly shaped by the deepening convergence of operational technology (OT) and information technology (IT). This integration is redefining control systems as foundational data hubs for enterprise-wide digital transformation.
- A transformative trend is the strategic adoption of virtualization technology, which decouples DCS software from proprietary hardware, allowing firms to reduce physical server footprints by over 50% and enhance disaster recovery capabilities. This shift toward more open, cyber-physical systems is reshaping total cost of ownership models.
- The deepening convergence of operational technology (OT) with IT is another key development, positioning the process automation platform as a central data hub. This integration facilitates real-time data analytics and supports lean project execution methodologies. Innovations such as electronic marshalling and universal I/O modules are critical to this, accelerating project commissioning timelines by up to 20%.
- These advancements are redefining system architectures, enabling greater operational agility and simplifying the integration of edge computing capabilities.
What challenges does the Distributed Control Systems (DCS) In Oil And Gas Industry Industry face during its growth?
- The escalating complexity and pervasiveness of cybersecurity threats present a key challenge affecting industry growth.
- The market faces a significant challenge from the high total cost of ownership, where the initial capital expenditure for implementation or modernization can be prohibitive. A full rip-and-replace of a legacy distributed control system, for example, is often two to three times more expensive than executing carefully planned brownfield migration projects.
- Another major restraint is the intricate complexity of integrating modern digital technologies with legacy infrastructure. A persistent shortage of professionals with hybrid skills in both operational technology and IT extends project timelines by an average of 25%, slowing the adoption of innovations like predictive maintenance.
- Furthermore, the escalating sophistication of threats against industrial control systems makes robust cybersecurity protocols a costly but non-negotiable necessity, adding another layer of expense and complexity for operators.
Exclusive Technavio Analysis on Customer Landscape
The distributed control systems (dcs) in oil and gas industry market forecasting report includes the adoption lifecycle of the market, covering from the innovator’s stage to the laggard’s stage. It focuses on adoption rates in different regions based on penetration. Furthermore, the distributed control systems (dcs) in oil and gas industry market report also includes key purchase criteria and drivers of price sensitivity to help companies evaluate and develop their market growth analysis strategies.

Customer Landscape of Distributed Control Systems (DCS) In Oil And Gas Industry Industry
Competitive Landscape
Companies are implementing various strategies, such as strategic alliances, distributed control systems (dcs) in oil and gas industry market forecast, partnerships, mergers and acquisitions, geographical expansion, and product/service launches, to enhance their presence in the industry.
ABB Ltd. - The competitive environment features established industrial automation leaders and niche specialists, with market differentiation centered on integrated, software-driven control and safety system platforms.
The industry research and growth report includes detailed analyses of the competitive landscape of the market and information about key companies, including:
- ABB Ltd.
- Azbil Corp.
- Beckhoff Automation GmbH
- CHINT Group
- Emerson Electric Co.
- General Electric Co.
- HIMA Paul Hildebrandt GmbH
- Hitachi Ltd.
- Hollysys Automation Ltd.
- Honeywell International Inc.
- Hyosung Corp.
- Ingeteam Corp. SA
- Mitsubishi Electric Corp.
- NovaTech LLC
- Rockwell Automation Inc.
- Schneider Electric SE
- Siemens AG
- Toshiba Corp.
- Valmet Oyj
- Yokogawa Electric Corp.
Qualitative and quantitative analysis of companies has been conducted to help clients understand the wider business environment as well as the strengths and weaknesses of key industry players. Data is qualitatively analyzed to categorize companies as pure play, category-focused, industry-focused, and diversified; it is quantitatively analyzed to categorize companies as dominant, leading, strong, tentative, and weak.
Recent Development and News in Distributed control systems (dcs) in oil and gas industry market
- In March 2025, Petronas selected Yokogawa as the main automation contractor for its Kasawari II Carbon Capture and Sequestration (CCS) project, deploying the CENTUM VP integrated production control system to manage the entire carbon capture, transportation, and injection process.
- In February 2025, Equinor designated ABB as the main automation contractor for the Wisting oil field development in the Barents Sea, utilizing the ABB Ability System 800xA to create a digital-first facility with a comprehensive digital twin aimed at maximizing remote operational control.
- In October 2024, Honeywell International Inc. announced a strategic collaboration with Chevron to co-develop artificial intelligence-powered solutions designed to be infused directly into the Experion DCS, creating advanced alarm management and decision support tools for refining processes.
- In October 2024, ADNOC awarded a major process automation contract to Emerson for its Hail and Ghasha sour gas development, implementing the DeltaV DCS and Plantweb digital ecosystem to manage one of the world's most complex and environmentally sensitive energy projects.
Dive into Technavio’s robust research methodology, blending expert interviews, extensive data synthesis, and validated models for unparalleled Distributed Control Systems (DCS) In Oil And Gas Industry Market insights. See full methodology.
| Market Scope | |
|---|---|
| Page number | 335 |
| Base year | 2025 |
| Historic period | 2020-2024 |
| Forecast period | 2026-2030 |
| Growth momentum & CAGR | Accelerate at a CAGR of 4.1% |
| Market growth 2026-2030 | USD 821.7 million |
| Market structure | Fragmented |
| YoY growth 2025-2026(%) | 4.0% |
| Key countries | US, Canada, Mexico, Saudi Arabia, UAE, South Africa, Qatar, Kuwait, Germany, UK, France, Italy, Spain, The Netherlands, China, India, Japan, South Korea, Indonesia, Australia, Brazil, Argentina and Colombia |
| Competitive landscape | Leading Companies, Market Positioning of Companies, Competitive Strategies, and Industry Risks |
Research Analyst Overview
- The global distributed control systems (DCS) in oil and gas industry market has matured beyond a tool for basic process automation into a cornerstone of digital transformation strategy. The core function of distributed controllers and input/output modules is now augmented by sophisticated software enabling predictive maintenance and comprehensive asset performance management.
- A critical trend is the convergence of operational technology and information technology, which, while unlocking significant efficiency gains, exposes operations to new threats. This has elevated the importance of robust cybersecurity protocols from a technical requirement to a boardroom-level risk management imperative.
- Board decisions on capital expenditure are now heavily influenced by a system's ability to support a secure, integrated control and safety system (ICSS) architecture. Modern human-machine interface designs, for example, have been demonstrated to reduce operator error during critical process upsets by over 25%.
- This focus on safety and efficiency is also evident in the adoption of technologies like the industrial internet of things (IIoT), digital twin technology, and advanced process control, which are integrated into platforms to optimize everything from subsea production systems to floating production units and supervisory control and data acquisition (SCADA) networks.
What are the Key Data Covered in this Distributed Control Systems (DCS) In Oil And Gas Industry Market Research and Growth Report?
-
What is the expected growth of the Distributed Control Systems (DCS) In Oil And Gas Industry Market between 2026 and 2030?
-
USD 821.7 million, at a CAGR of 4.1%
-
-
What segmentation does the market report cover?
-
The report is segmented by Application (Oil processing, Oil transport, Oil drilling, and Others), Component (Software, Hardware, and Services), End-user (Onshore, and Offshore) and Geography (North America, Middle East and Africa, Europe, APAC, South America)
-
-
Which regions are analyzed in the report?
-
North America, Middle East and Africa, Europe, APAC and South America
-
-
What are the key growth drivers and market challenges?
-
Imperative for modernization of aging infrastructure, Escalating complexity and pervasiveness of cybersecurity threats
-
-
Who are the major players in the Distributed Control Systems (DCS) In Oil And Gas Industry Market?
-
ABB Ltd., Azbil Corp., Beckhoff Automation GmbH, CHINT Group, Emerson Electric Co., General Electric Co., HIMA Paul Hildebrandt GmbH, Hitachi Ltd., Hollysys Automation Ltd., Honeywell International Inc., Hyosung Corp., Ingeteam Corp. SA, Mitsubishi Electric Corp., NovaTech LLC, Rockwell Automation Inc., Schneider Electric SE, Siemens AG, Toshiba Corp., Valmet Oyj and Yokogawa Electric Corp.
-
Market Research Insights
- Market dynamics are shaped by the relentless pursuit of operational excellence and the strategic management of total cost of ownership. The industry is witnessing a clear pivot toward brownfield migration projects, which can lower lifecycle support services costs by over 20% compared to maintaining obsolete systems.
- This focus on modernization enhances asset performance management and integrates process automation platforms more deeply with enterprise-level analytics. Modern DCS solutions now facilitate remote operations monitoring, a shift that has improved expert response times to critical events by more than 35% in remote offshore facilities.
- This capability is crucial for maximizing operational uptime and reducing capital expenditure on new site deployments. The ability to achieve such efficiencies underscores the system's evolution from a control tool to a strategic platform for sustained profitability and regulatory compliance reporting.
We can help! Our analysts can customize this distributed control systems (dcs) in oil and gas industry market research report to meet your requirements.
 RIA -
RIA - 
