Distributed Energy Resource Management Market Analysis, Size, and Forecast 2026-2030: North America (US, Canada, and Mexico), Europe (Germany, UK, and France), APAC (China, India, and Japan), Middle East and Africa (Saudi Arabia, UAE, and South Africa), South America (Brazil, Argentina, and Colombia), and Rest of World (ROW)

Distributed Energy Resource Management Market Analysis, Size, and Forecast 2026-2030:
North America (US, Canada, and Mexico), Europe (Germany, UK, and France), APAC (China, India, and Japan), Middle East and Africa (Saudi Arabia, UAE, and South Africa), South America (Brazil, Argentina, and Colombia), and Rest of World (ROW)

Published: May 2026 313 Pages SKU: IRTNTR81478

Market Overview at a Glance

$1.10 B
Market Opportunity
17.8%
CAGR 2025 - 2030
39.8%
North America Growth
$389 Mn
Services segment 2024

Distributed Energy Resource Management Market Size 2026-2030

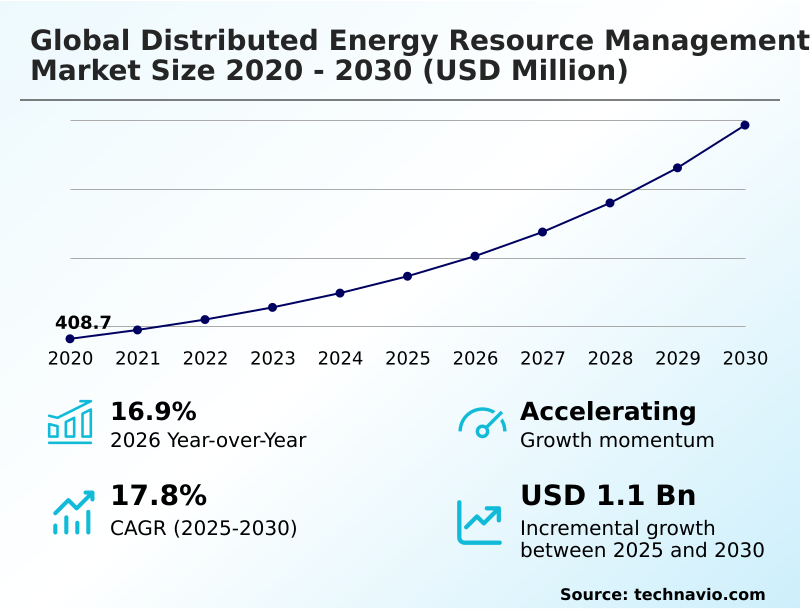
The distributed energy resource management market size is valued to increase by USD 1.10 billion, at a CAGR of 17.8% from 2025 to 2030. Escalating demand for grid resilience against extreme weather will drive the distributed energy resource management market.

Major Market Trends & Insights

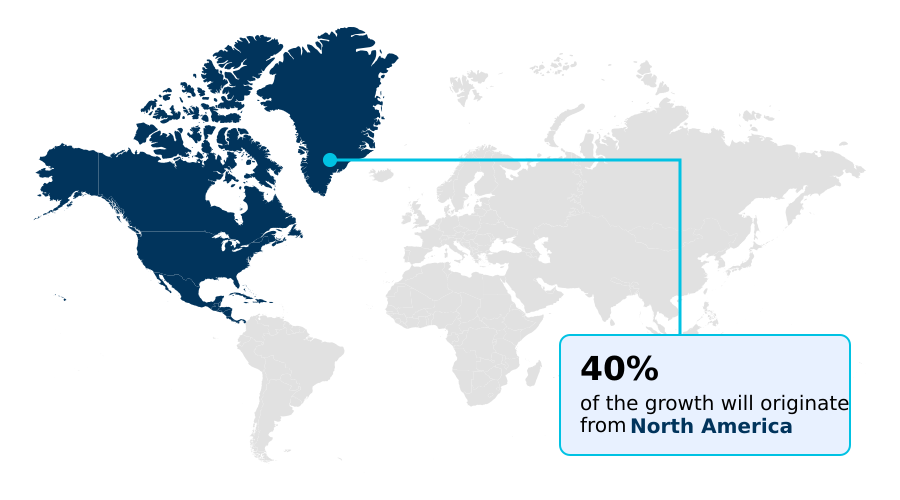
  • North America dominated the market and accounted for a 39.8% growth during the forecast period.
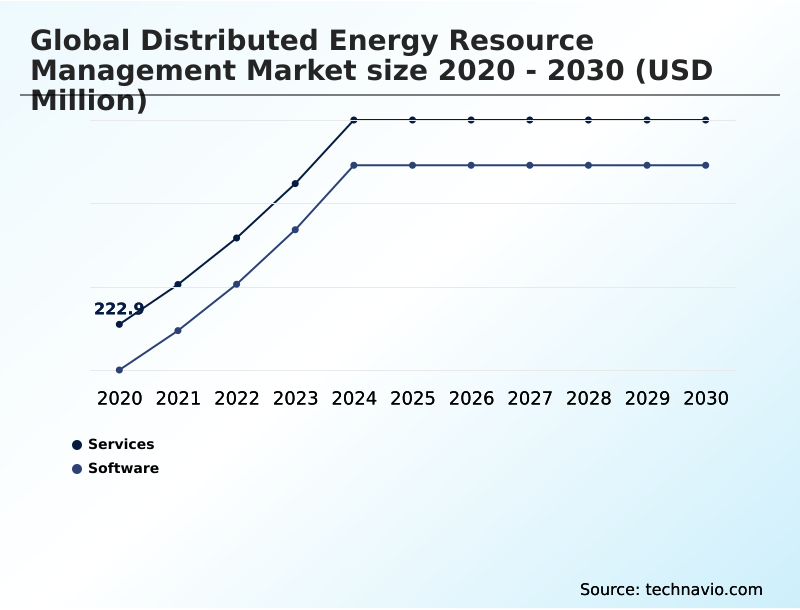
  • By Component - Services segment was valued at USD 389 million in 2024
  • By Application - Solar PV segment accounted for the largest market revenue share in 2024

Market Size & Forecast

  • Market Opportunities: USD 1.55 billion
  • Market Future Opportunities: USD 1.10 billion
  • CAGR from 2025 to 2030 : 17.8%

Market Summary

  • The distributed energy resource management market is undergoing a significant transformation, moving away from centralized control toward decentralized power architectures. This shift is driven by the declining costs of behind-the-meter assets like solar and battery storage, coupled with a critical need for enhanced grid resilience against disruptions.
  • Key trends include the integration of artificial intelligence for predictive grid analytics and the proliferation of multi-resource virtual power plants that provide essential grid flexibility services. As a practical business scenario, a commercial real estate firm can leverage a DERMS platform to aggregate rooftop solar, battery systems, and vehicle-to-grid integration capabilities across its portfolio.
  • This not only optimizes energy consumption through effective peak shaving strategies but also allows the firm to participate in ancillary service markets, creating a new revenue stream. However, realizing this potential is constrained by challenges in ensuring interoperability between diverse hardware and mitigating cybersecurity risks across thousands of connected devices, which complicates real-time grid orchestration and demand response optimization.

What will be the Size of the Distributed Energy Resource Management Market during the forecast period?

Get Key Insights on Market Forecast (PDF) Get Free Sample

How is the Distributed Energy Resource Management Market Segmented?

The distributed energy resource management industry research report provides comprehensive data (region-wise segment analysis), with forecasts and estimates in "USD million" for the period 2026-2030, as well as historical data from 2020-2024 for the following segments.

  • Component
    • Services
    • Software
  • Application
    • Solar PV
    • Energy storage
    • Grid optimization and stability
    • EV charging stations
    • Others
  • End-user
    • Industrial and utilities
    • Commercial
    • Residential
  • Geography
    • North America
      • US
      • Canada
      • Mexico
    • Europe
      • Germany
      • UK
      • France
    • APAC
      • China
      • India
      • Japan
    • Middle East and Africa
      • Saudi Arabia
      • UAE
      • South Africa
    • South America
      • Brazil
      • Argentina
      • Colombia
    • Rest of World (ROW)

By Component Insights

The services segment is estimated to witness significant growth during the forecast period.

Professional services are vital for deploying a modern distributed energy resource management system, ensuring that complex decentralized energy assets are integrated seamlessly into utility operational technology.

These offerings, spanning consulting, system integration, and DER lifecycle management, are fundamental to grid modernization initiatives. Effective system integration enables advanced grid orchestration and DER aggregation, which are essential for managing energy community management programs and community solar projects.

By addressing the technical challenges of interfacing new software with legacy infrastructure, these services ensure that utilities can achieve reliable reactive power support and curtailment mitigation, with some deployments reducing energy waste from curtailment by up to 15%.

This expertise bridges the gap between technological potential and operational reality in transactive energy platforms.

Get Free Sample

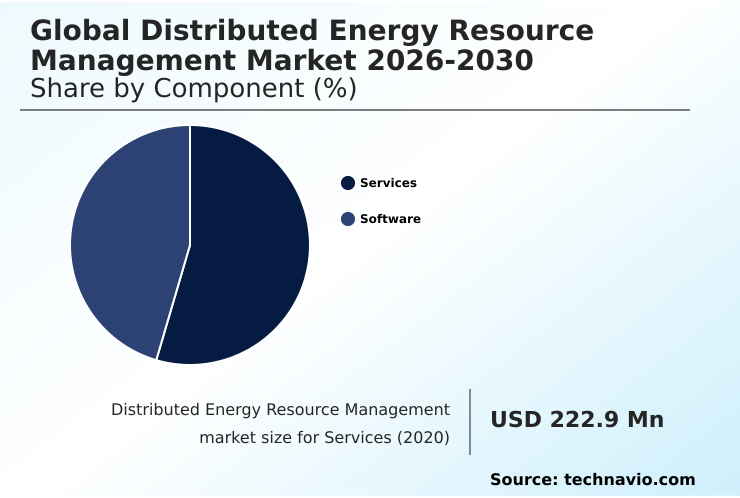
The Services segment was valued at USD 389 million in 2024 and showed a gradual increase during the forecast period.

Get Free Sample

Regional Analysis

North America is estimated to contribute 39.8% to the growth of the global market during the forecast period.Technavio’s analysts have elaborately explained the regional trends and drivers that shape the market during the forecast period.

See How Distributed Energy Resource Management Market Demand is Rising in North America Get Free Sample

The geographic landscape is defined by distinct regional priorities. In North America, the focus is on resilience, where demand response optimization is a key tool for managing grid stress.

Europe leads in regulatory evolution, with advanced distribution system operator models becoming standard. Meanwhile, APAC is characterized by rapid solar adoption, where sophisticated distributed generation forecasting has improved accuracy by over 18%.

Globally, digital twin for grid simulation is used to model grid behavior and has enhanced industrial energy efficiency by over 10% in certain applications.

A common thread is the deployment of an intelligent control layer to manage dynamic export limits and ensure consistent DER performance monitoring.

This technology provides vital ancillary grid services and supports the integration of green building energy systems, driving efficiency across regions.

Market Dynamics

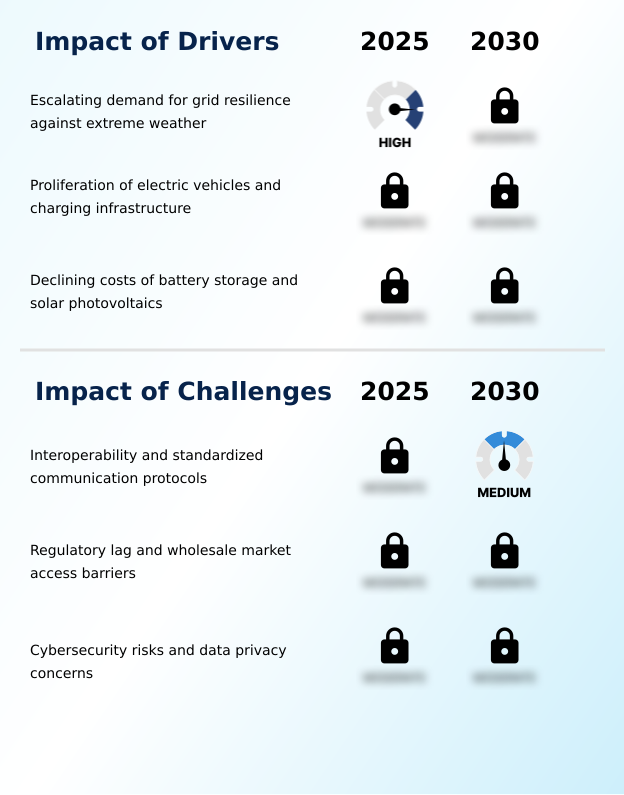
Our researchers analyzed the data with 2025 as the base year, along with the key drivers, trends, and challenges. A holistic analysis of drivers will help companies refine their marketing strategies to gain a competitive advantage.

  • The evolution of the grid necessitates advanced solutions for managing operational complexity. A primary challenge is managing EV charging load on distribution grid, a task increasingly handled by a DERMS platform for microgrid orchestration, which uses software for automated demand response signals to prevent overloads.
  • Concurrently, optimizing battery storage for frequency regulation is achieved by aggregating residential assets into VPPs, enabling homeowners to participate in monetizing prosumer energy in wholesale markets. Core to this transformation is integrating rooftop solar with smart inverters to manage grid stability with high renewable penetration and balance bidirectional power flows in real-time.
  • Technology for transactive energy platforms, including software for peer-to-peer energy trading, is foundational to developing vehicle-to-grid business models. The adoption of AI is critical, with platforms using AI for predictive load forecasting to anticipate system needs.
  • Platforms that utilize edge computing for low-latency grid control respond to grid events nearly twice as fast as cloud-only architectures, a vital factor in outage prevention. This capability is crucial for DERMS integration with legacy SCADA systems and for coordinating DERs for ancillary grid services.
  • The ability to ensure cybersecurity for decentralized endpoints and support DERMS for industrial demand response programs underpins the entire ecosystem.

What are the key market drivers leading to the rise in the adoption of Distributed Energy Resource Management Industry?

  • The escalating demand for grid resilience against extreme weather events, which expose the vulnerabilities of centralized power grids, is a fundamental driver for market adoption.

  • The market is propelled by the rapid adoption of electric vehicle fleet management and the accompanying smart charging infrastructure. This synergy forms an integrated energy-transport nexus, where vehicle-to-grid integration provides a substantial source of flexible capacity.
  • Managed charging, using sophisticated load balancing algorithms, can reduce stress on local distribution infrastructure by up to 30%.
  • Concurrently, the falling cost of behind-the-meter assets fuels the expansion of decentralized power architectures, with some residential systems achieving a return on investment within seven years.
  • This trend empowers prosumers to engage in wholesale energy market participation and peer-to-peer energy trading. The ability to orchestrate these assets significantly contributes to overall grid resilience improvement and grid stability.

What are the market trends shaping the Distributed Energy Resource Management Industry?

  • The integration of artificial intelligence for predictive grid analytics is a dominant trend. It enables proactive adjustments to maintain stability amidst high levels of variable renewable generation.

  • A dominant market trend is the rise of multi-resource virtual power plants, which deliver critical grid flexibility services. These virtual power plant solutions leverage AI-driven predictive grid analytics to improve renewable energy integration and energy storage optimization, with some platforms enhancing forecasting accuracy by over 20%.
  • The shift toward localized orchestration and advanced distribution management enables autonomous grid orchestration at the network edge, providing low-latency grid control. This approach supports the development of non-wires alternatives, which can defer costly infrastructure upgrades. As a result, utilities are achieving response times 50% faster than with traditional generation assets.
  • This evolution enhances real-time grid visibility and facilitates more effective smart inverter control, making the grid more adaptable and resilient.

What challenges does the Distributed Energy Resource Management Industry face during its growth?

  • A primary market challenge is the lack of universal interoperability and standardized communication protocols, which hinders the seamless integration of diverse hardware ecosystems.

  • Key market challenges stem from technical and institutional barriers. The absence of universal interoperability standards for DERs significantly complicates network congestion management, with custom integration costs often representing 25% of a project's software budget.
  • Furthermore, ensuring robust cybersecurity for smart grids is a monumental task, as securing thousands of individual grid-edge devices against threats is paramount for maintaining grid frequency regulation and voltage stability control. The slow pace of utility business model transformation also creates hurdles for adopting new prosumer energy models and achieving full energy data transparency.
  • This inertia hinders the effective use of automated dispatch algorithms and the deployment of systems with black-start capabilities, delaying the transition to a fully optimized grid.

Exclusive Technavio Analysis on Customer Landscape

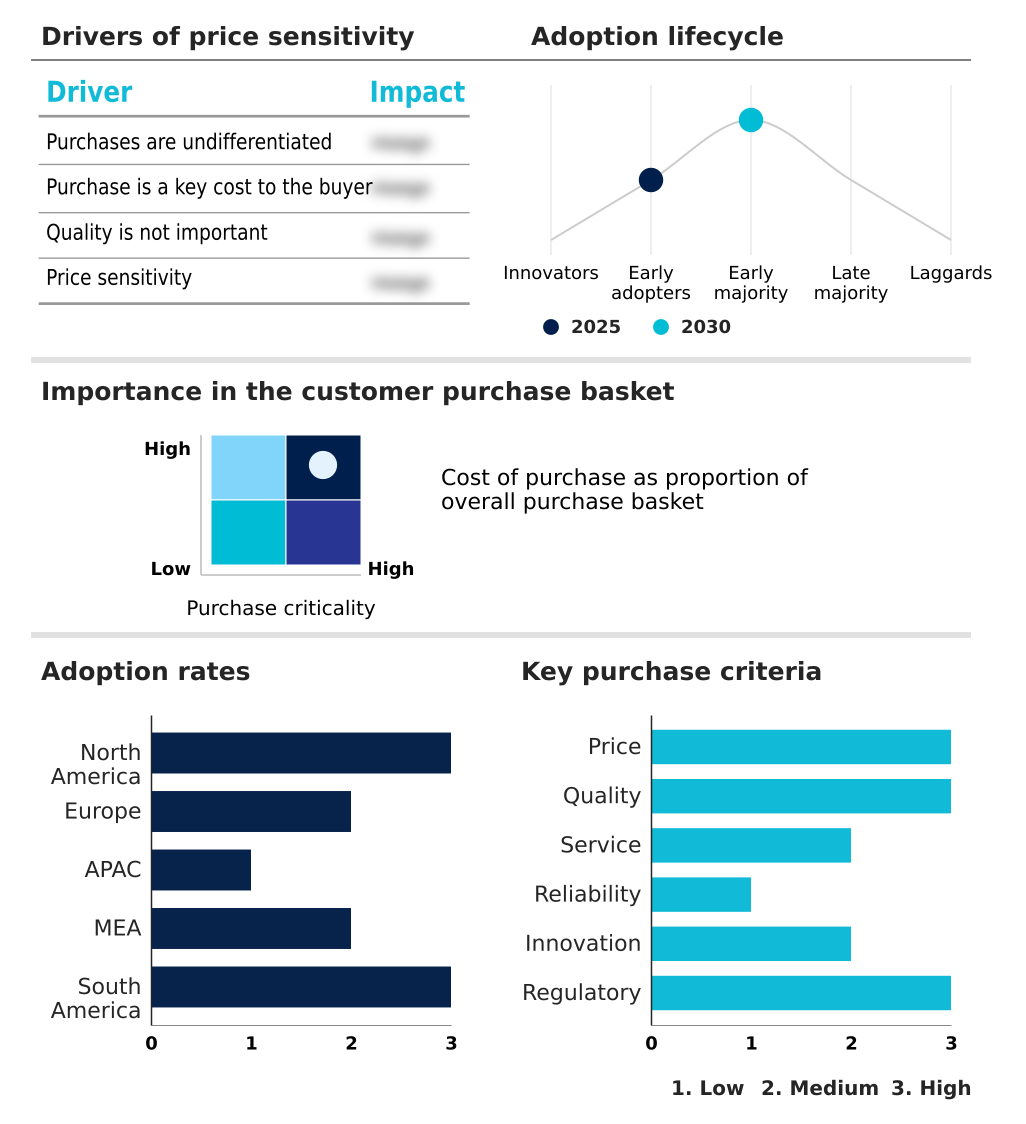
The distributed energy resource management market forecasting report includes the adoption lifecycle of the market, covering from the innovator’s stage to the laggard’s stage. It focuses on adoption rates in different regions based on penetration. Furthermore, the distributed energy resource management market report also includes key purchase criteria and drivers of price sensitivity to help companies evaluate and develop their market growth analysis strategies.

Customer Landscape of Distributed Energy Resource Management Industry

Competitive Landscape

Companies are implementing various strategies, such as strategic alliances, distributed energy resource management market forecast, partnerships, mergers and acquisitions, geographical expansion, and product/service launches, to enhance their presence in the industry.

ABB Ltd. - Core offerings focus on intelligent software platforms for orchestrating decentralized energy assets, enabling grid stability, and optimizing bidirectional power flows for enhanced system reliability.

The industry research and growth report includes detailed analyses of the competitive landscape of the market and information about key companies, including:

  • ABB Ltd.
  • Aspen Technology Inc.
  • AutoGrid Systems Inc.
  • Camus Energy
  • Doosan GridTech Inc.
  • Eaton Corp. Plc
  • Enel X Italia S.r.l.
  • EnergyHub Inc.
  • GE Vernova Inc.
  • Generac Power Systems Inc.
  • Hitachi Energy Ltd.
  • Honeywell International Inc.
  • Itron Inc.
  • Landis Gyr AG
  • Open Access Technology Inc.
  • Oracle Corp.
  • Schneider Electric SE
  • Siemens AG
  • Spirae LLC
  • Virtual Peaker

Qualitative and quantitative analysis of companies has been conducted to help clients understand the wider business environment as well as the strengths and weaknesses of key industry players. Data is qualitatively analyzed to categorize companies as pure play, category-focused, industry-focused, and diversified; it is quantitatively analyzed to categorize companies as dominant, leading, strong, tentative, and weak.

Recent Development and News in Distributed energy resource management market

  • In April, 2025, ChargePoint announced the launch of new AC Level 2 charging technology with bidirectional charging and vehicle-to-everything capabilities for North American and European markets.
  • In March, 2025, a major utility software firm announced a strategic partnership with a leading energy retailer to launch a new virtual power plant program in Texas, aggregating residential battery systems to provide grid services.
  • In January, 2025, a global industrial technology company officially released its next-generation grid operating software, a unified platform designed to manage distribution networks and integrate DERs with advanced analytics and AI-driven automation.
  • In November, 2024, the US Federal Energy Regulatory Commission issued a notice of proposed rulemaking to expand Order 2222, aiming to lower participation barriers for smaller aggregated distributed resources in wholesale capacity markets.

Dive into Technavio’s robust research methodology, blending expert interviews, extensive data synthesis, and validated models for unparalleled Distributed Energy Resource Management Market insights. See full methodology.

Market Scope
Page number 313
Base year 2025
Historic period 2020-2024
Forecast period 2026-2030
Growth momentum & CAGR Accelerate at a CAGR of 17.8%
Market growth 2026-2030 USD 1099.0 million
Market structure Fragmented
YoY growth 2025-2026(%) 16.9%
Key countries US, Canada, Mexico, Germany, UK, France, Italy, Spain, The Netherlands, China, India, Japan, Australia, South Korea, Indonesia, Saudi Arabia, UAE, South Africa, Israel, Turkey, Brazil, Argentina and Colombia
Competitive landscape Leading Companies, Market Positioning of Companies, Competitive Strategies, and Industry Risks

Request Free Sample

Research Analyst Overview

  • The market is rapidly evolving toward decentralized power architectures, a shift compelling boardroom-level decisions on strategic investments in grid orchestration platforms. These systems are central to DER aggregation and the formation of multi-resource virtual power plants, which provide essential grid flexibility services and ancillary grid services.
  • Key technologies enabling this transition include predictive grid analytics, often using a digital twin for grid simulation, to inform peak shaving strategies and demand response optimization. The underlying architecture combines edge computing for grid control with localized orchestration and automated dispatch algorithms operating on a federated grid data fabric.
  • This facilitates real-time grid visibility and bidirectional power flow management, which are crucial for grid frequency regulation and voltage stability control. Such platforms have demonstrated the ability to reduce grid balancing costs by up to 20%. The integration of behind-the-meter assets into prosumer energy models, supported by smart inverter control, load balancing algorithms, and curtailment mitigation, is a defining trend.
  • This ecosystem supports everything from black-start capabilities to peer-to-peer energy trading within energy community management frameworks, all managed through transactive energy platforms and integrated with supervisory control and data acquisition systems.

What are the Key Data Covered in this Distributed Energy Resource Management Market Research and Growth Report?

  • What is the expected growth of the Distributed Energy Resource Management Market between 2026 and 2030?

    • USD 1.10 billion, at a CAGR of 17.8%

  • What segmentation does the market report cover?

    • The report is segmented by Component (Services, and Software), Application (Solar PV, Energy storage, Grid optimization and stability, EV charging stations, and Others), End-user (Industrial and utilities, Commercial, and Residential) and Geography (North America, Europe, APAC, Middle East and Africa, South America)

  • Which regions are analyzed in the report?

    • North America, Europe, APAC, Middle East and Africa and South America

  • What are the key growth drivers and market challenges?

    • Escalating demand for grid resilience against extreme weather, Interoperability and standardized communication protocols

  • Who are the major players in the Distributed Energy Resource Management Market?

    • ABB Ltd., Aspen Technology Inc., AutoGrid Systems Inc., Camus Energy, Doosan GridTech Inc., Eaton Corp. Plc, Enel X Italia S.r.l., EnergyHub Inc., GE Vernova Inc., Generac Power Systems Inc., Hitachi Energy Ltd., Honeywell International Inc., Itron Inc., Landis Gyr AG, Open Access Technology Inc., Oracle Corp., Schneider Electric SE, Siemens AG, Spirae LLC and Virtual Peaker

Market Research Insights

  • The market is defined by the need for an intelligent control layer to manage the transition to a decentralized grid. Grid modernization initiatives rely on distributed energy resource management system platforms for renewable energy integration and energy storage optimization. This extends to electric vehicle fleet management through smart charging infrastructure, forming an integrated energy-transport nexus that supports grid resilience improvement.
  • DER performance monitoring has improved asset uptime by 10%, while dynamic load shifting can reduce peak demand costs by 15%. Key enablers include interoperability standards for DERs, which facilitate low-latency grid control and network congestion management. Advanced capabilities like distributed generation forecasting and autonomous microgrid operation are becoming standard.
  • This ecosystem depends on energy data transparency for wholesale energy market participation and requires robust cybersecurity for smart grids to protect utility operational technology and support new utility business model transformation.

We can help! Our analysts can customize this distributed energy resource management market research report to meet your requirements.

Get in touch

1. Executive Summary

1.1 Market overview

Executive Summary - Chart on Market Overview
Executive Summary - Data Table on Market Overview
Executive Summary - Chart on Global Market Characteristics
Executive Summary - Chart on Market by Geography
Executive Summary - Chart on Market Segmentation by Component
Executive Summary - Chart on Market Segmentation by Application
Executive Summary - Chart on Market Segmentation by End-user
Executive Summary - Chart on Incremental Growth
Executive Summary - Data Table on Incremental Growth
Executive Summary - Chart on Company Market Positioning

2. Technavio Analysis

2.1 Analysis of price sensitivity, lifecycle, customer purchase basket, adoption rates, and purchase criteria

2.2 Criticality of inputs and Factors of differentiation

Chart on Overview on criticality of inputs and factors of differentiation

2.3 Factors of disruption

Chart on Overview on factors of disruption

2.4 Impact of drivers and challenges

Chart on Impact of drivers and challenges in 2025 and 2030

3. Market Landscape

3.1 Market ecosystem

Chart on Parent Market
Data Table on - Parent Market

3.2 Market characteristics

Chart on Market characteristics analysis

3.3 Value chain analysis

Chart on Value chain analysis

4. Market Sizing

4.1 Market definition

Data Table on Offerings of companies included in the market definition

4.2 Market segment analysis

Market segments

4.3 Market size 2025

4.4 Market outlook: Forecast for 2025-2030

Chart on Global - Market size and forecast 2025-2030 ($ million)
Data Table on Global - Market size and forecast 2025-2030 ($ million)
Chart on Global Market: Year-over-year growth 2025-2030 (%)
Data Table on Global Market: Year-over-year growth 2025-2030 (%)

5. Historic Market Size

5.1 Global Distributed Energy Resource Management Market 2020 - 2024

Historic Market Size - Data Table on Global Distributed Energy Resource Management Market 2020 - 2024 ($ million)

5.2 Component segment analysis 2020 - 2024

Historic Market Size - Component Segment 2020 - 2024 ($ million)

5.3 Application segment analysis 2020 - 2024

Historic Market Size - Application Segment 2020 - 2024 ($ million)

5.4 End-user segment analysis 2020 - 2024

Historic Market Size - End-user Segment 2020 - 2024 ($ million)

5.5 Geography segment analysis 2020 - 2024

Historic Market Size - Geography Segment 2020 - 2024 ($ million)

5.6 Country segment analysis 2020 - 2024

Historic Market Size - Country Segment 2020 - 2024 ($ million)

6. Qualitative Analysis

6.1 Impact of AI on global distributed energy resource management market

6.2 Impact of geopolitical conflicts on global distributed energy resource management market

7. Five Forces Analysis

7.1 Five forces summary

Five forces analysis - Comparison between 2025 and 2030

7.2 Bargaining power of buyers

Bargaining power of buyers - Impact of key factors 2025 and 2030

7.3 Bargaining power of suppliers

Bargaining power of suppliers - Impact of key factors in 2025 and 2030

7.4 Threat of new entrants

Threat of new entrants - Impact of key factors in 2025 and 2030

7.5 Threat of substitutes

Threat of substitutes - Impact of key factors in 2025 and 2030

7.6 Threat of rivalry

Threat of rivalry - Impact of key factors in 2025 and 2030

7.7 Market condition

Chart on Market condition - Five forces 2025 and 2030

8. Market Segmentation by Component

8.1 Market segments

Chart on Component - Market share 2025-2030 (%)
Data Table on Component - Market share 2025-2030 (%)

8.2 Comparison by Component

Chart on Comparison by Component
Data Table on Comparison by Component

8.3 Services - Market size and forecast 2025-2030

Chart on Services - Market size and forecast 2025-2030 ($ million)
Data Table on Services - Market size and forecast 2025-2030 ($ million)
Chart on Services - Year-over-year growth 2025-2030 (%)
Data Table on Services - Year-over-year growth 2025-2030 (%)

8.4 Software - Market size and forecast 2025-2030

Chart on Software - Market size and forecast 2025-2030 ($ million)
Data Table on Software - Market size and forecast 2025-2030 ($ million)
Chart on Software - Year-over-year growth 2025-2030 (%)
Data Table on Software - Year-over-year growth 2025-2030 (%)

8.5 Market opportunity by Component

Market opportunity by Component ($ million)
Data Table on Market opportunity by Component ($ million)

9. Market Segmentation by Application

9.1 Market segments

Chart on Application - Market share 2025-2030 (%)
Data Table on Application - Market share 2025-2030 (%)

9.2 Comparison by Application

Chart on Comparison by Application
Data Table on Comparison by Application

9.3 Solar PV - Market size and forecast 2025-2030

Chart on Solar PV - Market size and forecast 2025-2030 ($ million)
Data Table on Solar PV - Market size and forecast 2025-2030 ($ million)
Chart on Solar PV - Year-over-year growth 2025-2030 (%)
Data Table on Solar PV - Year-over-year growth 2025-2030 (%)

9.4 Energy storage - Market size and forecast 2025-2030

Chart on Energy storage - Market size and forecast 2025-2030 ($ million)
Data Table on Energy storage - Market size and forecast 2025-2030 ($ million)
Chart on Energy storage - Year-over-year growth 2025-2030 (%)
Data Table on Energy storage - Year-over-year growth 2025-2030 (%)

9.5 Grid optimization and stability - Market size and forecast 2025-2030

Chart on Grid optimization and stability - Market size and forecast 2025-2030 ($ million)
Data Table on Grid optimization and stability - Market size and forecast 2025-2030 ($ million)
Chart on Grid optimization and stability - Year-over-year growth 2025-2030 (%)
Data Table on Grid optimization and stability - Year-over-year growth 2025-2030 (%)

9.6 EV charging stations - Market size and forecast 2025-2030

Chart on EV charging stations - Market size and forecast 2025-2030 ($ million)
Data Table on EV charging stations - Market size and forecast 2025-2030 ($ million)
Chart on EV charging stations - Year-over-year growth 2025-2030 (%)
Data Table on EV charging stations - Year-over-year growth 2025-2030 (%)

9.7 Others - Market size and forecast 2025-2030

Chart on Others - Market size and forecast 2025-2030 ($ million)
Data Table on Others - Market size and forecast 2025-2030 ($ million)
Chart on Others - Year-over-year growth 2025-2030 (%)
Data Table on Others - Year-over-year growth 2025-2030 (%)

9.8 Market opportunity by Application

Market opportunity by Application ($ million)
Data Table on Market opportunity by Application ($ million)

10. Market Segmentation by End-user

10.1 Market segments

Chart on End-user - Market share 2025-2030 (%)
Data Table on End-user - Market share 2025-2030 (%)

10.2 Comparison by End-user

Chart on Comparison by End-user
Data Table on Comparison by End-user

10.3 Industrial and utilities - Market size and forecast 2025-2030

Chart on Industrial and utilities - Market size and forecast 2025-2030 ($ million)
Data Table on Industrial and utilities - Market size and forecast 2025-2030 ($ million)
Chart on Industrial and utilities - Year-over-year growth 2025-2030 (%)
Data Table on Industrial and utilities - Year-over-year growth 2025-2030 (%)

10.4 Commercial - Market size and forecast 2025-2030

Chart on Commercial - Market size and forecast 2025-2030 ($ million)
Data Table on Commercial - Market size and forecast 2025-2030 ($ million)
Chart on Commercial - Year-over-year growth 2025-2030 (%)
Data Table on Commercial - Year-over-year growth 2025-2030 (%)

10.5 Residential - Market size and forecast 2025-2030

Chart on Residential - Market size and forecast 2025-2030 ($ million)
Data Table on Residential - Market size and forecast 2025-2030 ($ million)
Chart on Residential - Year-over-year growth 2025-2030 (%)
Data Table on Residential - Year-over-year growth 2025-2030 (%)

10.6 Market opportunity by End-user

Market opportunity by End-user ($ million)
Data Table on Market opportunity by End-user ($ million)

11. Customer Landscape

11.1 Customer landscape overview

Analysis of price sensitivity, lifecycle, customer purchase basket, adoption rates, and purchase criteria

12. Geographic Landscape

12.1 Geographic segmentation

Chart on Market share by geography 2025-2030 (%)
Data Table on Market share by geography 2025-2030 (%)

12.2 Geographic comparison

Chart on Geographic comparison
Data Table on Geographic comparison

12.3 North America - Market size and forecast 2025-2030

Chart on North America - Market size and forecast 2025-2030 ($ million)
Data Table on North America - Market size and forecast 2025-2030 ($ million)
Chart on North America - Year-over-year growth 2025-2030 (%)
Data Table on North America - Year-over-year growth 2025-2030 (%)
Chart on Regional Comparison - North America
Data Table on Regional Comparison - North America

12.3.1 US - Market size and forecast 2025-2030

Chart on US - Market size and forecast 2025-2030 ($ million)
Data Table on US - Market size and forecast 2025-2030 ($ million)
Chart on US - Year-over-year growth 2025-2030 (%)
Data Table on US - Year-over-year growth 2025-2030 (%)

12.3.2 Canada - Market size and forecast 2025-2030

Chart on Canada - Market size and forecast 2025-2030 ($ million)
Data Table on Canada - Market size and forecast 2025-2030 ($ million)
Chart on Canada - Year-over-year growth 2025-2030 (%)
Data Table on Canada - Year-over-year growth 2025-2030 (%)

12.3.3 Mexico - Market size and forecast 2025-2030

Chart on Mexico - Market size and forecast 2025-2030 ($ million)
Data Table on Mexico - Market size and forecast 2025-2030 ($ million)
Chart on Mexico - Year-over-year growth 2025-2030 (%)
Data Table on Mexico - Year-over-year growth 2025-2030 (%)

12.4 Europe - Market size and forecast 2025-2030

Chart on Europe - Market size and forecast 2025-2030 ($ million)
Data Table on Europe - Market size and forecast 2025-2030 ($ million)
Chart on Europe - Year-over-year growth 2025-2030 (%)
Data Table on Europe - Year-over-year growth 2025-2030 (%)
Chart on Regional Comparison - Europe
Data Table on Regional Comparison - Europe

12.4.1 Germany - Market size and forecast 2025-2030

Chart on Germany - Market size and forecast 2025-2030 ($ million)
Data Table on Germany - Market size and forecast 2025-2030 ($ million)
Chart on Germany - Year-over-year growth 2025-2030 (%)
Data Table on Germany - Year-over-year growth 2025-2030 (%)

12.4.2 UK - Market size and forecast 2025-2030

Chart on UK - Market size and forecast 2025-2030 ($ million)
Data Table on UK - Market size and forecast 2025-2030 ($ million)
Chart on UK - Year-over-year growth 2025-2030 (%)
Data Table on UK - Year-over-year growth 2025-2030 (%)

12.4.3 France - Market size and forecast 2025-2030

Chart on France - Market size and forecast 2025-2030 ($ million)
Data Table on France - Market size and forecast 2025-2030 ($ million)
Chart on France - Year-over-year growth 2025-2030 (%)
Data Table on France - Year-over-year growth 2025-2030 (%)

12.4.4 Italy - Market size and forecast 2025-2030

Chart on Italy - Market size and forecast 2025-2030 ($ million)
Data Table on Italy - Market size and forecast 2025-2030 ($ million)
Chart on Italy - Year-over-year growth 2025-2030 (%)
Data Table on Italy - Year-over-year growth 2025-2030 (%)

12.4.5 Spain - Market size and forecast 2025-2030

Chart on Spain - Market size and forecast 2025-2030 ($ million)
Data Table on Spain - Market size and forecast 2025-2030 ($ million)
Chart on Spain - Year-over-year growth 2025-2030 (%)
Data Table on Spain - Year-over-year growth 2025-2030 (%)

12.4.6 The Netherlands - Market size and forecast 2025-2030

Chart on The Netherlands - Market size and forecast 2025-2030 ($ million)
Data Table on The Netherlands - Market size and forecast 2025-2030 ($ million)
Chart on The Netherlands - Year-over-year growth 2025-2030 (%)
Data Table on The Netherlands - Year-over-year growth 2025-2030 (%)

12.5 APAC - Market size and forecast 2025-2030

Chart on APAC - Market size and forecast 2025-2030 ($ million)
Data Table on APAC - Market size and forecast 2025-2030 ($ million)
Chart on APAC - Year-over-year growth 2025-2030 (%)
Data Table on APAC - Year-over-year growth 2025-2030 (%)
Chart on Regional Comparison - APAC
Data Table on Regional Comparison - APAC

12.5.1 China - Market size and forecast 2025-2030

Chart on China - Market size and forecast 2025-2030 ($ million)
Data Table on China - Market size and forecast 2025-2030 ($ million)
Chart on China - Year-over-year growth 2025-2030 (%)
Data Table on China - Year-over-year growth 2025-2030 (%)

12.5.2 India - Market size and forecast 2025-2030

Chart on India - Market size and forecast 2025-2030 ($ million)
Data Table on India - Market size and forecast 2025-2030 ($ million)
Chart on India - Year-over-year growth 2025-2030 (%)
Data Table on India - Year-over-year growth 2025-2030 (%)

12.5.3 Japan - Market size and forecast 2025-2030

Chart on Japan - Market size and forecast 2025-2030 ($ million)
Data Table on Japan - Market size and forecast 2025-2030 ($ million)
Chart on Japan - Year-over-year growth 2025-2030 (%)
Data Table on Japan - Year-over-year growth 2025-2030 (%)

12.5.4 Australia - Market size and forecast 2025-2030

Chart on Australia - Market size and forecast 2025-2030 ($ million)
Data Table on Australia - Market size and forecast 2025-2030 ($ million)
Chart on Australia - Year-over-year growth 2025-2030 (%)
Data Table on Australia - Year-over-year growth 2025-2030 (%)

12.5.5 South Korea - Market size and forecast 2025-2030

Chart on South Korea - Market size and forecast 2025-2030 ($ million)
Data Table on South Korea - Market size and forecast 2025-2030 ($ million)
Chart on South Korea - Year-over-year growth 2025-2030 (%)
Data Table on South Korea - Year-over-year growth 2025-2030 (%)

12.5.6 Indonesia - Market size and forecast 2025-2030

Chart on Indonesia - Market size and forecast 2025-2030 ($ million)
Data Table on Indonesia - Market size and forecast 2025-2030 ($ million)
Chart on Indonesia - Year-over-year growth 2025-2030 (%)
Data Table on Indonesia - Year-over-year growth 2025-2030 (%)

12.6 Middle East and Africa - Market size and forecast 2025-2030

Chart on Middle East and Africa - Market size and forecast 2025-2030 ($ million)
Data Table on Middle East and Africa - Market size and forecast 2025-2030 ($ million)
Chart on Middle East and Africa - Year-over-year growth 2025-2030 (%)
Data Table on Middle East and Africa - Year-over-year growth 2025-2030 (%)
Chart on Regional Comparison - Middle East and Africa
Data Table on Regional Comparison - Middle East and Africa

12.6.1 Saudi Arabia - Market size and forecast 2025-2030

Chart on Saudi Arabia - Market size and forecast 2025-2030 ($ million)
Data Table on Saudi Arabia - Market size and forecast 2025-2030 ($ million)
Chart on Saudi Arabia - Year-over-year growth 2025-2030 (%)
Data Table on Saudi Arabia - Year-over-year growth 2025-2030 (%)

12.6.2 UAE - Market size and forecast 2025-2030

Chart on UAE - Market size and forecast 2025-2030 ($ million)
Data Table on UAE - Market size and forecast 2025-2030 ($ million)
Chart on UAE - Year-over-year growth 2025-2030 (%)
Data Table on UAE - Year-over-year growth 2025-2030 (%)

12.6.3 South Africa - Market size and forecast 2025-2030

Chart on South Africa - Market size and forecast 2025-2030 ($ million)
Data Table on South Africa - Market size and forecast 2025-2030 ($ million)
Chart on South Africa - Year-over-year growth 2025-2030 (%)
Data Table on South Africa - Year-over-year growth 2025-2030 (%)

12.6.4 Israel - Market size and forecast 2025-2030

Chart on Israel - Market size and forecast 2025-2030 ($ million)
Data Table on Israel - Market size and forecast 2025-2030 ($ million)
Chart on Israel - Year-over-year growth 2025-2030 (%)
Data Table on Israel - Year-over-year growth 2025-2030 (%)

12.6.5 Turkey - Market size and forecast 2025-2030

Chart on Turkey - Market size and forecast 2025-2030 ($ million)
Data Table on Turkey - Market size and forecast 2025-2030 ($ million)
Chart on Turkey - Year-over-year growth 2025-2030 (%)
Data Table on Turkey - Year-over-year growth 2025-2030 (%)

12.7 South America - Market size and forecast 2025-2030

Chart on South America - Market size and forecast 2025-2030 ($ million)
Data Table on South America - Market size and forecast 2025-2030 ($ million)
Chart on South America - Year-over-year growth 2025-2030 (%)
Data Table on South America - Year-over-year growth 2025-2030 (%)
Chart on Regional Comparison - South America
Data Table on Regional Comparison - South America

12.7.1 Brazil - Market size and forecast 2025-2030

Chart on Brazil - Market size and forecast 2025-2030 ($ million)
Data Table on Brazil - Market size and forecast 2025-2030 ($ million)
Chart on Brazil - Year-over-year growth 2025-2030 (%)
Data Table on Brazil - Year-over-year growth 2025-2030 (%)

12.7.2 Argentina - Market size and forecast 2025-2030

Chart on Argentina - Market size and forecast 2025-2030 ($ million)
Data Table on Argentina - Market size and forecast 2025-2030 ($ million)
Chart on Argentina - Year-over-year growth 2025-2030 (%)
Data Table on Argentina - Year-over-year growth 2025-2030 (%)

12.7.3 Colombia - Market size and forecast 2025-2030

Chart on Colombia - Market size and forecast 2025-2030 ($ million)
Data Table on Colombia - Market size and forecast 2025-2030 ($ million)
Chart on Colombia - Year-over-year growth 2025-2030 (%)
Data Table on Colombia - Year-over-year growth 2025-2030 (%)

12.8 Market opportunity by geography

Market opportunity by geography ($ million)
Data Tables on Market opportunity by geography ($ million)

13. Drivers, Challenges, and Opportunity

13.1 Market drivers

Escalating demand for grid resilience against extreme weather
Proliferation of electric vehicles and charging infrastructure
Declining costs of battery storage and solar photovoltaics

13.2 Market challenges

Interoperability and standardized communication protocols
Regulatory lag and wholesale market access barriers
Cybersecurity risks and data privacy concerns

13.3 Impact of drivers and challenges

Impact of drivers and challenges in 2025 and 2030

13.4 Market opportunities

Integration of AI for predictive grid analytics
Rise of multi-resource virtual power plants
Shift toward edge computing and localized orchestration

14. Competitive Landscape

14.1 Overview

14.2

Overview on criticality of inputs and factors of differentiation

14.3 Landscape disruption

Overview on factors of disruption

14.4 Industry risks

Impact of key risks on business

15. Competitive Analysis

15.1 Companies profiled

Companies covered

15.2 Company ranking index

15.3 Market positioning of companies

Matrix on companies position and classification

15.4 ABB Ltd.

ABB Ltd. - Overview
ABB Ltd. - Business segments
ABB Ltd. - Key news
ABB Ltd. - Key offerings
ABB Ltd. - Segment focus
SWOT

15.5 Aspen Technology Inc.

Aspen Technology Inc. - Overview
Aspen Technology Inc. - Business segments
Aspen Technology Inc. - Key offerings
Aspen Technology Inc. - Segment focus
SWOT

15.6 AutoGrid Systems Inc.

AutoGrid Systems Inc. - Overview
AutoGrid Systems Inc. - Product / Service
AutoGrid Systems Inc. - Key offerings
SWOT

15.7 Camus Energy

Camus Energy - Overview
Camus Energy - Product / Service
Camus Energy - Key offerings
SWOT

15.8 Eaton Corp. Plc

Eaton Corp. Plc - Overview
Eaton Corp. Plc - Business segments
Eaton Corp. Plc - Key news
Eaton Corp. Plc - Key offerings
Eaton Corp. Plc - Segment focus
SWOT

15.9 Enel X Italia S.r.l.

Enel X Italia S.r.l. - Overview
Enel X Italia S.r.l. - Product / Service
Enel X Italia S.r.l. - Key offerings
SWOT

15.10 EnergyHub Inc.

EnergyHub Inc. - Overview
EnergyHub Inc. - Product / Service
EnergyHub Inc. - Key offerings
SWOT

15.11 GE Vernova Inc.

GE Vernova Inc. - Overview
GE Vernova Inc. - Business segments
GE Vernova Inc. - Key offerings
GE Vernova Inc. - Segment focus
SWOT

15.12 Generac Power Systems Inc.

Generac Power Systems Inc. - Overview
Generac Power Systems Inc. - Business segments
Generac Power Systems Inc. - Key news
Generac Power Systems Inc. - Key offerings
Generac Power Systems Inc. - Segment focus
SWOT

15.13 Hitachi Energy Ltd.

Hitachi Energy Ltd. - Overview
Hitachi Energy Ltd. - Product / Service
Hitachi Energy Ltd. - Key offerings
SWOT

15.14 Honeywell International Inc.

Honeywell International Inc. - Overview
Honeywell International Inc. - Business segments
Honeywell International Inc. - Key news
Honeywell International Inc. - Key offerings
Honeywell International Inc. - Segment focus
SWOT

15.15 Landis Gyr AG

Landis Gyr AG - Overview
Landis Gyr AG - Business segments
Landis Gyr AG - Key offerings
Landis Gyr AG - Segment focus
SWOT

15.16 Oracle Corp.

Oracle Corp. - Overview
Oracle Corp. - Business segments
Oracle Corp. - Key news
Oracle Corp. - Key offerings
Oracle Corp. - Segment focus
SWOT

15.17 Schneider Electric SE

Schneider Electric SE - Overview
Schneider Electric SE - Business segments
Schneider Electric SE - Key news
Schneider Electric SE - Key offerings
Schneider Electric SE - Segment focus
SWOT

15.18 Siemens AG

Siemens AG - Overview
Siemens AG - Business segments
Siemens AG - Key news
Siemens AG - Key offerings
Siemens AG - Segment focus
SWOT

16. Appendix

16.1 Scope of the report

Market definition
Objectives
Notes and caveats

16.2 Inclusions and exclusions checklist

Inclusions checklist
Exclusions checklist

16.3 Currency conversion rates for US$

16.4 Research methodology

16.5 Data procurement

Information sources

16.6 Data validation

16.7 Validation techniques employed for market sizing

16.8 Data synthesis

16.9 360 degree market analysis

16.10 List of abbreviations

Research Methodology

Technavio presents a detailed picture of the market by way of study, synthesis, and summation of data from multiple sources. The analysts have presented the various facets of the market with a particular focus on identifying the key industry influencers. The data thus presented is comprehensive, reliable, and the result of extensive research, both primary and secondary.

INFORMATION SOURCES

Primary sources

  • Manufacturers and suppliers
  • Channel partners
  • Industry experts
  • Strategic decision makers

Secondary sources

  • Industry journals and periodicals
  • Government data
  • Financial reports of key industry players
  • Historical data
  • Press releases

DATA ANALYSIS

Data Synthesis

  • Collation of data
  • Estimation of key figures
  • Analysis of derived insights

Data Validation

  • Triangulation with data models
  • Reference against proprietary databases
  • Corroboration with industry experts

REPORT WRITING

Qualitative

  • Market drivers
  • Market challenges
  • Market trends
  • Five forces analysis

Quantitative

  • Market size and forecast
  • Market segmentation
  • Geographical insights
  • Competitive landscape

Interested in this report?

Get your sample now to see our research methodology and insights!

Download Now

Frequently Asked Questions

Distributed Energy Resource Management market growth will increase by USD 1099.0 million during 2026-2030.

The Distributed Energy Resource Management market is expected to grow at a CAGR of 17.8% during 2026-2030.

Distributed Energy Resource Management market is segmented by Component (Services, Software) Application (Solar PV, Energy storage, Grid optimization and stability, EV charging stations, Others) End-user (Industrial and utilities, Commercial, Residential)

ABB Ltd., Aspen Technology Inc., AutoGrid Systems Inc., Camus Energy, Doosan GridTech Inc., Eaton Corp. Plc, Enel X Italia S.r.l., EnergyHub Inc., GE Vernova Inc., Generac Power Systems Inc., Hitachi Energy Ltd., Honeywell International Inc., Itron Inc., Landis Gyr AG, Open Access Technology Inc., Oracle Corp., Schneider Electric SE, Siemens AG, Spirae LLC, Virtual Peaker are a few of the key vendors in the Distributed Energy Resource Management market.

North America will register the highest growth rate of 39.8% among the other regions. Therefore, the Distributed Energy Resource Management market in North America is expected to garner significant business opportunities for the vendors during the forecast period.

US, Canada, Mexico, Germany, UK, France, Italy, Spain, The Netherlands, China, India, Japan, Australia, South Korea, Indonesia, Saudi Arabia, UAE, South Africa, Israel, Turkey, Brazil, Argentina, Colombia

  • Escalating demand for grid resilience against extreme weather is the driving factor this market.

The Distributed Energy Resource Management market vendors should focus on grabbing business opportunities from the Component segment as it accounted for the largest market share in the base year.
RIA - Research AI Assistant
Ask RIA