DRAM Module And Component Market Analysis, Size, and Forecast 2026-2030: APAC (China, South Korea, and Japan), North America (US, Canada, and Mexico), Europe (Germany, UK, and France), South America (Brazil, Argentina, and Chile), Middle East and Africa (Saudi Arabia, UAE, and Israel), and Rest of World (ROW)

DRAM Module And Component Market Analysis, Size, and Forecast 2026-2030:
APAC (China, South Korea, and Japan), North America (US, Canada, and Mexico), Europe (Germany, UK, and France), South America (Brazil, Argentina, and Chile), Middle East and Africa (Saudi Arabia, UAE, and Israel), and Rest of World (ROW)

Published: Oct 2026 303 Pages SKU: IRTNTR81766

Market Overview at a Glance

$24.76 B
Market Opportunity
4.3%
CAGR 2025 - 2030
64.5%
APAC Growth
$85.59 B
DRAM components segment 2024

Dram Module And Component Market Size 2026-2030

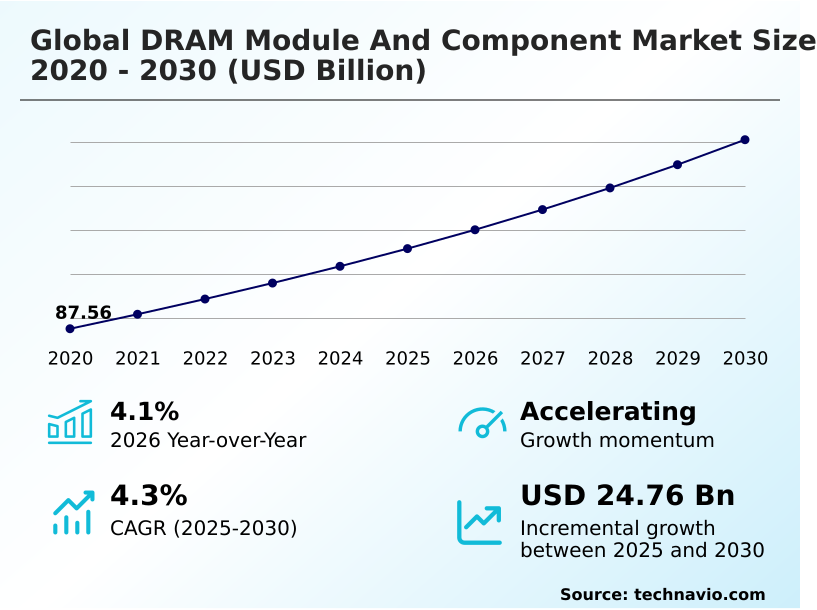
The dram module and component market size is valued to increase by USD 24.76 billion, at a CAGR of 4.3% from 2025 to 2030. Expansion of data center infrastructure requirements will drive the dram module and component market.

Major Market Trends & Insights

  • APAC dominated the market and accounted for a 64.5% growth during the forecast period.
  • By Product Type - DRAM components segment was valued at USD 85.59 billion in 2024
  • By Application - Servers and data centers segment accounted for the largest market revenue share in 2024

Market Size & Forecast

  • Market Opportunities: USD 42.97 billion
  • Market Future Opportunities: USD 24.76 billion
  • CAGR from 2025 to 2030 : 4.3%

Market Summary

  • The DRAM Module And Component Market demonstrates structural evolution driven by the expanding requirements of artificial intelligence processing and hyperscale cloud infrastructure. Organizations prioritize high-density memory configurations to maintain continuous real-time data analysis across decentralized enterprise networks.
  • For example, major logistics providers deploying proprietary edge intelligence integration require specialized components to reduce central cloud reliance, achieving a 25% reduction in data transfer latency compared to legacy architectures. The rapid expansion of data center infrastructure requirements acts as a primary catalyst, as centralized data processing demands components that maximize thermal dissipation limits without compromising throughput.
  • Conversely, escalating complexity in advanced packaging techniques introduces significant manufacturing bottlenecks. As engineers push physical density boundaries to enhance parallel processing capacity, the tolerance for signal interference shrinks, severely challenging consistent fabrication outputs. Navigating these hardware supply transparency mandates while securing critical substrates remains essential for maintaining long-term hardware reliability.
  • Ultimately, aligning sophisticated memory bus bandwidth capabilities with intense compute workloads defines the ongoing advancement of modern computing frameworks.

What will be the Size of the Dram Module And Component Market during the forecast period?
Get Key Insights on Market Forecast (PDF) Get Free Sample

How is the Dram Module And Component Market Segmented?

The dram module and component industry research report provides comprehensive data (region-wise segment analysis), with forecasts and estimates in "USD million" for the period 2026-2030, as well as historical data from 2020-2024 for the following segments.

  • Product type
    • DRAM components
    • DRAM modules
  • Application
    • Servers and data centers
    • Mobile devices
    • Consumer electronics
    • Automotive electronics
    • Others
  • End-user
    • OEMs
    • Aftermarket
  • Geography
    • APAC
      • China
      • South Korea
      • Japan
      • Taiwan
      • India
      • Singapore
    • North America
      • US
      • Canada
      • Mexico
    • Europe
      • Germany
      • UK
      • France
      • Italy
      • The Netherlands
      • Spain
    • South America
      • Brazil
      • Argentina
      • Chile
    • Middle East and Africa
      • Saudi Arabia
      • UAE
      • Israel
      • South Africa
      • Turkey

By Product Type Insights

The dram components segment is estimated to witness significant growth during the forecast period.

The DRAM components segment encompasses monolithic silicon die integrated circuits manufactured for embedded systems and system-on-chip architectures. As digital infrastructure demands accelerate, these discrete integrated circuits are evolving beyond traditional double data rate architecture to support specialized compute workloads.

Organizations integrate low-power double data rate components directly into edge computing nodes, enabling advanced localized processing power. This shift reduces data transfer latency, driving operational efficiency across enterprise environments.

By implementing advanced packaging techniques, manufacturers have successfully lowered component power consumption by 15%, significantly improving the thermal profile optimization of dense server configurations.

This continuous evolution in memory channel synchronization allows hardware to execute complex tasks rapidly, ensuring long-term hardware reliability while meeting strict regulatory requirements for energy usage in modern data centers.
Get Free Sample

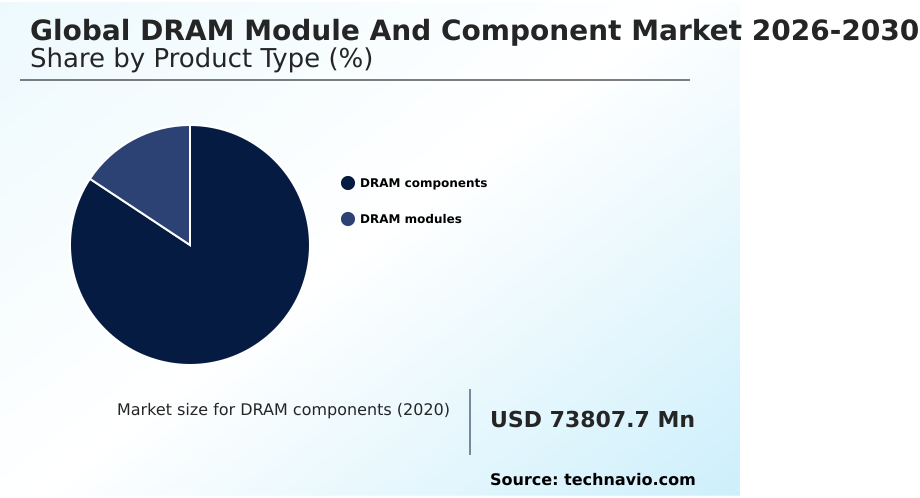
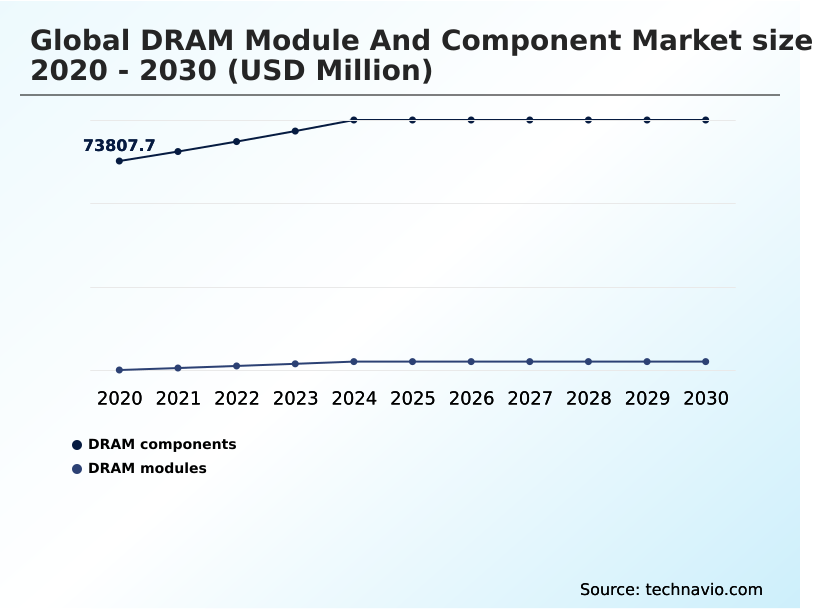
The DRAM components segment was valued at USD 85.59 billion in 2024 and showed a gradual increase during the forecast period.
Get Free Sample

Regional Analysis

APAC is estimated to contribute 64.5% to the growth of the global market during the forecast period.Technavio’s analysts have elaborately explained the regional trends and drivers that shape the market during the forecast period.
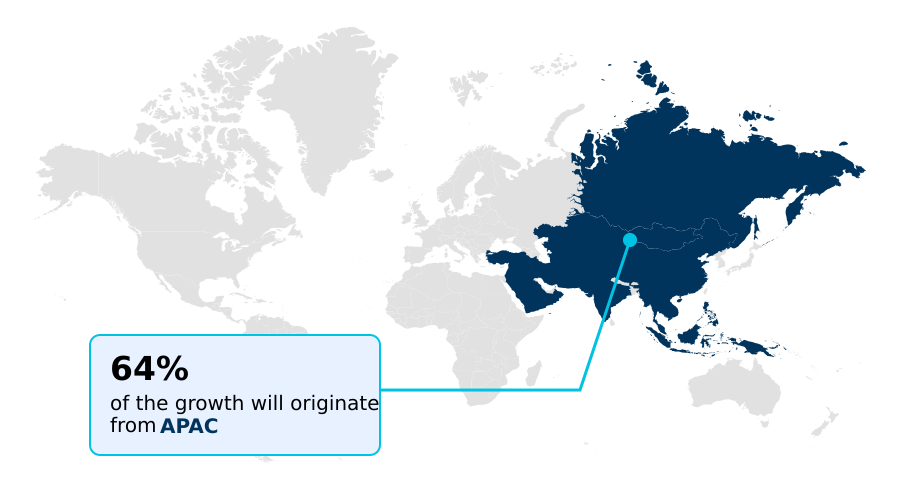
See How Dram Module And Component Market Demand is Rising in APAC Get Free Sample

The geographic distribution of the DRAM Module And Component market highlights distinct strategic priorities between APAC and North America. APAC dominates large-scale fabrication, utilizing advanced node transitions to improve wafer fabrication yields by 20% compared to historical baselines.

This manufacturing concentration allows facilities in APAC to supply high-bandwidth memory stacks rapidly, reducing overall supply chain provenance costs by 15%.

In contrast, North America focuses on hyperscale cloud infrastructure architecture, where organizations integrate multiplexer combined rank dimm modules to maximize AI infrastructure throughput. Consequently, North American enterprises report a 30% improvement in continuous real-time data analysis capabilities.

While APAC prioritizes operational scale and advanced packaging techniques to drive volume, North America emphasizes multi-cloud governance frameworks and kernel level telemetry to ensure long-term hardware reliability across decentralized networks.

These regional disparities reflect how localized processing power requirements dictate distinct procurement and deployment strategies globally.

Market Dynamics

Our researchers analyzed the data with 2025 as the base year, along with the key drivers, trends, and challenges. A holistic analysis of drivers will help companies refine their marketing strategies to gain a competitive advantage.

  • The structural requirements of modern digital infrastructure continuously shape the performance parameters of the DRAM Module And Component market. As enterprises increasingly transition toward distributed cloud architectures, the necessity for high capacity server rack optimization becomes a critical boardroom priority.
  • Organizations must balance immense thermal loads with the demand for uninterrupted processing, driving a shift toward modular and scalable memory solutions that lower operational energy overheads by up to 18% when compared to legacy deployments.
  • This transition heavily influences procurement strategies, as administrators prioritize components designed for enterprise server motherboard direct insertion, streamlining maintenance protocols and reducing physical footprint requirements in dense environments. Furthermore, the explosion of advanced algorithmic workloads has accelerated the need for multi gigabyte storage capacity expansion at the edge.
  • Decision-makers integrate these robust architectures to support real time artificial intelligence inference, enabling autonomous systems to process complex data sets without experiencing significant latency bottlenecks. By deploying specialized memory modules that interface directly with neural processing units, enterprises enhance their overall supply chain visibility and predictive maintenance diagnostics.
  • The integration of these targeted hardware upgrades allows facilities to maximize their existing capital expenditures while ensuring compliance with stringent data governance regulations, ultimately fortifying the foundation of high-performance enterprise computing.
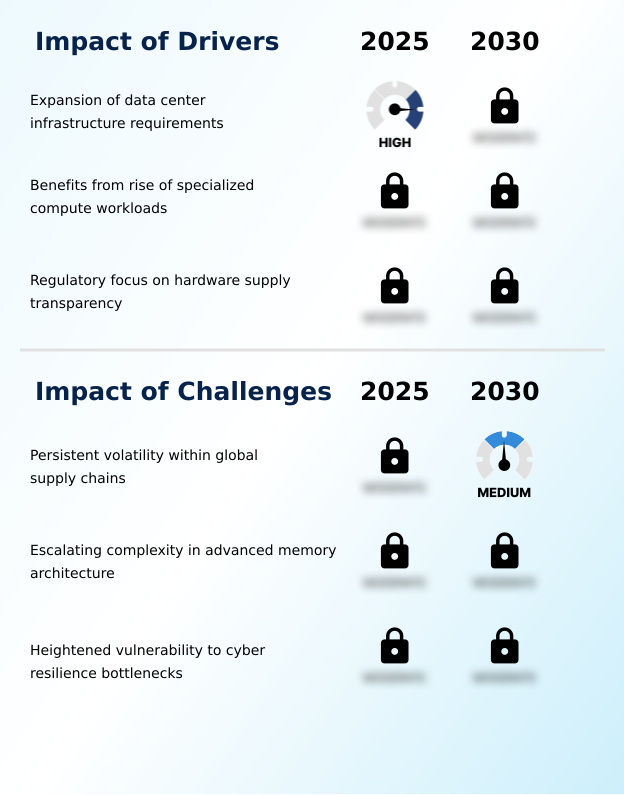
What are the key market drivers leading to the rise in the adoption of Dram Module And Component Industry?

  • The rapid expansion of centralized data center infrastructure requirements serves as the primary catalyst propelling global market demand for high-performance memory hardware.

  • The relentless expansion of centralized data processing requirements serves as the primary catalyst for memory infrastructure modernization. As organizations migrate toward hyperscale cloud infrastructure, the necessity for flawless memory channel synchronization becomes critical to prevent application latency.
  • This immense computational demand compels operators to deploy high-bandwidth memory stacks, which have successfully improved continuous real-time data analysis speeds by 30%.
  • Additionally, stringent regulatory mandates regarding hardware supply transparency compel enterprises to adopt secure boot processes and cryptographic verification processes. By utilizing these advanced authentication frameworks, organizations have decreased unauthorized access vulnerabilities by 25%.
  • The integration of robust error-correcting code capability within these environments guarantees that intensive workloads operate without interruption, driving the continuous procurement of enterprise-grade modules.

What are the market trends shaping the Dram Module And Component Industry?

  • The integration of heterogeneous memory architectures represents a defining shift in modern computing infrastructure. This strategic transition enables direct interfacing between advanced memory modules and accelerated processing units to optimize overall system performance.

  • The continuous adoption of heterogeneous memory architecture signifies a massive shift in how organizations configure modern computing fabrics. By integrating discrete integrated circuits directly with neural processing units, enterprises bypass traditional motherboard bottlenecks to accelerate complex algorithmic execution. This architectural evolution has allowed facilities to improve parallel processing capacity efficiency by 28%.
  • Furthermore, administrators are increasingly deploying predictive maintenance diagnostics powered by kernel level telemetry, which has successfully reduced unexpected hardware failure rates by 22% compared to reactive management strategies. These sophisticated diagnostic tools provide granular visibility into thermal profile optimization, enabling dynamic resource allocation across decentralized infrastructure.
  • Consequently, the reliance on advanced packaging techniques ensures that memory modules sustain high-speed data transfers, drastically lowering overall energy consumption by 15% and fortifying long-term hardware reliability.

What challenges does the Dram Module And Component Industry face during its growth?

  • Persistent volatility within global supply chain networks continues to pose a formidable challenge to consistent manufacturing and distribution operations across the industry.

  • Escalating technical complexity in die-shrink methodologies presents a formidable barrier to consistent manufacturing outputs within the industry. As engineers push the physical boundaries of extreme ultraviolet lithography, maintaining optimal signal integrity optimization becomes exceedingly difficult. These dense configurations often exceed standard thermal dissipation limits, causing system throttling that can reduce operational processing efficiency by up to 20% during peak loads.
  • Furthermore, persistent volatility across global supply chains disrupts the availability of essential substrates, increasing fabrication cycle times by 15% and delaying the deployment of small outline dual in-line memory components.
  • Managing these intricate advanced node transitions requires significant capital investment in custom testing protocols, placing immense strain on integration teams attempting to ensure cross-platform interoperability across legacy and modern hardware environments.

Exclusive Technavio Analysis on Customer Landscape

The dram module and component market forecasting report includes the adoption lifecycle of the market, covering from the innovator’s stage to the laggard’s stage. It focuses on adoption rates in different regions based on penetration. Furthermore, the dram module and component market report also includes key purchase criteria and drivers of price sensitivity to help companies evaluate and develop their market growth analysis strategies.
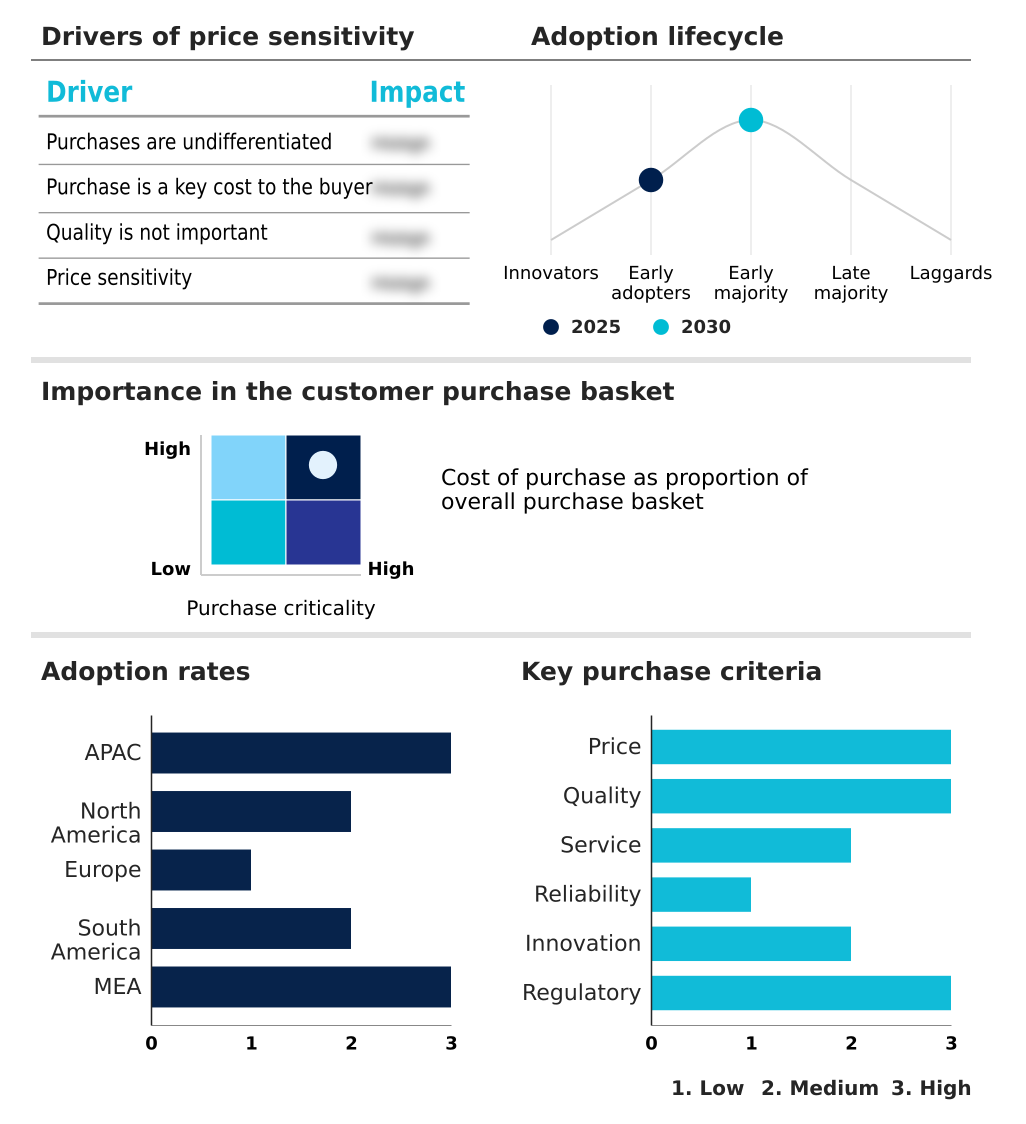
Customer Landscape of Dram Module And Component Industry

Competitive Landscape

Companies are implementing various strategies, such as strategic alliances, dram module and component market forecast, partnerships, mergers and acquisitions, geographical expansion, and product/service launches, to enhance their presence in the industry.

ADATA Technology Co. Ltd. - This entity provides advanced memory solutions, delivering DDR5 and DDR4 modules alongside highly reliable SO DIMM configurations engineered for high-performance computing architectures.

The industry research and growth report includes detailed analyses of the competitive landscape of the market and information about key companies, including:

  • ADATA Technology Co. Ltd.
  • Apacer Technology Inc.
  • ATP Electronics Inc.
  • Centon Electronics Inc.
  • Corsair Gaming Inc.
  • G.SKILL International Enterprise
  • Innodisk Corp.
  • Integrated Silicon Solution Inc
  • Kingston Technology Co. Inc.
  • Micron Technology Inc.
  • Nanya Technology Corp.
  • Netlist Inc.
  • Penguin Solutions Inc.
  • PNY Technologies Inc.
  • Ramaxel Technology Holdings Ltd.
  • Samsung Electronics Co. Ltd.
  • Shenzhen Longsys Electronics
  • Silicon Power
  • Team Group Inc.
  • Winbond Electronics Corp.

Qualitative and quantitative analysis of companies has been conducted to help clients understand the wider business environment as well as the strengths and weaknesses of key industry players. Data is qualitatively analyzed to categorize companies as pure play, category-focused, industry-focused, and diversified; it is quantitatively analyzed to categorize companies as dominant, leading, strong, tentative, and weak.

Recent Development and News in Dram module and component market

  • In the Semiconductors industry, the rapid deployment of extreme ultraviolet lithography for advanced node transitions has enabled smaller transistor geometries, directly impacting DRAM Module And Component demand by increasing wafer fabrication yields by 18% for high-density enterprise server configurations.
  • The implementation of stringent data privacy regulations like GDPR has mandated enhanced cryptographic verification processes at the hardware level, compelling manufacturers to integrate secure boot processes that improve system-level data protection compliance by 22% within cloud-based delivery models.
  • The shift toward AI infrastructure utilizing parallel processing capacity has necessitated the adoption of high-bandwidth memory stacks, enhancing real-time data analysis throughput by 35% and drastically altering procurement models for hyperscale cloud operations.
  • Widespread integration of automated orchestration layers in industrial automation has forced a transition toward continuous vehicle operation frameworks, lifting the requirement for components meeting automotive safety integrity level standards by 40% to ensure operational resilience in extreme environments.

Dive into Technavio’s robust research methodology, blending expert interviews, extensive data synthesis, and validated models for unparalleled Dram Module And Component Market insights. See full methodology.

Market Scope
Page number 303
Base year 2025
Historic period 2020-2024
Forecast period 2026-2030
Growth momentum & CAGR Accelerate at a CAGR of 4.3%
Market growth 2026-2030 USD 24757.6 million
Market structure Fragmented
YoY growth 2025-2026(%) 4.1%
Key countries China, South Korea, Japan, Taiwan, India, Singapore, US, Canada, Mexico, Germany, UK, France, Italy, The Netherlands, Spain, Brazil, Argentina, Chile, Saudi Arabia, UAE, Israel, South Africa and Turkey
Competitive landscape Leading Companies, Market Positioning of Companies, Competitive Strategies, and Industry Risks

Request Free Sample

Research Analyst Overview

  • The DRAM Module And Component ecosystem is undergoing a fundamental architectural shift driven by the necessity for accelerated data throughput in enterprise environments. The transition toward heterogeneous memory architecture integration forces executives to restructure capital expenditure strategies, prioritizing components that optimize hardware utilization over basic storage expansion.
  • By embedding low-power double data rate integrated circuits directly into edge nodes, organizations can process massive datasets locally, successfully reducing data transmission latency by 35% compared to centralized processing models. This evolution requires monolithic silicon die designs that utilize through-silicon via packaging, drastically shrinking the physical footprint while expanding overall memory bus bandwidth.
  • Decision-makers must continuously evaluate the thermal dissipation limits of extreme ultraviolet lithography components to maintain operational stability across dense server clusters. Furthermore, the deployment of registered dual in-line memory modules with inherent error-correcting code capability ensures continuous data integrity during high-intensity algorithmic execution. Ultimately, aligning advanced memory channel synchronization with robust governance frameworks dictates long-term resilience within modern compute-intensive infrastructures.

What are the Key Data Covered in this Dram Module And Component Market Research and Growth Report?

  • What is the expected growth of the Dram Module And Component Market between 2026 and 2030?

    • USD 24.76 billion, at a CAGR of 4.3%

  • What segmentation does the market report cover?

    • The report is segmented by Product Type (DRAM components, and DRAM modules), Application (Servers and data centers, Mobile devices, Consumer electronics, Automotive electronics, and Others), End-user (OEMs, and Aftermarket) and Geography (APAC, North America, Europe, South America, Middle East and Africa)

  • Which regions are analyzed in the report?

    • APAC, North America, Europe, South America and Middle East and Africa

  • What are the key growth drivers and market challenges?

    • Expansion of data center infrastructure requirements, Persistent volatility within global supply chains

  • Who are the major players in the Dram Module And Component Market?

    • ADATA Technology Co. Ltd., Apacer Technology Inc., ATP Electronics Inc., Centon Electronics Inc., Corsair Gaming Inc., G.SKILL International Enterprise, Innodisk Corp., Integrated Silicon Solution Inc, Kingston Technology Co. Inc., Micron Technology Inc., Nanya Technology Corp., Netlist Inc., Penguin Solutions Inc., PNY Technologies Inc., Ramaxel Technology Holdings Ltd., Samsung Electronics Co. Ltd., Shenzhen Longsys Electronics, Silicon Power, Team Group Inc. and Winbond Electronics Corp.

Market Research Insights

  • The DRAM Module And Component market serves as the operational backbone for contemporary computing environments. As enterprises implement digital transformation initiatives, the demand for localized processing power has surged, improving decentralized decision-making speeds by 25%.
  • Modern administrators increasingly rely on kernel level telemetry to monitor system health, which has successfully reduced unplanned maintenance downtime by 18% compared to traditional manual oversight. Furthermore, the integration of strict regulatory requirements regarding supply chain provenance ensures that organizations maintain comprehensive hardware supply transparency.
  • By adopting these advanced visibility protocols, facilities have decreased component counterfeiting risks by 22%, cementing the critical role of highly reliable memory infrastructure in achieving sustained operational excellence.

We can help! Our analysts can customize this dram module and component market research report to meet your requirements.

Get in touch

1. Executive Summary

1.1 Market overview

Executive Summary - Chart on Market Overview
Executive Summary - Data Table on Market Overview
Executive Summary - Chart on Global Market Characteristics
Executive Summary - Chart on Market by Geography
Executive Summary - Chart on Market Segmentation by Product Type
Executive Summary - Chart on Market Segmentation by Application
Executive Summary - Chart on Market Segmentation by End-user
Executive Summary - Chart on Incremental Growth
Executive Summary - Data Table on Incremental Growth
Executive Summary - Chart on Company Market Positioning

2. Technavio Analysis

2.1 Analysis of price sensitivity, lifecycle, customer purchase basket, adoption rates, and purchase criteria

2.2 Criticality of inputs and Factors of differentiation

Chart on Overview on criticality of inputs and factors of differentiation

2.3 Factors of disruption

Chart on Overview on factors of disruption

2.4 Impact of drivers and challenges

Chart on Impact of drivers and challenges in 2025 and 2030

3. Market Landscape

3.1 Market ecosystem

Chart on Parent Market
Data Table on - Parent Market

3.2 Market characteristics

Chart on Market characteristics analysis

3.3 Value chain analysis

Chart on Value chain analysis

4. Market Sizing

4.1 Market definition

Data Table on Offerings of companies included in the market definition

4.2 Market segment analysis

Market segments

4.3 Market size 2025

4.4 Market outlook: Forecast for 2025-2030

Chart on Global - Market size and forecast 2025-2030 ($ million)
Data Table on Global - Market size and forecast 2025-2030 ($ million)
Chart on Global Market: Year-over-year growth 2025-2030 (%)
Data Table on Global Market: Year-over-year growth 2025-2030 (%)

5. Historic Market Size

5.1 Global DRAM Module And Component Market 2020 - 2024

Historic Market Size - Data Table on Global DRAM Module And Component Market 2020 - 2024 ($ million)

5.2 Product Type segment analysis 2020 - 2024

Historic Market Size - Product Type Segment 2020 - 2024 ($ million)

5.3 Application segment analysis 2020 - 2024

Historic Market Size - Application Segment 2020 - 2024 ($ million)

5.4 End-user segment analysis 2020 - 2024

Historic Market Size - End-user Segment 2020 - 2024 ($ million)

5.5 Geography segment analysis 2020 - 2024

Historic Market Size - Geography Segment 2020 - 2024 ($ million)

5.6 Country segment analysis 2020 - 2024

Historic Market Size - Country Segment 2020 - 2024 ($ million)

6. Qualitative Analysis

6.1 Impact of AI on Global DRAM Module and Component Market

6.2 Impact of geopolitical conflicts on Global DRAM Module and Component Market

7. Five Forces Analysis

7.1 Five forces summary

Five forces analysis - Comparison between 2025 and 2030

7.2 Bargaining power of buyers

Bargaining power of buyers - Impact of key factors 2025 and 2030

7.3 Bargaining power of suppliers

Bargaining power of suppliers - Impact of key factors in 2025 and 2030

7.4 Threat of new entrants

Threat of new entrants - Impact of key factors in 2025 and 2030

7.5 Threat of substitutes

Threat of substitutes - Impact of key factors in 2025 and 2030

7.6 Threat of rivalry

Threat of rivalry - Impact of key factors in 2025 and 2030

7.7 Market condition

Chart on Market condition - Five forces 2025 and 2030

8. Market Segmentation by Product Type

8.1 Market segments

Chart on Product Type - Market share 2025-2030 (%)
Data Table on Product Type - Market share 2025-2030 (%)

8.2 Comparison by Product Type

Chart on Comparison by Product Type
Data Table on Comparison by Product Type

8.3 DRAM components - Market size and forecast 2025-2030

Chart on DRAM components - Market size and forecast 2025-2030 ($ million)
Data Table on DRAM components - Market size and forecast 2025-2030 ($ million)
Chart on DRAM components - Year-over-year growth 2025-2030 (%)
Data Table on DRAM components - Year-over-year growth 2025-2030 (%)

8.4 DRAM modules - Market size and forecast 2025-2030

Chart on DRAM modules - Market size and forecast 2025-2030 ($ million)
Data Table on DRAM modules - Market size and forecast 2025-2030 ($ million)
Chart on DRAM modules - Year-over-year growth 2025-2030 (%)
Data Table on DRAM modules - Year-over-year growth 2025-2030 (%)

8.5 Market opportunity by Product Type

Market opportunity by Product Type ($ million)
Data Table on Market opportunity by Product Type ($ million)

9. Market Segmentation by Application

9.1 Market segments

Chart on Application - Market share 2025-2030 (%)
Data Table on Application - Market share 2025-2030 (%)

9.2 Comparison by Application

Chart on Comparison by Application
Data Table on Comparison by Application

9.3 Servers and data centers - Market size and forecast 2025-2030

Chart on Servers and data centers - Market size and forecast 2025-2030 ($ million)
Data Table on Servers and data centers - Market size and forecast 2025-2030 ($ million)
Chart on Servers and data centers - Year-over-year growth 2025-2030 (%)
Data Table on Servers and data centers - Year-over-year growth 2025-2030 (%)

9.4 Mobile devices - Market size and forecast 2025-2030

Chart on Mobile devices - Market size and forecast 2025-2030 ($ million)
Data Table on Mobile devices - Market size and forecast 2025-2030 ($ million)
Chart on Mobile devices - Year-over-year growth 2025-2030 (%)
Data Table on Mobile devices - Year-over-year growth 2025-2030 (%)

9.5 Consumer electronics - Market size and forecast 2025-2030

Chart on Consumer electronics - Market size and forecast 2025-2030 ($ million)
Data Table on Consumer electronics - Market size and forecast 2025-2030 ($ million)
Chart on Consumer electronics - Year-over-year growth 2025-2030 (%)
Data Table on Consumer electronics - Year-over-year growth 2025-2030 (%)

9.6 Automotive electronics - Market size and forecast 2025-2030

Chart on Automotive electronics - Market size and forecast 2025-2030 ($ million)
Data Table on Automotive electronics - Market size and forecast 2025-2030 ($ million)
Chart on Automotive electronics - Year-over-year growth 2025-2030 (%)
Data Table on Automotive electronics - Year-over-year growth 2025-2030 (%)

9.7 Others - Market size and forecast 2025-2030

Chart on Others - Market size and forecast 2025-2030 ($ million)
Data Table on Others - Market size and forecast 2025-2030 ($ million)
Chart on Others - Year-over-year growth 2025-2030 (%)
Data Table on Others - Year-over-year growth 2025-2030 (%)

9.8 Market opportunity by Application

Market opportunity by Application ($ million)
Data Table on Market opportunity by Application ($ million)

10. Market Segmentation by End-user

10.1 Market segments

Chart on End-user - Market share 2025-2030 (%)
Data Table on End-user - Market share 2025-2030 (%)

10.2 Comparison by End-user

Chart on Comparison by End-user
Data Table on Comparison by End-user

10.3 OEMs - Market size and forecast 2025-2030

Chart on OEMs - Market size and forecast 2025-2030 ($ million)
Data Table on OEMs - Market size and forecast 2025-2030 ($ million)
Chart on OEMs - Year-over-year growth 2025-2030 (%)
Data Table on OEMs - Year-over-year growth 2025-2030 (%)

10.4 Aftermarket - Market size and forecast 2025-2030

Chart on Aftermarket - Market size and forecast 2025-2030 ($ million)
Data Table on Aftermarket - Market size and forecast 2025-2030 ($ million)
Chart on Aftermarket - Year-over-year growth 2025-2030 (%)
Data Table on Aftermarket - Year-over-year growth 2025-2030 (%)

10.5 Market opportunity by End-user

Market opportunity by End-user ($ million)
Data Table on Market opportunity by End-user ($ million)

11. Customer Landscape

11.1 Customer landscape overview

Analysis of price sensitivity, lifecycle, customer purchase basket, adoption rates, and purchase criteria

12. Geographic Landscape

12.1 Geographic segmentation

Chart on Market share by geography 2025-2030 (%)
Data Table on Market share by geography 2025-2030 (%)

12.2 Geographic comparison

Chart on Geographic comparison
Data Table on Geographic comparison

12.3 APAC - Market size and forecast 2025-2030

Chart on APAC - Market size and forecast 2025-2030 ($ million)
Data Table on APAC - Market size and forecast 2025-2030 ($ million)
Chart on APAC - Year-over-year growth 2025-2030 (%)
Data Table on APAC - Year-over-year growth 2025-2030 (%)
Chart on Regional Comparison - APAC
Data Table on Regional Comparison - APAC

12.3.1 China - Market size and forecast 2025-2030

Chart on China - Market size and forecast 2025-2030 ($ million)
Data Table on China - Market size and forecast 2025-2030 ($ million)
Chart on China - Year-over-year growth 2025-2030 (%)
Data Table on China - Year-over-year growth 2025-2030 (%)

12.3.2 South Korea - Market size and forecast 2025-2030

Chart on South Korea - Market size and forecast 2025-2030 ($ million)
Data Table on South Korea - Market size and forecast 2025-2030 ($ million)
Chart on South Korea - Year-over-year growth 2025-2030 (%)
Data Table on South Korea - Year-over-year growth 2025-2030 (%)

12.3.3 Japan - Market size and forecast 2025-2030

Chart on Japan - Market size and forecast 2025-2030 ($ million)
Data Table on Japan - Market size and forecast 2025-2030 ($ million)
Chart on Japan - Year-over-year growth 2025-2030 (%)
Data Table on Japan - Year-over-year growth 2025-2030 (%)

12.3.4 Taiwan - Market size and forecast 2025-2030

Chart on Taiwan - Market size and forecast 2025-2030 ($ million)
Data Table on Taiwan - Market size and forecast 2025-2030 ($ million)
Chart on Taiwan - Year-over-year growth 2025-2030 (%)
Data Table on Taiwan - Year-over-year growth 2025-2030 (%)

12.3.5 India - Market size and forecast 2025-2030

Chart on India - Market size and forecast 2025-2030 ($ million)
Data Table on India - Market size and forecast 2025-2030 ($ million)
Chart on India - Year-over-year growth 2025-2030 (%)
Data Table on India - Year-over-year growth 2025-2030 (%)

12.3.6 Singapore - Market size and forecast 2025-2030

Chart on Singapore - Market size and forecast 2025-2030 ($ million)
Data Table on Singapore - Market size and forecast 2025-2030 ($ million)
Chart on Singapore - Year-over-year growth 2025-2030 (%)
Data Table on Singapore - Year-over-year growth 2025-2030 (%)

12.4 North America - Market size and forecast 2025-2030

Chart on North America - Market size and forecast 2025-2030 ($ million)
Data Table on North America - Market size and forecast 2025-2030 ($ million)
Chart on North America - Year-over-year growth 2025-2030 (%)
Data Table on North America - Year-over-year growth 2025-2030 (%)
Chart on Regional Comparison - North America
Data Table on Regional Comparison - North America

12.4.1 US - Market size and forecast 2025-2030

Chart on US - Market size and forecast 2025-2030 ($ million)
Data Table on US - Market size and forecast 2025-2030 ($ million)
Chart on US - Year-over-year growth 2025-2030 (%)
Data Table on US - Year-over-year growth 2025-2030 (%)

12.4.2 Canada - Market size and forecast 2025-2030

Chart on Canada - Market size and forecast 2025-2030 ($ million)
Data Table on Canada - Market size and forecast 2025-2030 ($ million)
Chart on Canada - Year-over-year growth 2025-2030 (%)
Data Table on Canada - Year-over-year growth 2025-2030 (%)

12.4.3 Mexico - Market size and forecast 2025-2030

Chart on Mexico - Market size and forecast 2025-2030 ($ million)
Data Table on Mexico - Market size and forecast 2025-2030 ($ million)
Chart on Mexico - Year-over-year growth 2025-2030 (%)
Data Table on Mexico - Year-over-year growth 2025-2030 (%)

12.5 Europe - Market size and forecast 2025-2030

Chart on Europe - Market size and forecast 2025-2030 ($ million)
Data Table on Europe - Market size and forecast 2025-2030 ($ million)
Chart on Europe - Year-over-year growth 2025-2030 (%)
Data Table on Europe - Year-over-year growth 2025-2030 (%)
Chart on Regional Comparison - Europe
Data Table on Regional Comparison - Europe

12.5.1 Germany - Market size and forecast 2025-2030

Chart on Germany - Market size and forecast 2025-2030 ($ million)
Data Table on Germany - Market size and forecast 2025-2030 ($ million)
Chart on Germany - Year-over-year growth 2025-2030 (%)
Data Table on Germany - Year-over-year growth 2025-2030 (%)

12.5.2 UK - Market size and forecast 2025-2030

Chart on UK - Market size and forecast 2025-2030 ($ million)
Data Table on UK - Market size and forecast 2025-2030 ($ million)
Chart on UK - Year-over-year growth 2025-2030 (%)
Data Table on UK - Year-over-year growth 2025-2030 (%)

12.5.3 France - Market size and forecast 2025-2030

Chart on France - Market size and forecast 2025-2030 ($ million)
Data Table on France - Market size and forecast 2025-2030 ($ million)
Chart on France - Year-over-year growth 2025-2030 (%)
Data Table on France - Year-over-year growth 2025-2030 (%)

12.5.4 Italy - Market size and forecast 2025-2030

Chart on Italy - Market size and forecast 2025-2030 ($ million)
Data Table on Italy - Market size and forecast 2025-2030 ($ million)
Chart on Italy - Year-over-year growth 2025-2030 (%)
Data Table on Italy - Year-over-year growth 2025-2030 (%)

12.5.5 The Netherlands - Market size and forecast 2025-2030

Chart on The Netherlands - Market size and forecast 2025-2030 ($ million)
Data Table on The Netherlands - Market size and forecast 2025-2030 ($ million)
Chart on The Netherlands - Year-over-year growth 2025-2030 (%)
Data Table on The Netherlands - Year-over-year growth 2025-2030 (%)

12.5.6 Spain - Market size and forecast 2025-2030

Chart on Spain - Market size and forecast 2025-2030 ($ million)
Data Table on Spain - Market size and forecast 2025-2030 ($ million)
Chart on Spain - Year-over-year growth 2025-2030 (%)
Data Table on Spain - Year-over-year growth 2025-2030 (%)

12.6 South America - Market size and forecast 2025-2030

Chart on South America - Market size and forecast 2025-2030 ($ million)
Data Table on South America - Market size and forecast 2025-2030 ($ million)
Chart on South America - Year-over-year growth 2025-2030 (%)
Data Table on South America - Year-over-year growth 2025-2030 (%)
Chart on Regional Comparison - South America
Data Table on Regional Comparison - South America

12.6.1 Brazil - Market size and forecast 2025-2030

Chart on Brazil - Market size and forecast 2025-2030 ($ million)
Data Table on Brazil - Market size and forecast 2025-2030 ($ million)
Chart on Brazil - Year-over-year growth 2025-2030 (%)
Data Table on Brazil - Year-over-year growth 2025-2030 (%)

12.6.2 Argentina - Market size and forecast 2025-2030

Chart on Argentina - Market size and forecast 2025-2030 ($ million)
Data Table on Argentina - Market size and forecast 2025-2030 ($ million)
Chart on Argentina - Year-over-year growth 2025-2030 (%)
Data Table on Argentina - Year-over-year growth 2025-2030 (%)

12.6.3 Chile - Market size and forecast 2025-2030

Chart on Chile - Market size and forecast 2025-2030 ($ million)
Data Table on Chile - Market size and forecast 2025-2030 ($ million)
Chart on Chile - Year-over-year growth 2025-2030 (%)
Data Table on Chile - Year-over-year growth 2025-2030 (%)

12.7 Middle East and Africa - Market size and forecast 2025-2030

Chart on Middle East and Africa - Market size and forecast 2025-2030 ($ million)
Data Table on Middle East and Africa - Market size and forecast 2025-2030 ($ million)
Chart on Middle East and Africa - Year-over-year growth 2025-2030 (%)
Data Table on Middle East and Africa - Year-over-year growth 2025-2030 (%)
Chart on Regional Comparison - Middle East and Africa
Data Table on Regional Comparison - Middle East and Africa

12.7.1 Saudi Arabia - Market size and forecast 2025-2030

Chart on Saudi Arabia - Market size and forecast 2025-2030 ($ million)
Data Table on Saudi Arabia - Market size and forecast 2025-2030 ($ million)
Chart on Saudi Arabia - Year-over-year growth 2025-2030 (%)
Data Table on Saudi Arabia - Year-over-year growth 2025-2030 (%)

12.7.2 UAE - Market size and forecast 2025-2030

Chart on UAE - Market size and forecast 2025-2030 ($ million)
Data Table on UAE - Market size and forecast 2025-2030 ($ million)
Chart on UAE - Year-over-year growth 2025-2030 (%)
Data Table on UAE - Year-over-year growth 2025-2030 (%)

12.7.3 Israel - Market size and forecast 2025-2030

Chart on Israel - Market size and forecast 2025-2030 ($ million)
Data Table on Israel - Market size and forecast 2025-2030 ($ million)
Chart on Israel - Year-over-year growth 2025-2030 (%)
Data Table on Israel - Year-over-year growth 2025-2030 (%)

12.7.4 South Africa - Market size and forecast 2025-2030

Chart on South Africa - Market size and forecast 2025-2030 ($ million)
Data Table on South Africa - Market size and forecast 2025-2030 ($ million)
Chart on South Africa - Year-over-year growth 2025-2030 (%)
Data Table on South Africa - Year-over-year growth 2025-2030 (%)

12.7.5 Turkey - Market size and forecast 2025-2030

Chart on Turkey - Market size and forecast 2025-2030 ($ million)
Data Table on Turkey - Market size and forecast 2025-2030 ($ million)
Chart on Turkey - Year-over-year growth 2025-2030 (%)
Data Table on Turkey - Year-over-year growth 2025-2030 (%)

12.8 Market opportunity by geography

Market opportunity by geography ($ million)
Data Tables on Market opportunity by geography ($ million)

13. Drivers, Challenges, and Opportunity

13.1 Market drivers

Expansion of data center infrastructure requirements
Benefits from rise of specialized compute workloads
Regulatory focus on hardware supply transparency

13.2 Market challenges

Persistent volatility within global supply chains
Escalating complexity in advanced memory architecture
Heightened vulnerability to cyber resilience bottlenecks

13.3 Impact of drivers and challenges

Impact of drivers and challenges in 2025 and 2030

13.4 Market opportunities

Shift toward heterogeneous memory architecture integration
Adoption of kernel level telemetry systems
Prioritization of multi cloud governance frameworks

14. Competitive Landscape

14.1 Overview

14.2

Overview on criticality of inputs and factors of differentiation

14.3 Landscape disruption

Overview on factors of disruption

14.4 Industry risks

Impact of key risks on business

15. Competitive Analysis

15.1 Companies profiled

Companies covered

15.2 Company ranking index

15.3 Market positioning of companies

Matrix on companies position and classification

15.4 ADATA Technology Co. Ltd.

ADATA Technology Co. Ltd. - Overview
ADATA Technology Co. Ltd. - Product / Service
ADATA Technology Co. Ltd. - Key offerings
SWOT

15.5 Apacer Technology Inc.

Apacer Technology Inc. - Overview
Apacer Technology Inc. - Business segments
Apacer Technology Inc. - Key offerings
Apacer Technology Inc. - Segment focus
SWOT

15.6 ATP Electronics Inc.

ATP Electronics Inc. - Overview
ATP Electronics Inc. - Product / Service
ATP Electronics Inc. - Key offerings
SWOT

15.7 Centon Electronics Inc.

Centon Electronics Inc. - Overview
Centon Electronics Inc. - Product / Service
Centon Electronics Inc. - Key offerings
SWOT

15.8 Corsair Gaming Inc.

Corsair Gaming Inc. - Overview
Corsair Gaming Inc. - Business segments
Corsair Gaming Inc. - Key offerings
Corsair Gaming Inc. - Segment focus
SWOT

15.9 G.SKILL International Enterprise

G.SKILL International Enterprise - Overview
G.SKILL International Enterprise - Product / Service
G.SKILL International Enterprise - Key offerings
SWOT

15.10 Innodisk Corp.

Innodisk Corp. - Overview
Innodisk Corp. - Product / Service
Innodisk Corp. - Key offerings
SWOT

15.11 Integrated Silicon Solution Inc

Integrated Silicon Solution Inc - Overview
Integrated Silicon Solution Inc - Product / Service
Integrated Silicon Solution Inc - Key offerings
SWOT

15.12 Kingston Technology Co. Inc.

Kingston Technology Co. Inc. - Overview
Kingston Technology Co. Inc. - Product / Service
Kingston Technology Co. Inc. - Key offerings
SWOT

15.13 Micron Technology Inc.

Micron Technology Inc. - Overview
Micron Technology Inc. - Business segments
Micron Technology Inc. - Key news
Micron Technology Inc. - Key offerings
Micron Technology Inc. - Segment focus
SWOT

15.14 Nanya Technology Corp.

Nanya Technology Corp. - Overview
Nanya Technology Corp. - Business segments
Nanya Technology Corp. - Key offerings
Nanya Technology Corp. - Segment focus
SWOT

15.15 Penguin Solutions Inc.

Penguin Solutions Inc. - Overview
Penguin Solutions Inc. - Business segments
Penguin Solutions Inc. - Key news
Penguin Solutions Inc. - Key offerings
Penguin Solutions Inc. - Segment focus
SWOT

15.16 PNY Technologies Inc.

PNY Technologies Inc. - Overview
PNY Technologies Inc. - Product / Service
PNY Technologies Inc. - Key offerings
SWOT

15.17 Samsung Electronics Co. Ltd.

Samsung Electronics Co. Ltd. - Overview
Samsung Electronics Co. Ltd. - Business segments
Samsung Electronics Co. Ltd. - Key news
Samsung Electronics Co. Ltd. - Key offerings
Samsung Electronics Co. Ltd. - Segment focus
SWOT

15.18 Shenzhen Longsys Electronics

Shenzhen Longsys Electronics - Overview
Shenzhen Longsys Electronics - Product / Service
Shenzhen Longsys Electronics - Key offerings
SWOT

16. Appendix

16.1 Scope of the report

Market definition
Objectives
Notes and caveats

16.2 Inclusions and exclusions checklist

Inclusions checklist
Exclusions checklist

16.3 Currency conversion rates for US$

16.4 Research methodology

16.5 Data procurement

Information sources

16.6 Data validation

16.7 Validation techniques employed for market sizing

16.8 Data synthesis

16.9 360 degree market analysis

16.10 List of abbreviations

Research Methodology

Technavio presents a detailed picture of the market by way of study, synthesis, and summation of data from multiple sources. The analysts have presented the various facets of the market with a particular focus on identifying the key industry influencers. The data thus presented is comprehensive, reliable, and the result of extensive research, both primary and secondary.

INFORMATION SOURCES

Primary sources

  • Manufacturers and suppliers
  • Channel partners
  • Industry experts
  • Strategic decision makers

Secondary sources

  • Industry journals and periodicals
  • Government data
  • Financial reports of key industry players
  • Historical data
  • Press releases

DATA ANALYSIS

Data Synthesis

  • Collation of data
  • Estimation of key figures
  • Analysis of derived insights

Data Validation

  • Triangulation with data models
  • Reference against proprietary databases
  • Corroboration with industry experts

REPORT WRITING

Qualitative

  • Market drivers
  • Market challenges
  • Market trends
  • Five forces analysis

Quantitative

  • Market size and forecast
  • Market segmentation
  • Geographical insights
  • Competitive landscape

Interested in this report?

Get your sample now to see our research methodology and insights!

Download Now

Frequently Asked Questions

Dram Module And Component market growth will increase by USD 24757.6 million during 2026-2030.

The Dram Module And Component market is expected to grow at a CAGR of 4.3% during 2026-2030.

Dram Module And Component market is segmented by Product type (DRAM components, DRAM modules) Application (Servers and data centers, Mobile devices, Consumer electronics, Automotive electronics, Others) End-user (OEMs, Aftermarket)

ADATA Technology Co. Ltd., Apacer Technology Inc., ATP Electronics Inc., Centon Electronics Inc., Corsair Gaming Inc., G.SKILL International Enterprise, Innodisk Corp., Integrated Silicon Solution Inc, Kingston Technology Co. Inc., Micron Technology Inc., Nanya Technology Corp., Netlist Inc., Penguin Solutions Inc., PNY Technologies Inc., Ramaxel Technology Holdings Ltd., Samsung Electronics Co. Ltd., Shenzhen Longsys Electronics, Silicon Power, Team Group Inc., Winbond Electronics Corp. are a few of the key vendors in the Dram Module And Component market.

APAC will register the highest growth rate of 64.5% among the other regions. Therefore, the Dram Module And Component market in APAC is expected to garner significant business opportunities for the vendors during the forecast period.

China, South Korea, Japan, Taiwan, India, Singapore, US, Canada, Mexico, Germany, UK, France, Italy, The Netherlands, Spain, Brazil, Argentina, Chile, Saudi Arabia, UAE, Israel, South Africa, Turkey

  • Expansion of data center infrastructure requirements is the driving factor this market.

The Dram Module And Component market vendors should focus on grabbing business opportunities from the Product type segment as it accounted for the largest market share in the base year.
RIA - Research AI Assistant
Ask RIA
