Drip Emitters Market Analysis North America, APAC, Europe, South America, Middle East and Africa - US, Canada, France, China, Russia - Size and Forecast 2024-2028

Drip Emitters Market Analysis North America, APAC, Europe, South America, Middle East and Africa - US, Canada, France, China, Russia - Size and Forecast 2024-2028

Published: Jul 2024 135 Pages SKU: IRTNTR74553

Market Overview at a Glance

$444.4 Mn
Market Opportunity
12.13%
CAGR
10.94
YoY growth 2023-2024(%)

Drip Emitters Market Size 2024-2028 

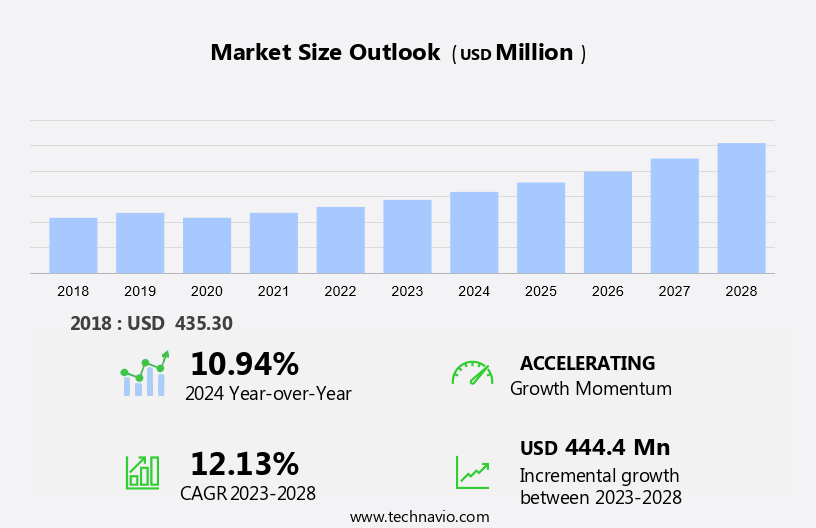
The drip emitters market size is forecast to increase by USD 444.4 million at a CAGR of 12.13% between 2023 and 2028. The market is experiencing significant growth due to the increasing water constraint and the trend towards technological progress in agriculture. The focus on efficient use of natural resources is driving the demand for automatic drip irrigation systems, particularly in specialty greenhouse plants production. Drip emitters, available in inline and online configurations, are essential components of these systems, ensuring precise water delivery directly to the plant roots. Technological advancements have led to the development of advanced emitters, capable of responding to soil moisture levels and optimizing water usage. However, challenges such as filtration and clogging issues persist, necessitating ongoing research and innovation from market leaders to ensure the continued reliability and effectiveness of drip emitters in modern agriculture.

Drip Emitters Market Size

 Request Free Sample

The drip emitters market is experiencing significant growth, driven by innovations such as Bayer's Defense Program and the integration of S5 Smart Spacing technology. These advancements enhance the efficiency of Heavywall Dripline systems, ensuring optimal water delivery. In sectors like agriculture, the use of nematodes in pest control complements drip irrigation systems, promoting healthier crops. Meanwhile, EPC and Microjet Irrigation Systems offer versatility for various outdoor environments. Companies like Covidien are pushing boundaries with products like Catalyft PL and PL40, enhancing graft delivery methods. The Space-D Access System and Accelerate Graft Delivery initiatives, including Grafton DBF, further demonstrate the market's commitment to sustainability and efficiency. As demand rises, the drip emitters market is poised for transformative growth.

Market Segmentation

The market research report provides comprehensive data (region-wise segment analysis), with forecasts and estimates in "USD million" for the period 2024-2028, as well as historical data from 2018-2022 for the following segments.

  • End-user
    • Agriculture
    • Others
  • Geography
    • North America
      • Canada
      • US
    • APAC
      • China
    • Europe
      • France
    • South America
    • Middle East and Africa

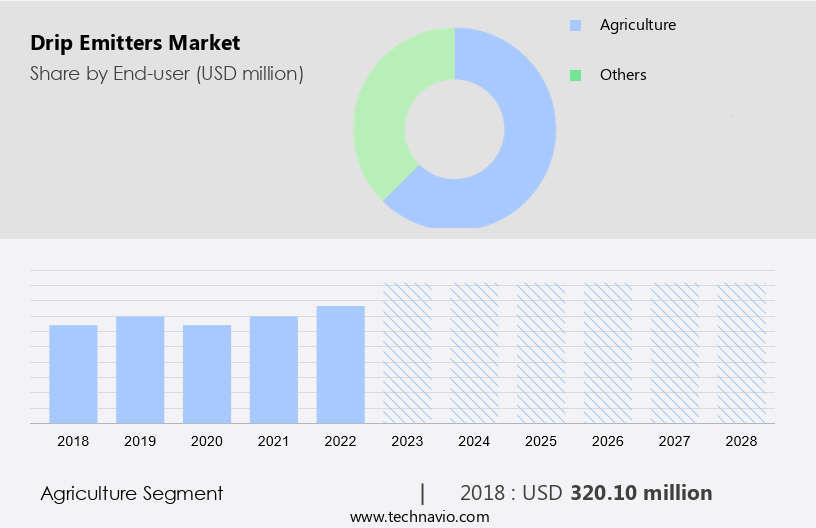
By End-user Insights

The agriculture segment is estimated to witness significant growth during the forecast period. Drip emitters are essential components of irrigation systems, widely used in agriculture to ensure efficient water usage in various crops. Two common types of drippers are on-line and in-line emitters. In-line drippers are popular in row and field crops, including maize, soybeans, wheat, and cotton. The global population growth necessitates an increase in food production, leading farmers to adopt advanced irrigation systems. Drip emitters, such as those manufactured by Rain Bird, enable farmers to control water usage and minimize water waste. In-line drippers are particularly effective in field crops, ensuring optimal water distribution and improving crop yields.

Drip Emitters Market Size

Get a glance at the market share of various segments Request Free Sample

The agriculture segment was valued at USD 320.10 million in 2018 and showed a gradual increase during the forecast period.

Regional Insights

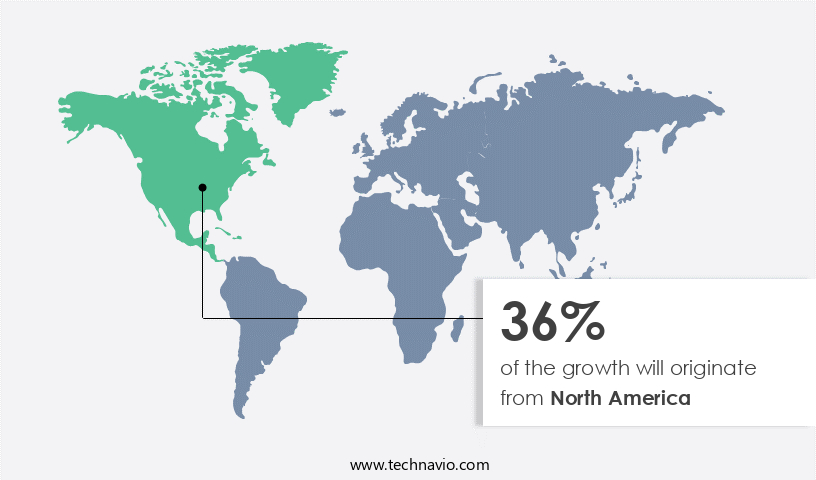
North America is estimated to contribute 36% to the growth of the global market during the forecast period. Technavio's analysts have elaborately explained the regional trends and drivers that shape the market during the forecast period.

Drip Emitters Market Share by Geography

For more insights on the market share of various regions Request Free Sample

The market is primarily driven by the extensive use of drip irrigation systems in agriculture, particularly in North America. Drip irrigation is an efficient water management technique, making it ideal for use in drought-prone areas and large farms, which are common in North America. According to the United States Department of Agriculture (USDA), agriculture is a significant consumer of water in the US, accounting for approximately 80% of the nation's consumptive water use. Farmers in North America, including those in the US and Canada, rely on water-efficient irrigation methods to maintain their crops, such as maize, soybeans, wheat, and cotton.

Moreover, leading irrigation system manufacturers, including Rain Bird, are capitalizing on this trend by offering advanced drip emitter technologies to enhance crop yields and reduce water wastage. Overall, the North American region is anticipated to dominate The market due to its large agricultural sector and the increasing adoption of water-efficient irrigation systems.

Our researchers analyzed the data with 2023 as the base year, along with the key drivers, trends, and challenges. A holistic analysis of drivers will help companies refine their marketing strategies to gain a competitive advantage.

Market Driver

Growing focus on efficient use of natural resources is the key driver of the market. In the agricultural sector, water scarcity has emerged as a significant challenge, particularly in regions experiencing drought, such as Europe. To address this issue, farmers are increasingly adopting water-efficient irrigation systems, with drip irrigation systems gaining popularity. Drip irrigation systems, offered by companies like Hunter Industries, ensure the optimal application of water to the soil, enhancing crop growth and yield. These systems are more water-efficient than traditional irrigation methods, with Rivulis' drip irrigation systems utilizing 85%-90% less water. Moreover, micro-irrigation systems, including drip emitters, enable precision agriculture by delivering water directly to the plant roots, reducing water loss through evaporation and runoff.

Moreover, greenhouse vegetable production also benefits significantly from drip irrigation systems, ensuring consistent water supply and optimal growing conditions.

Market Trends

The rising adoption of greenhouse agriculture is the upcoming trend in the market. The global market for drip emitters is experiencing significant growth due to the increasing adoption of agriculture methods that optimize water usage, particularly in greenhouse vegetable production. Companies like Hunter Industries are major players in this market, providing advanced micro-irrigation systems for farmers.

Moreover, with water scarcity becoming a pressing issue, precision agriculture through drip irrigation systems is gaining popularity. This trend is especially prominent in the expansion of greenhouse agriculture, as farmers seek to increase output and efficiency. Government initiatives in various countries are further promoting the use of greenhouse agriculture, leading to an increase in demand for drip irrigation systems and, consequently, The market.

Market Challenge

Filtration and clogging issues is a key challenge affecting the market growth. In the agricultural sector, the use of drip emitters in micro-irrigation systems has gained significant traction due to their efficiency in water usage and precision in delivering nutrients to plants. However, one challenge that farmers face is the clogging of emitters in drip irrigation lines. This issue can arise due to the presence of bacteria, sediments, and chemicals in the water supply, leading to poor water quality and ultimately affecting the performance of the system. The clogging can occur rapidly, particularly when the irrigation systems operate under inadequate pressure. To mitigate this problem, it is crucial for farmers to implement proper filtration and maintenance practices.

Furthermore, companies such as Hunter Industries offer advanced drip irrigation solutions that cater to the specific needs of greenhouse vegetable cultivation and address the challenges of water scarcity in agriculture. By prioritizing the maintenance of drip irrigation systems, farmers can ensure optimal crop yield and reduce water wastage.

Exclusive Customer Landscape

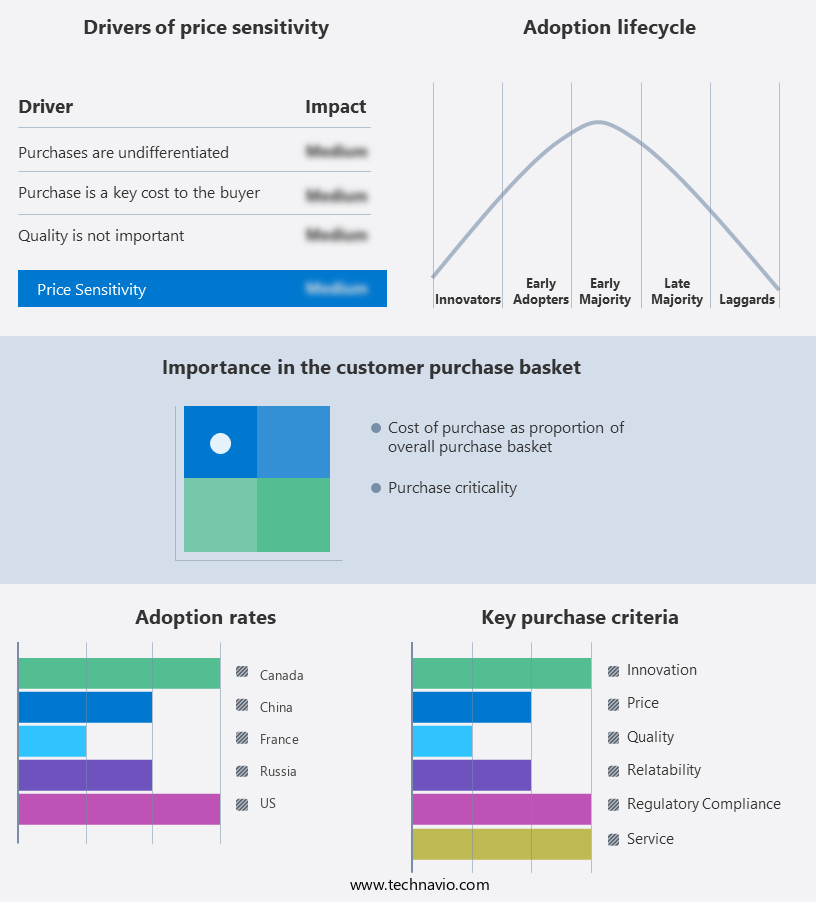
The market forecasting report includes the adoption lifecycle of the market, covering from the innovator's stage to the laggard's stage. It focuses on adoption rates in different regions based on penetration. Furthermore, the report also includes key purchase criteria and drivers of price sensitivity to help companies evaluate and develop their market growth analysis strategies.

Drip Emitters Market Share by Geography

 Customer Landscape

Key Companies & Market Insights

Companies are implementing various strategies, such as strategic alliances, partnerships, mergers and acquisitions, geographical expansion, and product/service launches, to enhance their presence in the market.

DripWorks Inc: The company offers drip emitters or emitters with basic and pressure compensating water drippers.

The market research and growth report includes detailed analyses of the competitive landscape of the market and information about key companies, including:

  • Chamartin Group
  • Chinadrip Irrigation Equipment Co. Ltd.
  • DIG Corp.
  • Elgo Irrigation Ltd.
  • Golden Key Middle East FZE
  • Hunter Industries Inc.
  • Irritec SpA
  • Jain Irrigation Systems Ltd.
  • KSNM DRIP
  • Lindsay Corp.
  • Mahindra and Mahindra Ltd.
  • NORMA Group SE
  • Orbia Advance Corp. S.A.B. de C.V.
  • Rain Bird Corp.
  • Rivulis Irrigation Ltd.
  • Sujay Irrigations Pvt. Ltd.
  • The Toro Co.
  • T.L. Irrigation Co

Qualitative and quantitative analysis of companies has been conducted to help clients understand the wider business environment as well as the strengths and weaknesses of key market players. Data is qualitatively analyzed to categorize companies as pure play, category-focused, industry-focused, and diversified; it is quantitatively analyzed to categorize companies as dominant, leading, strong, tentative, and weak.

Research Analyst Overview

The market is witnessing significant growth due to the increasing adoption of micro-irrigation systems in agriculture. Drip emitters are essential components of micro-irrigation systems, enabling precise water delivery directly to the plant root zone. In agriculture, drip emitters are widely used for growing greenhouse vegetables and field crops such as maize, soybeans, wheat, cotton, and others, especially in areas affected by water scarcity. Technological progress in precision agriculture, including sensors for soil moisture monitoring and automation, is driving the market. Drip emitters come in various types, including inline and online emitters, and are offered by major players.

Furthermore, end users in the market include farmers, plantation crops, and ranch yields. The market is also witnessing growth in the use of drip emitters in specialty greenhouse plants and outdoor environments for applications such as outdoor lighting and field crops. Water constraints and the need for efficient water usage are key factors driving the market.

Market Scope

Report Coverage

Details

Page number

135

Base year

2023

Historic period

2018-2022

Forecast period

2024-2028

Growth momentum & CAGR

Accelerate at a CAGR of 12.13%

Market growth 2024-2028

USD 444.4 million

Market structure

Fragmented

YoY growth 2023-2024(%)

10.94

Regional analysis

North America, APAC, Europe, South America, and Middle East and Africa

Performing market contribution

North America at 36%

Key countries

US, Canada, France, China, and Russia

Competitive landscape

Leading Companies, Market Positioning of Companies, Competitive Strategies, and Industry Risks

Key companies profiled

Chamartin Group, Chinadrip Irrigation Equipment Co. Ltd., DIG Corp., DripWorks Inc., Elgo Irrigation Ltd., Golden Key Middle East FZE, Hunter Industries Inc., Irritec SpA, Jain Irrigation Systems Ltd., KSNM DRIP, Lindsay Corp., Mahindra and Mahindra Ltd., NORMA Group SE, Orbia Advance Corp. S.A.B. de C.V., Rain Bird Corp., Rivulis Irrigation Ltd., Sujay Irrigations Pvt. Ltd., The Toro Co., and T.L. Irrigation Co

Market dynamics

Parent market analysis, market growth inducers and obstacles, market forecast, fast-growing and slow-growing segment analysis, COVID-19 impact and recovery analysis and future consumer dynamics, market condition analysis for the forecast period

Customization purview

If our market report has not included the data that you are looking for, you can reach out to our analysts and get segments customized.

Request Free Sample

What are the Key Data Covered in this Market Research and Growth Report?

  • CAGR of the market during the forecast period
  • Detailed information on factors that will drive the market growth and forecasting between 2024 and 2028
  • Precise estimation of the size of the market  and its contribution of the market in focus to the parent market
  • Accurate predictions about upcoming market growth and trends and changes in consumer behaviour
  • Growth of the market across North America, APAC, Europe, South America, and Middle East and Africa
  • Thorough analysis of the market's competitive landscape and detailed information about companies
  • Comprehensive analysis of factors that will challenge the growth of market companies

We can help! Our analysts can customize this market research report to meet your requirements. Get in touch

1 Executive Summary

  • 1.1 Market overview
    • Executive Summary - Chart on Market Overview
    • Executive Summary - Data Table on Market Overview
    • Executive Summary - Chart on Global Market Characteristics
    • Executive Summary - Chart on Market by Geography
    • Executive Summary - Chart on Market Segmentation by End-user
    • Executive Summary - Chart on Incremental Growth
    • Executive Summary - Data Table on Incremental Growth
    • Executive Summary - Chart on Company Market Positioning

2 Market Landscape

  • 2.1 Market ecosystem
    • Parent Market
    • Data Table on - Parent Market
  • 2.2 Market characteristics
    • Market characteristics analysis
  • 2.3 Value chain analysis
    • Value Chain Analysis

3 Market Sizing

  • 3.1 Market definition
    • Offerings of companies included in the market definition
  • 3.2 Market segment analysis
    • Market segments
  • 3.3 Market size 2023
    • 3.4 Market outlook: Forecast for 2023-2028
      • Chart on Global - Market size and forecast 2023-2028 ($ million)
      • Data Table on Global - Market size and forecast 2023-2028 ($ million)
      • Chart on Global Market: Year-over-year growth 2023-2028 (%)
      • Data Table on Global Market: Year-over-year growth 2023-2028 (%)

    4 Historic Market Size

    • 4.1 Global Drip Emitters Market 2018 - 2022
      • Historic Market Size - Data Table on Global Drip Emitters Market 2018 - 2022 ($ million)
    • 4.2 End-user segment analysis 2018 - 2022
      • Historic Market Size - End-user Segment 2018 - 2022 ($ million)
    • 4.3 Geography segment analysis 2018 - 2022
      • Historic Market Size - Geography Segment 2018 - 2022 ($ million)
    • 4.4 Country segment analysis 2018 - 2022
      • Historic Market Size - Country Segment 2018 - 2022 ($ million)

    5 Five Forces Analysis

    • 5.1 Five forces summary
      • Five forces analysis - Comparison between 2023 and 2028
    • 5.2 Bargaining power of buyers
      • Bargaining power of buyers - Impact of key factors 2023 and 2028
    • 5.3 Bargaining power of suppliers
      • Bargaining power of suppliers - Impact of key factors in 2023 and 2028
    • 5.4 Threat of new entrants
      • Threat of new entrants - Impact of key factors in 2023 and 2028
    • 5.5 Threat of substitutes
      • Threat of substitutes - Impact of key factors in 2023 and 2028
    • 5.6 Threat of rivalry
      • Threat of rivalry - Impact of key factors in 2023 and 2028
    • 5.7 Market condition
      • Chart on Market condition - Five forces 2023 and 2028

    6 Market Segmentation by End-user

    • 6.1 Market segments
      • Chart on End-user - Market share 2023-2028 (%)
      • Data Table on End-user - Market share 2023-2028 (%)
    • 6.2 Comparison by End-user
      • Chart on Comparison by End-user
      • Data Table on Comparison by End-user
    • 6.3 Agriculture - Market size and forecast 2023-2028
      • Chart on Agriculture - Market size and forecast 2023-2028 ($ million)
      • Data Table on Agriculture - Market size and forecast 2023-2028 ($ million)
      • Chart on Agriculture - Year-over-year growth 2023-2028 (%)
      • Data Table on Agriculture - Year-over-year growth 2023-2028 (%)
    • 6.4 Others - Market size and forecast 2023-2028
      • Chart on Others - Market size and forecast 2023-2028 ($ million)
      • Data Table on Others - Market size and forecast 2023-2028 ($ million)
      • Chart on Others - Year-over-year growth 2023-2028 (%)
      • Data Table on Others - Year-over-year growth 2023-2028 (%)
    • 6.5 Market opportunity by End-user
      • Market opportunity by End-user ($ million)
      • Data Table on Market opportunity by End-user ($ million)

    7 Customer Landscape

    • 7.1 Customer landscape overview
      • Analysis of price sensitivity, lifecycle, customer purchase basket, adoption rates, and purchase criteria

    8 Geographic Landscape

    • 8.1 Geographic segmentation
      • Chart on Market share by geography 2023-2028 (%)
      • Data Table on Market share by geography 2023-2028 (%)
    • 8.2 Geographic comparison
      • Chart on Geographic comparison
      • Data Table on Geographic comparison
    • 8.3 North America - Market size and forecast 2023-2028
      • Chart on North America - Market size and forecast 2023-2028 ($ million)
      • Data Table on North America - Market size and forecast 2023-2028 ($ million)
      • Chart on North America - Year-over-year growth 2023-2028 (%)
      • Data Table on North America - Year-over-year growth 2023-2028 (%)
    • 8.4 APAC - Market size and forecast 2023-2028
      • Chart on APAC - Market size and forecast 2023-2028 ($ million)
      • Data Table on APAC - Market size and forecast 2023-2028 ($ million)
      • Chart on APAC - Year-over-year growth 2023-2028 (%)
      • Data Table on APAC - Year-over-year growth 2023-2028 (%)
    • 8.5 Europe - Market size and forecast 2023-2028
      • Chart on Europe - Market size and forecast 2023-2028 ($ million)
      • Data Table on Europe - Market size and forecast 2023-2028 ($ million)
      • Chart on Europe - Year-over-year growth 2023-2028 (%)
      • Data Table on Europe - Year-over-year growth 2023-2028 (%)
    • 8.6 South America - Market size and forecast 2023-2028
      • Chart on South America - Market size and forecast 2023-2028 ($ million)
      • Data Table on South America - Market size and forecast 2023-2028 ($ million)
      • Chart on South America - Year-over-year growth 2023-2028 (%)
      • Data Table on South America - Year-over-year growth 2023-2028 (%)
    • 8.7 Middle East and Africa - Market size and forecast 2023-2028
      • Chart on Middle East and Africa - Market size and forecast 2023-2028 ($ million)
      • Data Table on Middle East and Africa - Market size and forecast 2023-2028 ($ million)
      • Chart on Middle East and Africa - Year-over-year growth 2023-2028 (%)
      • Data Table on Middle East and Africa - Year-over-year growth 2023-2028 (%)
    • 8.8 US - Market size and forecast 2023-2028
      • Chart on US - Market size and forecast 2023-2028 ($ million)
      • Data Table on US - Market size and forecast 2023-2028 ($ million)
      • Chart on US - Year-over-year growth 2023-2028 (%)
      • Data Table on US - Year-over-year growth 2023-2028 (%)
    • 8.9 Canada - Market size and forecast 2023-2028
      • Chart on Canada - Market size and forecast 2023-2028 ($ million)
      • Data Table on Canada - Market size and forecast 2023-2028 ($ million)
      • Chart on Canada - Year-over-year growth 2023-2028 (%)
      • Data Table on Canada - Year-over-year growth 2023-2028 (%)
    • 8.10 France - Market size and forecast 2023-2028
      • Chart on France - Market size and forecast 2023-2028 ($ million)
      • Data Table on France - Market size and forecast 2023-2028 ($ million)
      • Chart on France - Year-over-year growth 2023-2028 (%)
      • Data Table on France - Year-over-year growth 2023-2028 (%)
    • 8.11 China - Market size and forecast 2023-2028
      • Chart on China - Market size and forecast 2023-2028 ($ million)
      • Data Table on China - Market size and forecast 2023-2028 ($ million)
      • Chart on China - Year-over-year growth 2023-2028 (%)
      • Data Table on China - Year-over-year growth 2023-2028 (%)
    • 8.12 Russia - Market size and forecast 2023-2028
      • Chart on Russia - Market size and forecast 2023-2028 ($ million)
      • Data Table on Russia - Market size and forecast 2023-2028 ($ million)
      • Chart on Russia - Year-over-year growth 2023-2028 (%)
      • Data Table on Russia - Year-over-year growth 2023-2028 (%)
    • 8.13 Market opportunity by geography
      • Market opportunity by geography ($ million)
      • Data Tables on Market opportunity by geography ($ million)

    9 Drivers, Challenges, and Opportunity/Restraints

    • 9.1 Market drivers
      • 9.2 Market challenges
        • 9.3 Impact of drivers and challenges
          • Impact of drivers and challenges in 2023 and 2028
        • 9.4 Market opportunities/restraints

          10 Competitive Landscape

          • 10.1 Overview
            • 10.2 Competitive Landscape
              • Overview on criticality of inputs and factors of differentiation
            • 10.3 Landscape disruption
              • Overview on factors of disruption
            • 10.4 Industry risks
              • Impact of key risks on business

            11 Competitive Analysis

            • 11.1 Companies profiled
              • Companies covered
            • 11.2 Market positioning of companies
              • Matrix on companies position and classification
            • 11.3 DripWorks Inc.
              • DripWorks Inc. - Overview
              • DripWorks Inc. - Product / Service
              • DripWorks Inc. - Key offerings
            • 11.4 Golden Key Middle East FZE
              • Golden Key Middle East FZE - Overview
              • Golden Key Middle East FZE - Product / Service
              • Golden Key Middle East FZE - Key offerings
            • 11.5 Hunter Industries Inc
              • Hunter Industries Inc - Overview
              • Hunter Industries Inc - Product / Service
              • Hunter Industries Inc - Key offerings
            • 11.6 Irritec SpA
              • Irritec SpA - Overview
              • Irritec SpA - Product / Service
              • Irritec SpA - Key offerings
            • 11.7 Jain Irrigation Systems Ltd.
              • Jain Irrigation Systems Ltd. - Overview
              • Jain Irrigation Systems Ltd. - Business segments
              • Jain Irrigation Systems Ltd. - Key offerings
              • Jain Irrigation Systems Ltd. - Segment focus
            • 11.8 KSNM DRIP
              • KSNM DRIP - Overview
              • KSNM DRIP - Product / Service
              • KSNM DRIP - Key offerings
            • 11.9 Lindsay Corp.
              • Lindsay Corp. - Overview
              • Lindsay Corp. - Business segments
              • Lindsay Corp. - Key news
              • Lindsay Corp. - Key offerings
              • Lindsay Corp. - Segment focus
            • 11.10 Orbia Advance Corp. SAB de CV
              • Orbia Advance Corp. SAB de CV - Overview
              • Orbia Advance Corp. SAB de CV - Business segments
              • Orbia Advance Corp. SAB de CV - Key offerings
              • Orbia Advance Corp. SAB de CV - Segment focus
            • 11.11 Rivulis Irrigation Ltd.
              • Rivulis Irrigation Ltd. - Overview
              • Rivulis Irrigation Ltd. - Product / Service
              • Rivulis Irrigation Ltd. - Key offerings
            • 11.12 The Toro Co.
              • The Toro Co. - Overview
              • The Toro Co. - Business segments
              • The Toro Co. - Key news
              • The Toro Co. - Key offerings
              • The Toro Co. - Segment focus

            12 Appendix

            • 12.1 Scope of the report
              • 12.2 Inclusions and exclusions checklist
                • Inclusions checklist
                • Exclusions checklist
              • 12.3 Currency conversion rates for US$
                • Currency conversion rates for US$
              • 12.4 Research methodology
                • Research methodology
              • 12.5 Data procurement
                • Information sources
              • 12.6 Data validation
                • Data validation
              • 12.7 Validation techniques employed for market sizing
                • Validation techniques employed for market sizing
              • 12.8 Data synthesis
                • Data synthesis
              • 12.9 360 degree market analysis
                • 360 degree market analysis
              • 12.10 List of abbreviations
                • List of abbreviations

              Research Methodology

              Technavio presents a detailed picture of the market by way of study, synthesis, and summation of data from multiple sources. The analysts have presented the various facets of the market with a particular focus on identifying the key industry influencers. The data thus presented is comprehensive, reliable, and the result of extensive research, both primary and secondary.

              INFORMATION SOURCES

              Primary sources

              • Manufacturers and suppliers
              • Channel partners
              • Industry experts
              • Strategic decision makers

              Secondary sources

              • Industry journals and periodicals
              • Government data
              • Financial reports of key industry players
              • Historical data
              • Press releases

              DATA ANALYSIS

              Data Synthesis

              • Collation of data
              • Estimation of key figures
              • Analysis of derived insights

              Data Validation

              • Triangulation with data models
              • Reference against proprietary databases
              • Corroboration with industry experts

              REPORT WRITING

              Qualitative

              • Market drivers
              • Market challenges
              • Market trends
              • Five forces analysis

              Quantitative

              • Market size and forecast
              • Market segmentation
              • Geographical insights
              • Competitive landscape

              Interested in this report?

              Get your sample now to see our research methodology and insights!

              Download Now

              Frequently Asked Questions

              Drip Emitters market growth will increase by $ 444.4 mn during 2024-2028.

              The Drip Emitters market is expected to grow at a CAGR of 12.13% during 2024-2028.

              Drip Emitters market is segmented by End-user( Agriculture, Others)

              Chamartin Group, Chinadrip Irrigation Equipment Co. Ltd., DIG Corp., DripWorks Inc., Elgo Irrigation Ltd., Golden Key Middle East FZE, Hunter Industries Inc., Irritec SpA, Jain Irrigation Systems Ltd., KSNM DRIP, Lindsay Corp., Mahindra and Mahindra Ltd., NORMA Group SE, Orbia Advance Corp. S.A.B. de C.V., Rain Bird Corp., Rivulis Irrigation Ltd., Sujay Irrigations Pvt. Ltd., The Toro Co., T.L. Irrigation Co are a few of the key vendors in the Drip Emitters market.

              North America will register the highest growth rate of 36% among the other regions. Therefore, the Drip Emitters market in North America is expected to garner significant business opportunities for the vendors during the forecast period.

              US, Canada, France, China, Russia

              • Growing focus on efficient use of natural resourcesWater is an essential requirement for agriculture. Most of the water used for irrigation comes from natural resources. The agriculture sector in some regions is the driving factor this market.
              • including Europe is the driving factor this market.
              • is affected by drought and water scarcity. End-users are increasingly using water-efficient irrigation systems such as drip irrigation systems. The benefits of drip irrigation systems can also be seen throughout the growing cycle of crops. Drip irrigation systems ensure the proper application of water to the soil for germination. They help optimize the air and water balance in the soil to maintain better soil conditions for root development. For instance is the driving factor this market.
              • Rivulis offers drip irrigation systems that are 85%-90% more efficient in water utilization than traditional irrigation methods. Therefore is the driving factor this market.
              • drip emitters can reduce water loss during irrigation and help cover more areas of the field with less water. Drip emitters in drip irrigation systems ensure the delivery of water at the desired discharge rate. Hence is the driving factor this market.
              • the water-saving benefits offered by drip emitters in drip irrigation systems help end-users conserve water and ensure the efficient use of natural resources. Such factors are anticipated to drive the demand for drip emitters is the driving factor this market.
              • which will boost the growth of the market in focus during the forecast period.   is the driving factor this market.

              The Drip Emitters market vendors should focus on grabbing business opportunities from the Agriculture segment as it accounted for the largest market share in the base year.