E-Performance Bike Market Size 2024-2028
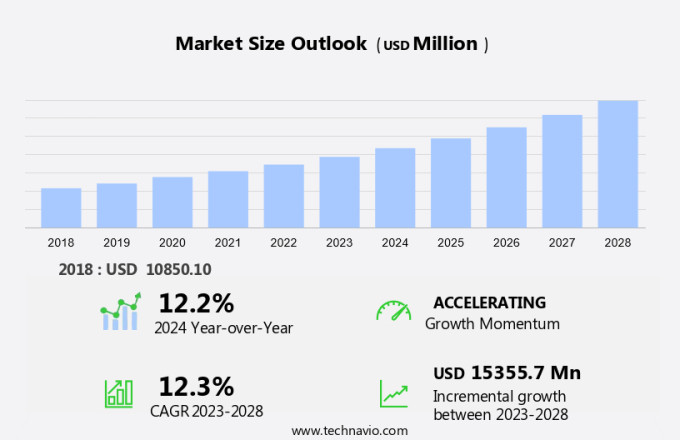
The e-performance bike market size is forecast to increase by USD 15.36 billion at a CAGR of 12.3% between 2023 and 2028.
- The market is experiencing significant growth due to the increasing demand for sustainable and efficient urban mobility solutions. BRTS systems and public transit systems are integrating micromobility options, such as e-performance bikes, to enhance the overall transportation experience. companies are launching innovative e-performance bikes with advanced technologies like hub motor drives and mid-drive motors to cater to diverse consumer preferences.
- However, the high initial cost and maintenance requirements remain challenges for market growth. In the electric market, e-performance bikes, including electric mountain bikes, are gaining popularity due to their superior performance and eco-friendliness. Companies are investing in research and development to offer more affordable and efficient options to meet the evolving consumer needs.This market analysis report provides a comprehensive study of the market trends, growth drivers, challenges, and future opportunities in the market.
What will be the Size of the Market During the Forecast Period?
- The electric bike market in North America is experiencing significant growth, driven by advanced technologies and the increasing demand for sustainable transportation solutions. E-performance bikes, equipped with features such as sim modules, cloud connectivity, remote diagnostics, integrated navigation, anti-theft systems, and social media connectivity, are revolutionizing urban mobility. Connected e-bikes are gaining popularity as they offer real-time data on bike performance, maintenance needs, and location. Cloud connectivity enables users to access this information remotely, ensuring optimal bike usage and convenience. Remote diagnostics help identify and resolve issues before they become major problems, reducing downtime and maintenance costs.
- Integrated navigation systems provide turn-by-turn directions, making commuting more efficient, especially in urban areas with heavy traffic congestion. Anti-theft systems offer peace of mind, while social media connectivity allows users to share their cycling experiences with friends and family. E-performance bikes are also being integrated with public transport systems, offering affordable transport alternatives and reducing reliance on cars. High-speed intracity transportation solutions, such as metros and BRT systems, are increasingly incorporating e-bikes as the first and last-mile connectivity options. Electric mountain bikes and recreational bicycling are also benefiting from the advancements in e-bike technology. Pedal-assist e-bikes provide an extra boost when needed, making it easier to climb hills and cover longer distances.
How is this market segmented and which is the largest segment?
The market research report provides comprehensive data (region-wise segment analysis), with forecasts and estimates in "USD million" for the period 2024-2028, as well as historical data from 2018-2022 for the following segments.
- Type
- Mountain electric bikes
- Trekking electric bikes
- Gravel electric bikes
- Others
- Battery Type
- Lithium-ion batteries
- Lead-acid batteries
- Solid-state batteries
- Others
- Geography
- Europe
- Germany
- UK
- France
- Italy
- North America
- Canada
- US
- APAC
- China
- South America
- Brazil
- Middle East and Africa
- Europe
By Type Insights
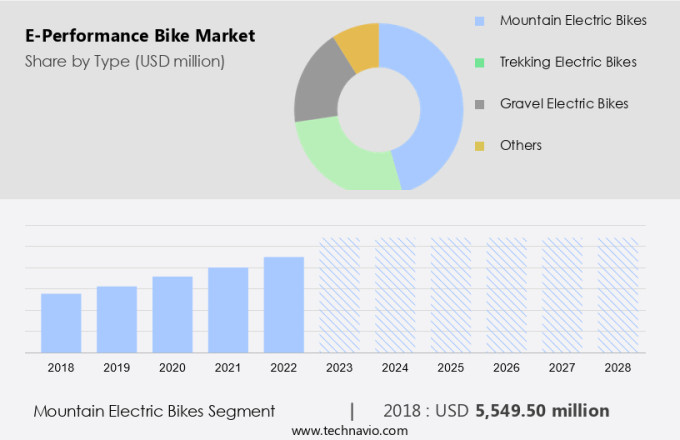
- The mountain electric bikes segment is estimated to witness significant growth during the forecast period.
The market for e-performance bikes in the United States features a substantial category for cargo e-bikes, also known as electric utility bikes. These bikes combine the functionality of traditional cargo bikes with advanced electric technology, catering to the growing demand for sustainable transportation solutions. Cargo e-bikes are increasingly popular among businesses and individuals for e-commerce and delivery services, as they offer a more efficient and eco-friendly alternative to gas-powered vehicles. E-bike manufacturers are continuously innovating to address health concerns by producing bikes that offer a seamless blend of electric assistance and physical activity. Regulations regarding e-bikes vary by state, with some allowing Class 3 e-bikes that can reach higher speeds, making them ideal for longer commutes and recreational bicycling.
E-commerce and delivery services have significantly contributed to the growth of the electric bike market in the US. Companies are investing in electric bikes to improve their last-mile delivery capabilities, reducing carbon emissions and enhancing their brand image as environmentally conscious organizations. Additionally, the recreational market for e-bikes is expanding, as more consumers discover the convenience and fun of electric bikes for trail riding and leisurely rides around the city. In conclusion, the electric bike market in the United States is witnessing steady growth, driven by the increasing popularity of cargo e-bikes for e-commerce and delivery services, as well as the expanding recreational market. E-bike manufacturers are addressing health concerns and regulatory requirements while continuously innovating to offer high-performance, lightweight, and durable bikes that cater to various riding styles and preferences.
Get a glance at the market report of share of various segments Request Free Sample
The Mountain electric bikes segment was valued at USD 5549.50 million in 2018 and showed a gradual increase during the forecast period.
Regional Analysis
- Europe is estimated to contribute 43% to the growth of the global market during the forecast period.
Technavio's analysts have elaborately explained the regional trends and drivers that shape the market during the forecast period.
For more insights on the market share of various regions Request Free Sample
The European market for e-performance bikes is witnessing substantial growth due to the rise in disposable income and strategic investments from industry leaders. In 2023, the average disposable income in Germany amounted to USD38,971 per person, while in France, it reached USD34,375 per capita for households, and in Italy, it was USD29,431. These income levels are boosting consumer purchasing power, making high-end e-performance bikes more attainable to a wider demographic. Advanced features and superior performance are driving the demand for these premium bikes. Connected e-bikes are gaining popularity in Europe, with SIM modules and cloud connectivity enabling remote diagnostics, integrated navigation, and social media connectivity.
These features enhance the user experience and provide added convenience. Furthermore, anti-theft systems are becoming increasingly important to consumers, ensuring peace of mind and security for their investments. The integration of technology into e-bikes is transforming the market and catering to the evolving needs of consumers.
Market Dynamics
Our researchers analyzed the data with 2023 as the base year, along with the key drivers, trends, and challenges. A holistic analysis of drivers will help companies refine their marketing strategies to gain a competitive advantage. Throttle-controlled e-bikes offer a more traditional motorbike-like riding experience. The electric bike market is driven by the growing demand for electric mobility solutions, with lithium-ion batteries offering longer e-bike battery life and faster charging times than lead-acid batteries. Hub motor drives and mid-drive motors provide efficient propulsion, ensuring a smooth riding experience. Micromobility solutions, including e-scooters and e-bikes, are transforming the transportation ecosystem. These solutions offer a sustainable, cost-effective, and flexible alternative to traditional transportation methods, making them an attractive option for both individuals and businesses. In conclusion, the market in North America is experiencing significant growth, driven by advanced technologies and the increasing demand for sustainable transportation solutions. Connected features, such as remote diagnostics, integrated navigation, and social media connectivity, are enhancing the user experience and making e-bikes an attractive alternative to cars and public transport. The integration of e-bikes with public transport systems and micromobility solutions is further expanding their reach and appeal.
What are the key market drivers leading to the rise in adoption of E-Performance Bike Market ?
Rise in disposable income is the key driver of the market.
- The market in the US is experiencing growth due to the rising disposable income of consumers. This increase in income enables more individuals to invest in high-end transportation alternatives, such as e-performance bikes, as an affordable solution to traffic congestion and public transport limitations. Two significant economies, Brazil and China, have reported increases in disposable income. In Brazil, the average monthly income for employed individuals aged 14 and above was USD548 in 2023, representing a 7.2% increase from USD511 in 2022 and a 1.8% rise from USD538 in 2019. China's disposable personal income reached approximately USD7,390 in 2023, up from USD7,028 in 2022.
- These income growths indicate a stronger economic environment, allowing more consumers to afford premium e-performance bikes. E-performance bikes offer health benefits, with pedal-assisted and throttle-assisted options available. The battery technology, primarily lead-acid batteries, powers these e-bikes, ensuring a reliable and efficient riding experience. As consumers seek affordable and efficient transportation solutions, the market is poised for continued growth.
What are the market trends shaping the E-Performance Bike Market?
Launch of new e-performance bikes by market vendors is the upcoming trend in the market.
- The market in the United States is experiencing notable expansion due to the increasing demand for sustainable urban mobility solutions. Advanced technology and superior performance features are at the forefront of new e-bike releases, catering to consumer preferences for extended battery life, superior range, and superior handling. A significant trend in the industry is the focus on lightweight designs, achieved through the use of high-strength materials like carbon fiber and aluminum alloys. BRTS systems and public transit systems are integrating e-performance bikes as micromobility solutions, further fueling market growth. Hub motor drives and mid-drive motors are popular powertrain options, providing optimal efficiency and torque.
- The electric mountain bike segment is also gaining traction, offering off-road capabilities for adventure-seeking riders. Manufacturers are continually innovating to meet the evolving needs of consumers and stay competitive in the market. As the demand for e-performance bikes continues to rise, it is essential for businesses to stay informed about market trends and consumer preferences to capitalize on opportunities.
What challenges does E-Performance Bike Market face during the growth?
High initial cost and maintenance is a key challenge affecting the market growth.
- The market in the United States is experiencing growth due to the increasing popularity of electric bikes for various applications, including trekking, cargo transport, performance-based adventure, and recreational activities. These bikes utilize advanced technology, such as Lithium-ion batteries and high-power output electric motors, making them suitable for high-speed intracity transportation and metros. However, the high cost of these bikes remains a significant challenge. The inclusion of sophisticated components, such as powerful electric motors, advanced battery systems, and integrated smart technologies, significantly contributes to the elevated price point.
Exclusive Customer Landscape
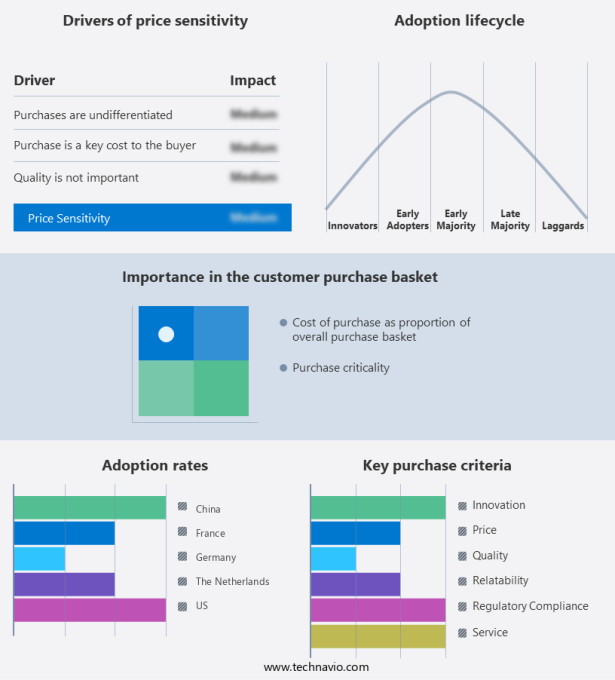
The market forecasting report includes the adoption lifecycle of the market, covering from the innovator's stage to the laggard's stage. It focuses on adoption rates in different regions based on penetration. Furthermore, the market report also includes key purchase criteria and drivers of price sensitivity to help companies evaluate and develop their market growth analysis strategies.
Customer Landscape
Key Companies & Market Insights
Companies are implementing various strategies, such as strategic alliances, market forecast , partnerships, mergers and acquisitions, geographical expansion, and product/service launches, to enhance their presence in the market.
Accell Group NV - This business specializes in e-performance bikes, equipped with a protective skid plate and a full-color display for enhanced rider experience and efficient navigation.
The market research and growth report includes detailed analyses of the competitive landscape of the market and information about key companies, including:
- Accell Group NV
- Canyon Bicycles GmbH
- Cycling Sports Group Inc.
- Giant Manufacturing Co. Ltd.
- Kalkhoff Werke GmbH
- Merida Industry Co. Ltd.
- Panasonic Holdings Corp.
- Pedego Electric Bikes
- Rad Power Bikes
- Riese and Muller GmbH
- Robert Bosch GmbH
- Samchully Co. Ltd
- SHIMANO Inc
- Trek Bicycle Corp.
- Yamaha Motor Corp.
- Zhejiang Luyuan Electric Vehicle Co. Ltd.
Qualitative and quantitative analysis of companies has been conducted to help clients understand the wider business environment as well as the strengths and weaknesses of key market players. Data is qualitatively analyzed to categorize companies as pure play, category-focused, industry-focused, and diversified; it is quantitatively analyzed to categorize companies as dominant, leading, strong, tentative, and weak.
Research Analyst Overview
The e-bike market is witnessing significant growth due to the increasing demand for affordable and efficient transportation solutions in urban areas. Connected e-bikes, equipped with sim modules and cloud connectivity, offer remote diagnostics, integrated navigation, anti-theft systems, and social media connectivity, making them an attractive option for consumers. E-bikes cater to various segments such as trekking, cargo, performance-based adventure, recreational activities, and high-speed intracity transportation. Battery technology plays a crucial role in the e-bike market, with both lead-acid and lithium-ion batteries being used. Lead-acid batteries offer affordability, while lithium-ion batteries provide higher power output and longer battery life. Pedal-assisted e-bikes and throttle-assisted e-bikes cater to different consumer preferences.
E-bikes are increasingly being used as alternatives to public transport, especially in metros and BRTS systems, due to their ability to navigate through traffic congestion. The electric market includes various players, from e-bike manufacturers to delivery services and e-commerce platforms. Health concerns and regulations are key factors influencing the market's growth. E-bikes offer numerous benefits, including reduced carbon footprint, improved health through regular physical activity, and cost savings compared to traditional vehicles. The transportation ecosystem is evolving, with the integration of propulsion systems, mid-drive motors, and battery technology. The market also includes electric mountain bikes, cargo e-bikes, and micromobility solutions.
Smart connectivity features such as GPS tracking, mobile app integration, and social media connectivity are becoming increasingly popular. E-bikes are also being used for last-mile delivery services and shared micro-mobility solutions. The future of electric mobility looks promising, with advancements in technology and increasing consumer acceptance.
|
Market Scope |
|
|
Report Coverage |
Details |
|
Page number |
207 |
|
Base year |
2023 |
|
Historic period |
2018-2022 |
|
Forecast period |
2024-2028 |
|
Growth momentum & CAGR |
Accelerate at a CAGR of 12.3% |
|
Market growth 2024-2028 |
USD 15355.7 million |
|
Market structure |
Fragmented |
|
YoY growth 2023-2024(%) |
12.2 |
|
Key countries |
Germany, US, The Netherlands, China, France, Canada, Italy, Brazil, Brazil, and UK |
|
Competitive landscape |
Leading Companies, Market Positioning of Companies, Competitive Strategies, and Industry Risks |
What are the Key Data Covered in this Market Research and Growth Report?
- CAGR of the market during the forecast period
- Detailed information on factors that will drive the market growth and forecasting between 2024 and 2028
- Precise estimation of the size of the market and its contribution of the market in focus to the parent market
- Accurate predictions about upcoming market growth and trends and changes in consumer behaviour
- Growth of the market across Europe, North America, APAC, South America, and Middle East and Africa
- Thorough analysis of the market's competitive landscape and detailed information about companies
- Comprehensive analysis of factors that will challenge the growth of market companies
We can help! Our analysts can customize this market research report to meet your requirements. Get in touch


