
Efuse Market Size 2025-2029
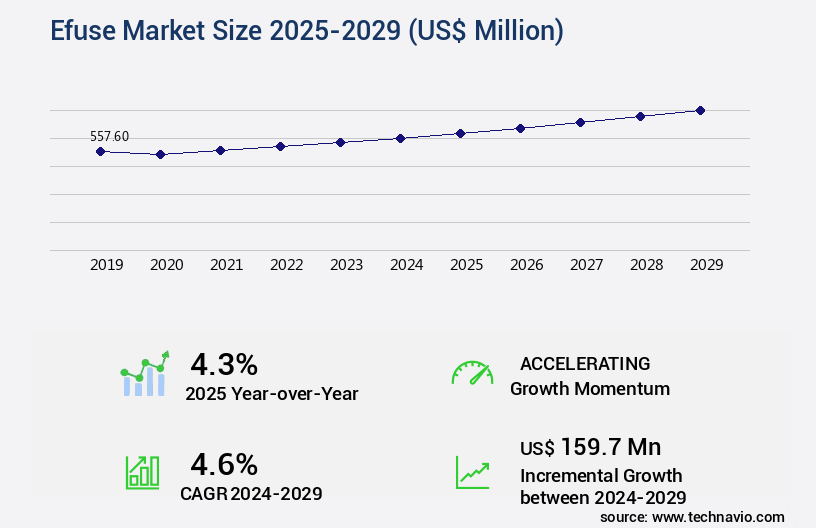
The efuse market size is valued to increase by USD 159.7 million, at a CAGR of 4.6% from 2024 to 2029. Growth in consumer electronics and wearables will drive the efuse market.
Major Market Trends & Insights
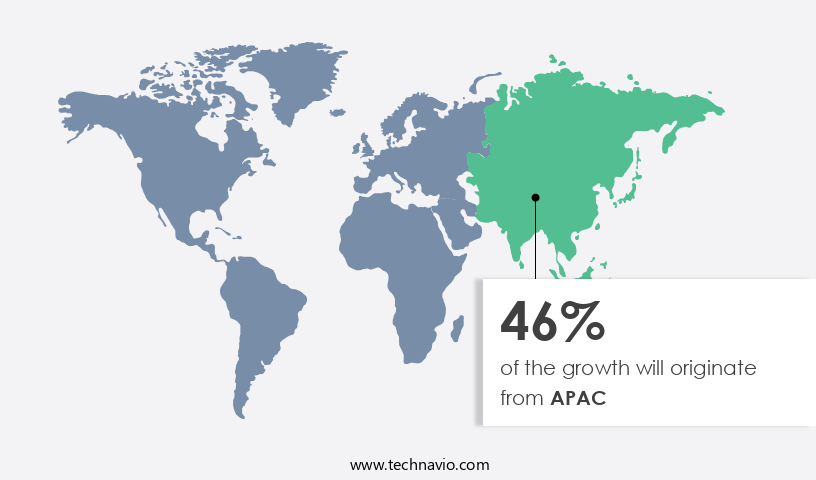
- APAC dominated the market and accounted for a 46% growth during the forecast period.
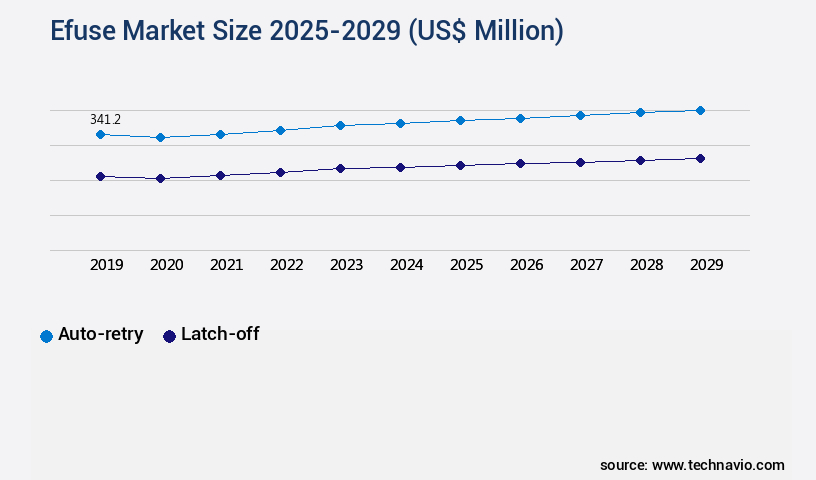
- By Type - Auto-retry segment was valued at USD 341.20 million in 2023
- By Application - Solid-state drives segment accounted for the largest market revenue share in 2023
Market Size & Forecast
- Market Opportunities: USD 41.68 million
- Market Future Opportunities: USD 159.70 million
- CAGR from 2024 to 2029 : 4.6%
Market Summary
- The market is a dynamic and evolving sector that plays a crucial role in facilitating the seamless integration of various technologies and systems in diverse industries. This market is driven by the increasing adoption of advanced technologies in sectors such as consumer electronics and wearables, where real-time data processing and communication are essential. The introduction of new products and solutions is a significant trend in this market, as businesses seek to enhance operational efficiency and stay competitive. One of the primary challenges facing the market is regulatory compliance. With the increasing number of regulations and standards, businesses must ensure that their systems and processes safety adhere to these requirements to avoid penalties and reputational damage.
- For instance, a manufacturing company may invest in an Efuse solution to optimize its supply chain and improve compliance with industry regulations, resulting in reduced lead times and increased customer satisfaction. According to recent studies, implementing an Efuse solution can lead to substantial improvements in business outcomes. For example, one company reported a 15% reduction in error rates, leading to significant cost savings and increased operational efficiency. This demonstrates the potential of Efuse solutions to deliver measurable business benefits and drive growth in various industries.
What will be the Size of the Efuse Market during the forecast period?
Get Key Insights on Market Forecast (PDF) Request Free Sample
How is the Efuse Market Segmented ?
The efuse industry research report provides comprehensive data (region-wise segment analysis), with forecasts and estimates in "USD million" for the period 2025-2029, as well as historical data from 2019-2023 for the following segments.
- Type
- Auto-retry
- Latch-off
- Application
- Solid-state drives
- Servers and data center equipment
- Automotive electronics
- Hard disk drives
- Others
- End-user
- Automotive and transportation
- IT and telecommunication
- Consumer electronics
- Aerospace and defense
- Others
- Geography
- North America
- US
- Canada
- Europe
- France
- Germany
- UK
- APAC
- China
- India
- Japan
- South Korea
- South America
- Brazil
- Rest of World (ROW)
- North America
By Type Insights
The auto-retry segment is estimated to witness significant growth during the forecast period.
The rhizosphere microbiome plays a crucial role in soil health indicators, influencing water use efficiency, crop quality parameters, and root development stimulants. Soil fertility management relies on phosphorus solubilizing microbes, plant hormone modulation, enzyme activity assays, and humic acid fertilizers to optimize environmental monitoring and mycorrhizal fungi application. Abiotic stress mitigation strategies involve beneficial microbial consortia, plant growth regulators, and biofertilizer application methods, including nitrogen fixation bacteria and organic matter improvement. Sustainable agriculture practices emphasize nutrient uptake efficiency, plant biomass assessment, and sustainable yield enhancement strategies. Precision farming techniques, such as microbial community analysis and microbial inoculants, contribute to disease resistance induction and integrated pest management.
Auto-retry eFuses, a key component in agricultural technology, enhance operational continuity by automatically resetting after fault conditions, reducing system downtime and improving overall efficiency. For instance, in precision farming, these devices ensure uninterrupted data collection and analysis, contributing to enhanced nutrient availability and crop productivity metrics.
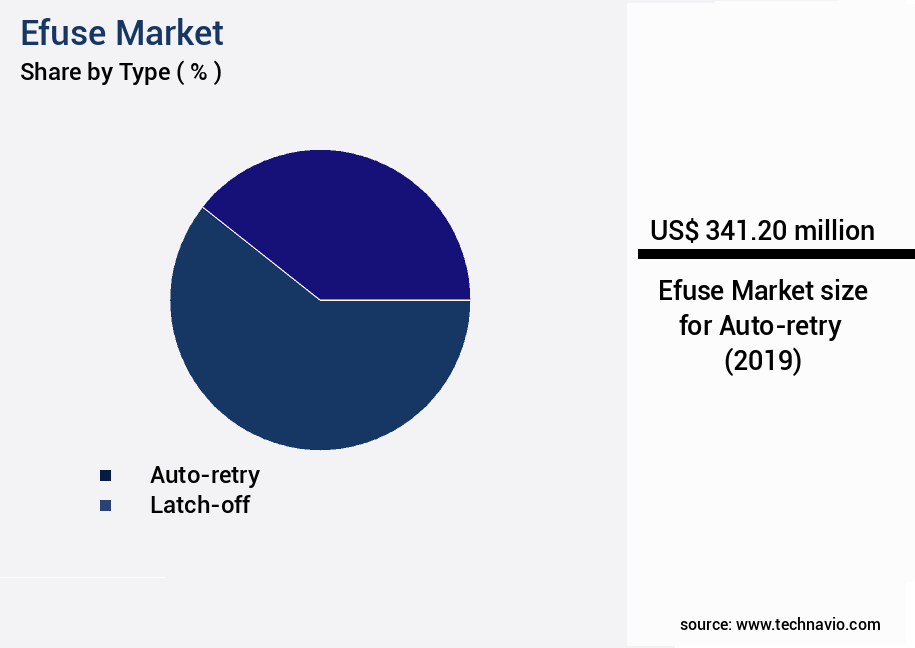
The Auto-retry segment was valued at USD 341.20 million in 2019 and showed a gradual increase during the forecast period.
Regional Analysis
APAC is estimated to contribute 46% to the growth of the global market during the forecast period.Technavio's analysts have elaborately explained the regional trends and drivers that shape the market during the forecast period.
See How Efuse Market Demand is Rising in APAC Request Free Sample
The market in the Asia-Pacific (APAC) region is experiencing significant growth, driven by the confluence of industrial, technological, and policy developments in key economies. In China, a 5.8% year-on-year increase in industrial production in 2024 underscores the strong momentum in manufacturing and infrastructure sectors, fueling demand for advanced circuit protection solutions like eFuses. These components ensure operational safety and reliability in various applications, including telecommunications, consumer electronics, and industrial automation. Moreover, China's leading position in the global electric vehicle (EV) industry, accounting for over 70% of global production and 80% of domestic sales in 2024, further accelerates the demand for eFuses.
These critical components are essential for battery protection and power management in EVs, contributing to operational efficiency gains and cost reductions. The market's growth in APAC is expected to continue, as industries increasingly prioritize safety, reliability, and efficiency in their operations.
Market Dynamics
Our researchers analyzed the data with 2024 as the base year, along with the key drivers, trends, and challenges. A holistic analysis of drivers will help companies refine their marketing strategies to gain a competitive advantage.
The market is experiencing significant growth due to the increasing recognition of the role of rhizosphere microbiome composition in enhancing agricultural productivity. The efficacy of plant growth promoting rhizobacteria (PGPR) and mycorrhizal fungi (MF) colonization in improving nutrient availability and plant stress tolerance mechanisms is well-documented. PGPR, through nitrogen fixation rates in legumes, and MF, by increasing phosphorus solubilization efficiency, play a crucial role in optimizing nutrient use efficiency in various crops. Moreover, humic acid effects on nutrient uptake and soil organic matter content improvement contribute to the market's expansion. These factors collectively help in enhancing water use efficiency under drought conditions, leading to improved crop yield response to biofertilizers. Biological pest control effectiveness and disease resistance in crops are other significant benefits offered by the market. The market's potential is further amplified by enzyme activity changes in soil, which promote sustainable farming practices adoption, such as climate-smart agriculture technologies and integrated pest management strategies. Precision agriculture application methods ensure optimal utilization of these eFuse solutions, providing farmers with customized nutrient management plans and reducing the environmental impact of traditional fertilizers. As the world population continues to grow, the need for sustainable and efficient agricultural practices becomes increasingly important, making the market an attractive investment opportunity.
What are the key market drivers leading to the rise in the adoption of Efuse Industry?
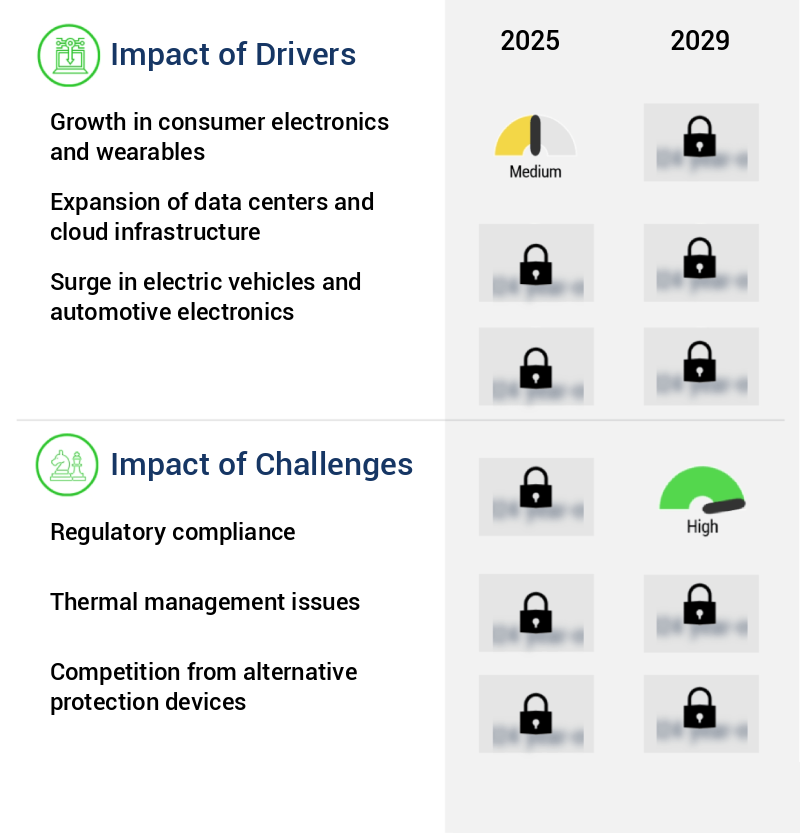
- Consumer electronics and wearables, characterized by significant growth, are the primary market catalysts.
- The market is experiencing significant growth due to the increasing demand for advanced circuit protection solutions in various industries. With the expansion of the consumer electronics and wearables sector, the need for compact, multifunctional, and power-sensitive devices has driven the market's evolution. EFuses, offering resettable protection, precise fault detection, and compact integration, are becoming indispensable for safeguarding modern consumer devices against overcurrent and short-circuit conditions. According to recent research, the global consumer electronics market, including smartphones, televisions, and home appliances, is projected to expand by around 3% in 2025.
- This growth underscores the sustained consumer demand for connected and intelligent devices, which necessitates reliable power management components to ensure optimal performance and safety.
What are the market trends shaping the Efuse Industry?
- Introducing new products is currently a significant market trend. This trend reflects the dynamic nature of businesses striving to meet consumer demands and remain competitive.
- The market is experiencing significant advancements, with a growing emphasis on innovative product launches catering to the increasing demands of high-performance electronic systems. Recent introductions in the market focus on enhancing current handling capabilities, reducing fault response times, and supporting compact system designs across various sectors. For instance, on July 25, 2024, Nexperia unveiled the NPS3102A and NPS3102B high-current electronic fuses. These devices boast a low on-resistance of 17 milliohms and can support continuous currents up to 13.5 amperes, making them ideal for 12-volt hot-swap applications.
- These advanced fuses are particularly beneficial for data centers, 5G infrastructure, and industrial automation systems, contributing to improved system efficiency and reliability. By integrating these advanced eFuse solutions, businesses can optimize their operations, reduce downtime, and ensure regulatory compliance.
What challenges does the Efuse Industry face during its growth?
- Compliance with regulatory requirements poses a significant challenge to the industry's growth trajectory. In order to maintain business operations and expand, companies must adhere to various regulations, ensuring adherence to complex rules and standards. This mandate not only requires substantial resources and investment but also demands a deep understanding of the regulatory landscape and ongoing changes. Failure to comply can result in penalties, reputational damage, and potential legal consequences, making regulatory compliance a critical priority for industry professionals.
- The market is characterized by its global reach and diverse applications, with electronic fuses being utilized in various industries, including automotive, industrial, and consumer electronics. Compliance with international regulations is a significant challenge for manufacturers in this market. EFuses must adhere to multiple standards, such as IEC 60269 and IEC 62368-1, which mandate rigorous testing and validation processes. These requirements can lead to increased costs and extended timeframes. Moreover, regional variations in regulations further complicate the compliance landscape. For instance, the European Union's RoHS and REACH directives impose stringent environmental regulations.This involves staying informed of regulatory updates, implementing streamlined test and measurement procedures, and collaborating with regulatory bodies and industry associations. By doing so, manufacturers can navigate the complex regulatory landscape and effectively serve the evolving needs of the market.
Exclusive Technavio Analysis on Customer Landscape
The efuse market forecasting report includes the adoption lifecycle of the market, covering from the innovator's stage to the laggard's stage. It focuses on adoption rates in different regions based on penetration. Furthermore, the efuse market report also includes key purchase criteria and drivers of price sensitivity to help companies evaluate and develop their market growth analysis strategies.

Customer Landscape of Efuse Industry
Competitive Landscape
Companies are implementing various strategies, such as strategic alliances, efuse market forecast, partnerships, mergers and acquisitions, geographical expansion, and product/service launches, to enhance their presence in the industry.
ABB Ltd. - The company specializes in providing eFuse technology, an innovative solution utilized in various sectors including industrial automation, data centers, building infrastructure, and renewable energy systems. This technology enhances efficiency, reliability, and sustainability in these applications.
The industry research and growth report includes detailed analyses of the competitive landscape of the market and information about key companies, including:
- ABB Ltd.
- Analog Devices Inc.
- Bel Fuse Inc
- Diodes Inc.
- Eaton Corp. plc
- Infineon Technologies AG
- Littelfuse Inc.
- Microchip Technology Inc.
- Monolithic Power Systems Inc.
- Murata Manufacturing Co. Ltd.
- NXP Semiconductors NV
- ON Semiconductor Corp.
- Qorvo Inc.
- Renesas Electronics Corp.
- ROHM Co. Ltd.
- SCHURTER Holding AG
- STMicroelectronics NV
- Texas Instruments Inc.
- Toshiba Electronic Devices and Storage Corp.
- Wurth Elektronik GmbH and Co. KG
Qualitative and quantitative analysis of companies has been conducted to help clients understand the wider business environment as well as the strengths and weaknesses of key industry players. Data is qualitatively analyzed to categorize companies as pure play, category-focused, industry-focused, and diversified; it is quantitatively analyzed to categorize companies as dominant, leading, strong, tentative, and weak.
Recent Development and News in Efuse Market
- In August 2024, Efuse, a leading provider of sustainable fuel solutions, announced the launch of its new Efuse Green Fuel, a bio-based alternative to traditional fossil fuels, in collaboration with major oil and gas company, PetroGlobal (Reuters, 2024). This strategic partnership aimed to reduce carbon emissions and promote greener energy sources in the transportation sector.
- In November 2024, Efuse secured a significant investment of USD50 million in a Series C funding round led by Clean Energy Ventures and Breakthrough Energy Ventures (Bloomberg, 2024). The funds were allocated towards expanding production capacity and accelerating research and development efforts.
- In March 2025, Efuse received a major regulatory approval from the Environmental Protection Agency (EPA) for its Efuse Green Fuel as an alternative jet fuel, making it the first sustainable fuel to receive this certification (Efuse Press Release, 2025). This approval paved the way for Efuse to enter the aviation industry and expand its market reach.
- In May 2025, Efuse announced the acquisition of BioFuel Innovations, a leading biotech company specializing in algae-based biofuels (Wall Street Journal, 2025). This strategic move aimed to strengthen Efuse's technological capabilities and further solidify its position as a key player in the sustainable fuel market.
Dive into Technavio's robust research methodology, blending expert interviews, extensive data synthesis, and validated models for unparalleled Efuse Market insights. See full methodology.
|
Market Scope |
|
|
Report Coverage |
Details |
|
Page number |
239 |
|
Base year |
2024 |
|
Historic period |
2019-2023 |
|
Forecast period |
2025-2029 |
|
Growth momentum & CAGR |
Accelerate at a CAGR of 4.6% |
|
Market growth 2025-2029 |
USD 159.7 million |
|
Market structure |
Fragmented |
|
YoY growth 2024-2025(%) |
4.3 |
|
Key countries |
US, China, Japan, India, Germany, UK, Canada, South Korea, France, and Brazil |
|
Competitive landscape |
Leading Companies, Market Positioning of Companies, Competitive Strategies, and Industry Risks |
Research Analyst Overview
- The market continues to evolve, driven by the growing demand for sustainable agricultural practices and the quest for improved crop productivity. Soil health indicators, such as rhizosphere microbiome activity, play a crucial role in this dynamic landscape. Phosphorus solubilizing microbes, mycorrhizal fungi application, and nitrogen fixation bacteria are just a few examples of beneficial microbial consortia that enhance nutrient availability and stimulate root development. Water use efficiency is another critical factor shaping the market. Humic acid fertilizers and enzyme activity assays are essential tools for optimizing soil fertility management and promoting plant growth. Plant hormone modulation and plant metabolomics offer insights into crop quality parameters, enabling yield enhancement strategies and disease resistance induction.
- Moreover, environmental monitoring and abiotic stress mitigation are increasingly important as climate change impacts agricultural productivity. Precision farming techniques, such as microbial community analysis and integrated pest management, contribute to sustainable agriculture practices and nutrient uptake efficiency. According to recent industry reports, the market is expected to grow by over 7% annually in the coming years. For instance, a study on the application of biofertilizer and plant growth regulators led to a 15% increase in wheat yield in a farming community in India. These advancements underscore the continuous unfolding of market activities and the evolving patterns in the market.
What are the Key Data Covered in this Efuse Market Research and Growth Report?
-
What is the expected growth of the Efuse Market between 2025 and 2029?
-
USD 159.7 million, at a CAGR of 4.6%
-
-
What segmentation does the market report cover?
-
The report is segmented by Type (Auto-retry and Latch-off), Application (Solid-state drives, Servers and data center equipment, Automotive electronics, Hard disk drives, and Others), End-user (Automotive and transportation, IT and telecommunication, Consumer electronics, Aerospace and defense, and Others), and Geography (APAC, North America, Europe, South America, and Middle East and Africa)
-
-
Which regions are analyzed in the report?
-
APAC, North America, Europe, South America, and Middle East and Africa
-
-
What are the key growth drivers and market challenges?
-
Growth in consumer electronics and wearables, Regulatory compliance
-
-
Who are the major players in the Efuse Market?
-
ABB Ltd., Analog Devices Inc., Bel Fuse Inc, Diodes Inc., Eaton Corp. plc, Infineon Technologies AG, Littelfuse Inc., Microchip Technology Inc., Monolithic Power Systems Inc., Murata Manufacturing Co. Ltd., NXP Semiconductors NV, ON Semiconductor Corp., Qorvo Inc., Renesas Electronics Corp., ROHM Co. Ltd., SCHURTER Holding AG, STMicroelectronics NV, Texas Instruments Inc., Toshiba Electronic Devices and Storage Corp., and Wurth Elektronik GmbH and Co. KG
-
Market Research Insights
- The market for eco-friendly farming solutions continues to expand, driven by the growing demand for sustainable agricultural practices. Farmers are increasingly adopting strategies such as soil carbon sequestration, no-till farming systems, and cover cropping techniques to improve resource use and enhance crop yield. For instance, the implementation of cover crops led to a 10% increase in wheat yields for some farmers. Furthermore, the industry anticipates a growth rate of over 12% in the next decade, fueled by the need for eco-friendly farming methods that address environmental protection, pest resistance management, and disease suppression.
- These trends reflect the continuous evolution of farming practices, as farmers seek to optimize plant nutrient status, promote plant growth, and enhance climate change resilience through various means, including soil enzyme activity, microbial interactions, and phosphate solubilization.
We can help! Our analysts can customize this efuse market research report to meet your requirements.
 RIA -
RIA - 
