
Elderly And Disabled Assistive Solutions Market Size 2024-2028
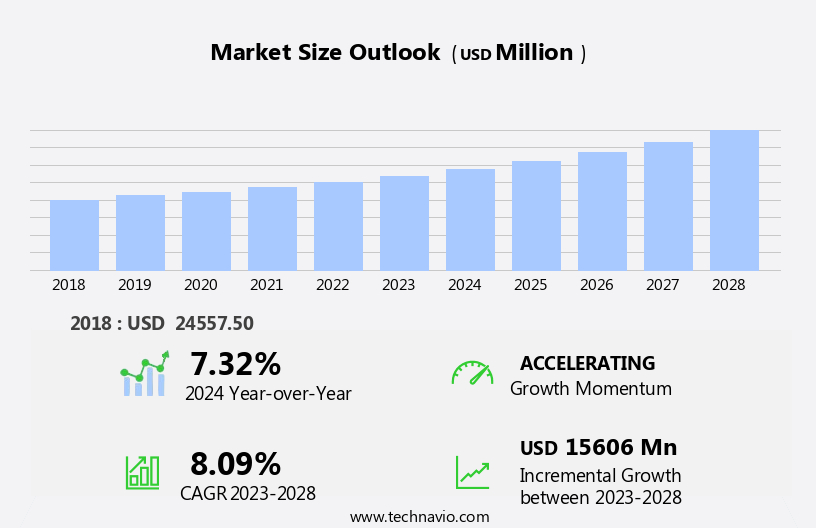
The elderly and disabled assistive solutions market size is forecast to increase by USD 15.61 billion, at a CAGR of 8.09% between 2023 and 2028.
- The market is witnessing significant growth, driven by increasing initiatives by governments and NGOs to promote independent living for the elderly and disabled population. These organizations are investing in advanced technologies and solutions to address the unique needs of this demographic, creating a fertile ground for market expansion. However, the market also faces challenges, particularly in developing countries where customization remains an issue. The one-size-fits-all approach to assistive solutions often fails to cater to the diverse needs of the population, limiting market penetration and growth.
- To overcome this obstacle, companies must focus on developing customizable and affordable solutions that cater to the specific requirements of the elderly and disabled population in these regions. By addressing these challenges and capitalizing on the opportunities presented by government initiatives, market players can effectively navigate the strategic landscape and expand their reach in the market.
What will be the Size of the Elderly And Disabled Assistive Solutions Market during the forecast period?
Explore in-depth regional segment analysis with market size data - historical 2018-2022 and forecasts 2024-2028 - in the full report.
Request Free Sample
The market continues to evolve, driven by advancements in technology and shifting demographic trends. Mobility scooters, personal emergency response systems, communication devices, toilet safety rails, wearable sensors, diabetic management systems, adaptive footwear, grab bars, and smart home technology are just a few of the solutions addressing the diverse needs of this population. These offerings are not static; they are continually advancing to meet the evolving requirements of users. For instance, mobility scooters are no longer just simple mobility aids. They are now equipped with features like long-lasting batteries, improved suspension systems, and advanced safety features. Personal emergency response systems have expanded beyond basic medical alerts to include fall detection and remote monitoring capabilities.
Communication devices are integrating voice recognition technology and real-time translation services. Moreover, the convergence of various sectors is leading to innovative combinations of assistive solutions. For example, smart home technology is being integrated with mobility management systems to create more accessible and independent living environments. Wearable sensors are being used in conjunction with cognitive assistance tools to help individuals with memory and cognitive impairments. The market for assistive solutions is vast and multifaceted, with applications ranging from healthcare to daily living aids. The ongoing development of these solutions reflects the dynamic nature of the market and the evolving needs of the elderly and disabled population.
Whether it's mobility aids, adaptive clothing, or home modification solutions, the goal is to enhance the quality of life for those who need it most. Assistive technology is also extending beyond physical aids to include solutions for sensory impairments. Hearing aids are being enhanced with Bluetooth connectivity and artificial intelligence capabilities. Daily living aids like raised toilet seats and bathing aids are being redesigned to be more aesthetically pleasing and user-friendly. The market for assistive solutions is constantly unfolding, with new innovations and applications emerging all the time. The integration of sensor technology and remote monitoring systems is enabling more effective and efficient care delivery, particularly in the area of remote patient monitoring.
Assistive robotics is another area of growth, with robots being developed to assist with tasks like medication reminders and mobility management. In conclusion, the market is a dynamic and evolving space, driven by technological advancements and changing demographic trends. The solutions available, from mobility scooters to cognitive assistance tools, are continually advancing to meet the diverse needs of the elderly and disabled population. Whether it's mobility aids, daily living aids, or healthcare solutions, the goal is to enhance the quality of life for those who need it most. The future of this market is bright, with new innovations and applications emerging all the time.
How is this Elderly And Disabled Assistive Solutions Industry segmented?
The elderly and disabled assistive solutions industry research report provides comprehensive data (region-wise segment analysis), with forecasts and estimates in "USD million" for the period 2024-2028, as well as historical data from 2018-2022 for the following segments.
- Product
- Hearing devices
- Mobility and ambulatory devices
- Healthcare furniture and BSE
- Vision and reading aids
- End-user
- Hospital
- Home care setting
- Nursing homes
- Assisted living facilities
- Geography
- North America
- US
- Europe
- France
- Germany
- UK
- APAC
- Japan
- Rest of World (ROW)
- North America
By Product Insights
The hearing devices segment is estimated to witness significant growth during the forecast period.
The market encompasses a range of innovative products designed to enhance the quality of life for individuals with mobility, vision, or hearing challenges. Key segments include hearing aids, ramp systems, vision aids, remote patient monitoring, hospital beds, assistive robotics, fall prevention devices, medication reminders, wheelchair cushions, mobility scooters, personal emergency response systems, communication devices, toilet safety rails, wearable sensors, diabetic management systems, adaptive footwear, grab bars, smart home technology, bathing aids, cognitive assistance, activity trackers, raised toilet seats, remote monitoring systems, mobility management, hearing aids, daily living aids, pressure relief mattresses, adaptive equipment, wheelchair accessibility, home modification, sensor technology, mobility aids, adaptive clothing, and orthopedic devices.
The hearing aids segment experiences significant growth due to the increasing prevalence of hearing impairments caused by aging and noise pollution. companies such as Cochlear Ltd., Invacare Corp., Sonova AG, and Demant AS are at the forefront, focusing on industrial standard compliance and advanced technology integration. Meanwhile, remote patient monitoring and assistive robotics are gaining traction as technology advances, enabling real-time health monitoring and assistance for the elderly and disabled population. In the realm of mobility solutions, ramp systems, mobility scooters, and wheelchair accessibility are essential for individuals with mobility challenges. Smart home technology and cognitive assistance systems, such as activity trackers and cognitive assistance devices, cater to the needs of individuals with cognitive impairments.
Bathing aids, toilet safety rails, and diabetic management systems are other essential segments that address daily living needs. Innovations in sensor technology and home modification solutions are transforming the market, offering improved safety, comfort, and convenience. Adaptive equipment, such as adaptive clothing and orthopedic devices, are also gaining popularity as they cater to specific needs and enhance overall functionality. In summary, the market is witnessing significant growth due to the increasing global population aging and the rising prevalence of disabilities. companies are focusing on advanced technology integration, industrial standard compliance, and catering to diverse needs to meet the evolving demands of this market.
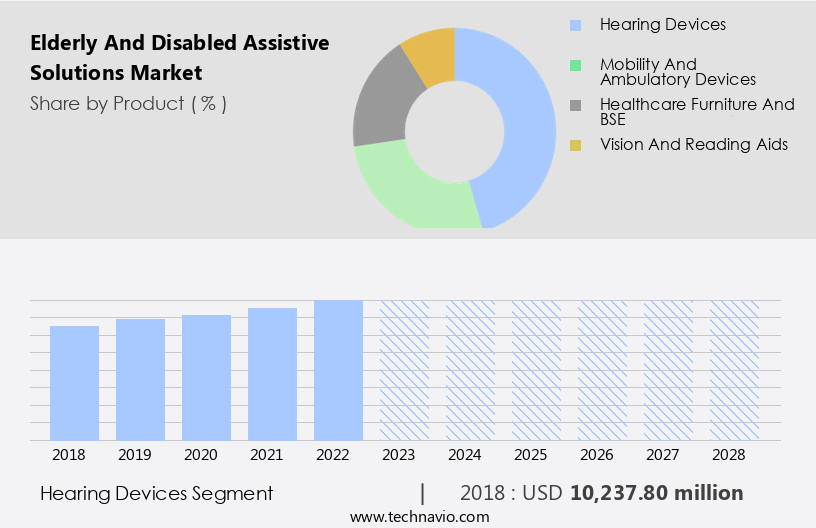
The Hearing devices segment was valued at USD 10.24 billion in 2018 and showed a gradual increase during the forecast period.
Regional Analysis
North America is estimated to contribute 38% to the growth of the global market during the forecast period.Technavio's analysts have elaborately explained the regional trends and drivers that shape the market during the forecast period.
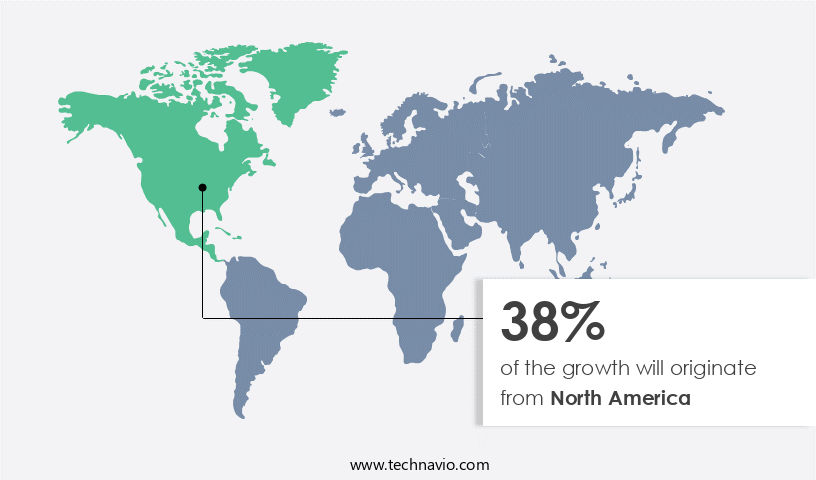
The market for elderly and disabled assistive solutions in North America is experiencing significant growth due to the expansion of advanced healthcare facilities, increasing healthcare expenditures, and the presence of government organizations like Medicaid. In 2022, US health spending increased by 4.1% to reach USD4.4 trillion, or USD13,493 per person. This substantial funding leads to the availability of advanced products, including wheelchairs, mobility devices, and hearing aids. Moreover, government initiatives, such as the National Lung Health Framework, promote disease awareness and treatment. Assistive technology, such as eating utensils designed for individuals with limited mobility, ramp systems, vision aids, and remote patient monitoring, is becoming increasingly popular.
Hospital beds, assistive robotics, fall prevention devices, medication reminders, wheelchair cushions, mobility scooters, personal emergency response systems, communication devices, toilet safety rails, wearable sensors, diabetic management systems, adaptive footwear, grab bars, smart home technology, bathing aids, cognitive assistance, activity trackers, raised toilet seats, remote monitoring systems, mobility management, hearing aids, daily living aids, pressure relief mattresses, adaptive equipment, wheelchair accessibility, home modification, sensor technology, mobility aids, adaptive clothing, and orthopedic devices are all integral parts of this market. The integration of sensor technology and smart home systems is revolutionizing the market. For example, remote monitoring systems enable healthcare professionals to monitor patients' health conditions in real-time, while mobility management solutions help individuals maintain their independence and improve their quality of life.
Furthermore, the use of cognitive assistance and activity trackers assists individuals with cognitive impairments and encourages a more active lifestyle. In conclusion, the market in North America is driven by the growth of advanced healthcare facilities, rising healthcare spending, and government initiatives. The market encompasses a wide range of products, including eating utensils, ramp systems, vision aids, remote patient monitoring, hospital beds, assistive robotics, fall prevention devices, medication reminders, wheelchair cushions, mobility scooters, personal emergency response systems, communication devices, toilet safety rails, wearable sensors, diabetic management systems, adaptive footwear, grab bars, smart home technology, bathing aids, assistive technology, cognitive assistance, activity trackers, raised toilet seats, remote monitoring systems, mobility management, hearing aids, daily living aids, pressure relief mattresses, adaptive equipment, wheelchair accessibility, home modification, sensor technology, mobility aids, adaptive clothing, and orthopedic devices.
The integration of sensor technology and smart home systems is transforming the market, offering innovative solutions to improve the lives of elderly and disabled individuals.
Market Dynamics
Our researchers analyzed the data with 2023 as the base year, along with the key drivers, trends, and challenges. A holistic analysis of drivers will help companies refine their marketing strategies to gain a competitive advantage.
What are the key market drivers leading to the rise in the adoption of Elderly And Disabled Assistive Solutions Industry?
- The collaboration between governments and NGOs serves as the primary catalyst for market growth through their initiatives.
- The market encompasses a range of products designed to enhance the daily lives of individuals with physical limitations. These solutions include, but are not limited to, eating utensils with ergonomic designs, ramp systems for wheelchair accessibility, vision aids such as magnifying glasses and telescopic lenses, remote patient monitoring systems, hospital beds with adjustable features, assistive robotics for mobility assistance, fall prevention devices, and medication reminders. Government initiatives worldwide are driving the growth of this market, with a focus on promoting equality and inclusion for individuals with disabilities. For instance, the Americans with Disabilities Act (ADA) in the US prohibits discrimination against qualified individuals with disabilities in employment, education, and public accommodations.
- As a result, there has been a notable increase in the adoption of assistive solutions in various sectors, enabling greater independence and improved quality of life for those with physical limitations. Moreover, advancements in technology have led to the development of innovative assistive solutions, such as fall prevention devices that use sensors to detect potential falls and alert caregivers, and medication reminders that use smartphone applications and voice assistants to help individuals manage their medications. These technological advancements are expected to further fuel the growth of the market. In conclusion, the market is witnessing significant growth due to increasing government initiatives and technological advancements.
- These solutions, including eating utensils, ramp systems, vision aids, remote patient monitoring systems, hospital beds, assistive robotics, fall prevention devices, and medication reminders, are essential for enhancing the daily lives of individuals with physical disabilities and promoting greater independence and improved quality of life.
What are the market trends shaping the Elderly And Disabled Assistive Solutions Industry?
- The trend towards increasing customization is gaining momentum in the market. The market is experiencing significant advancements, with companies focusing on strategies such as faster delivery processes and mass customization and personalization. Mass customization and personalization are increasingly important in this market, driven by technological innovations, add-on features, and equipment, as well as the ability to cater to consumers' specific requirements. Technological advances, such as computer-aided designing, are enabling companies to bring about changes in product development and delivery. Flexibility in terms of add-on features and associated equipment is also crucial for mass customization. For instance, mobility scooters can be customized with various seating options, colors, and additional features to meet individual needs.
- Communication devices, personal emergency response systems, toilet safety rails, wearable sensors, diabetic management systems, adaptive footwear, grab bars, and smart home technology are some of the key solutions that are being mass-customized and personalized to cater to the unique requirements of elderly and disabled consumers. The adoption of mass customization in the market is a complex process that requires advancements in technology, flexibility in add-on features and equipment, and a harmonious approach to final product development and delivery. By focusing on these areas, companies can create solutions that are tailored to the specific needs of their customers, enhancing their overall customer experience.
What challenges does the Elderly And Disabled Assistive Solutions Industry face during its growth?
- In developing countries, various issues pose significant challenges to the growth of the industry. These challenges include, but are not limited to, inadequate infrastructure, political instability, and economic volatility. Addressing these complexities is essential for fostering sustainable industry expansion in these regions.
- The market encompasses a range of products designed to enhance the daily lives of individuals with mobility, cognitive, or hearing challenges. Key offerings include bathing aids, assistive technology such as cognitive assistance and activity trackers, raised toilet seats, and remote monitoring systems for mobility management. Hearing aids and daily living aids are also essential components of this market. Majority of the leading companies in this sector are headquartered in the US and Europe, with manufacturing or sales units in 3-5 countries. This geographical distribution necessitates importation of assistive solutions from countries with the closest manufacturing or sales units for most countries outside of North America and Europe.
- Asian countries, including China, India, and Bangladesh, impose high import duties on this equipment, with most-favored-nation (MFN) duty rates and additional charges like special tax, landing charges, and countervailing duty significantly increasing the cost of importing these products. Despite these challenges, the market continues to grow as the demand for assistive solutions increases due to an aging population and a rising number of individuals with disabilities.
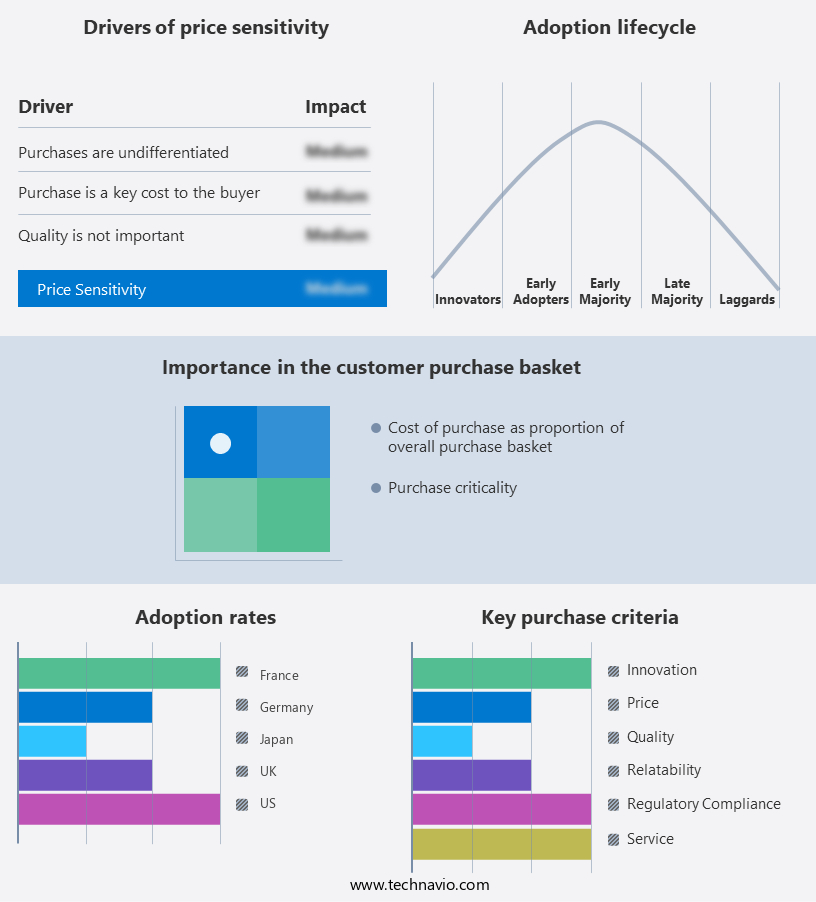
Exclusive Customer Landscape
The elderly and disabled assistive solutions market forecasting report includes the adoption lifecycle of the market, covering from the innovator's stage to the laggard's stage. It focuses on adoption rates in different regions based on penetration. Furthermore, the elderly and disabled assistive solutions market report also includes key purchase criteria and drivers of price sensitivity to help companies evaluate and develop their market growth analysis strategies.
Customer Landscape
Key Companies & Market Insights
Companies are implementing various strategies, such as strategic alliances, elderly and disabled assistive solutions market forecast, partnerships, mergers and acquisitions, geographical expansion, and product/service launches, to enhance their presence in the industry.
Blue Chip Medical Products Inc. - This company specializes in providing assistive solutions for the elderly and disabled population. Their product offerings include wheelchair cushions, positioning cushions, Geri chairs, and recliners, designed to enhance comfort and mobility. These solutions cater to individuals with unique needs, contributing to improved quality of life.
The industry research and growth report includes detailed analyses of the competitive landscape of the market and information about key companies, including:
- Blue Chip Medical Products Inc.
- Briggs Corp.
- Cochlear Ltd.
- Demant AS
- DeVilbiss Healthcare GmbH
- Electric Mobility Euro Ltd.
- Freedom Scientific Inc.
- GF Health Products Inc.
- GN Store Nord AS
- Invacare Corp.
- LifeTec
- MED EL Elektromedizinische Gerate GmbH
- Ottobock SE and Co. KGaA
- Permobil AB
- Pride Mobility Products Corp.
- Siemens AG
- Sonova AG
- Starkey Laboratories Inc.
- Sunrise Medical LLC
- WS Audiology AS
Qualitative and quantitative analysis of companies has been conducted to help clients understand the wider business environment as well as the strengths and weaknesses of key industry players. Data is qualitatively analyzed to categorize companies as pure play, category-focused, industry-focused, and diversified; it is quantitatively analyzed to categorize companies as dominant, leading, strong, tentative, and weak.
Recent Development and News in Elderly And Disabled Assistive Solutions Market
- In January 2024, Medtronic, a global healthcare solutions company, announced the launch of its new Elderly Care Portfolio, which includes the introduction of the SmartSleeper, a remote patient monitoring system designed for elderly individuals with chronic conditions (Medtronic Press Release, 2024).
- In March 2024, Amazon Care, Amazon's healthcare service, partnered with Caregility, a telehealth technology provider, to expand its virtual care offerings for elderly and disabled individuals, integrating remote monitoring, virtual visits, and medication management services (Amazon Care Press Release, 2024).
- In April 2025, Philips, a leading health technology company, completed the acquisition of Wellcentive, a population health management and analytics firm, to enhance its elderly and disabled assistive solutions by integrating advanced data analytics and personalized care management capabilities (Philips Press Release, 2025).
- In May 2025, the European Commission approved the Horizon Europe program, which includes a significant investment in research and innovation for assistive technologies for elderly and disabled individuals, totaling â¬95.5 billion over seven years (European Commission Press Release, 2025).
Research Analyst Overview
- The market encompasses a range of technologies designed to enhance the lives of those with aging-related needs and disabilities. Key trends include the integration of smart home sensors for fall detection and emergency alerts, speech-to-text software for medication adherence, and cognitive rehabilitation tools for memory aids and sensory integration. Supported living environments incorporate universal design principles, accessible design, and ergonomic furniture, enabling independent living. Assistive listening devices, hearing enhancement technology, and text-to-speech software address hearing impairments, while assisted living facilities offer care coordination, remote caregiving, and home healthcare services.
- Physical therapy and rehabilitation equipment cater to those requiring mobility assistance, and adaptive controls ensure ease of use for individuals with motor disabilities. Visual aids and augmentative communication tools support those with visual or speech impairments, further enhancing the quality of life for the aging population and those with disabilities.
Dive into Technavio's robust research methodology, blending expert interviews, extensive data synthesis, and validated models for unparalleled Elderly And Disabled Assistive Solutions Market insights. See full methodology.
|
Market Scope |
|
|
Report Coverage |
Details |
|
Page number |
178 |
|
Base year |
2023 |
|
Historic period |
2018-2022 |
|
Forecast period |
2024-2028 |
|
Growth momentum & CAGR |
Accelerate at a CAGR of 8.09% |
|
Market growth 2024-2028 |
USD 15606 million |
|
Market structure |
Fragmented |
|
YoY growth 2023-2024(%) |
7.32 |
|
Key countries |
US, Germany, Japan, UK, and France |
|
Competitive landscape |
Leading Companies, Market Positioning of Companies, Competitive Strategies, and Industry Risks |
What are the Key Data Covered in this Elderly And Disabled Assistive Solutions Market Research and Growth Report?
- CAGR of the Elderly And Disabled Assistive Solutions industry during the forecast period
- Detailed information on factors that will drive the growth and forecasting between 2024 and 2028
- Precise estimation of the size of the market and its contribution of the industry in focus to the parent market
- Accurate predictions about upcoming growth and trends and changes in consumer behaviour
- Growth of the market across North America, Europe, Asia, and Rest of World (ROW)
- Thorough analysis of the market's competitive landscape and detailed information about companies
- Comprehensive analysis of factors that will challenge the elderly and disabled assistive solutions market growth of industry companies
We can help! Our analysts can customize this elderly and disabled assistive solutions market research report to meet your requirements.
 RIA -
RIA - 
