Electric Sports Utility Vehicle (E-Suv) Market Analysis APAC, North America, Europe, South America, Middle East and Africa - China, US, Norway, Germany, Japan - Size and Forecast 2024-2028

Electric Sports Utility Vehicle (E-Suv) Market Analysis APAC, North America, Europe, South America, Middle East and Africa - China, US, Norway, Germany, Japan - Size and Forecast 2024-2028

Published: Jul 2024 165 Pages SKU: IRTNTR75660

Market Overview at a Glance

$181.1 B
Market Opportunity
35.85%
CAGR
26.52
YoY growth 2023-2024(%)

Electric Sports Utility Vehicle (E-SUV) Market Size 2024-2028

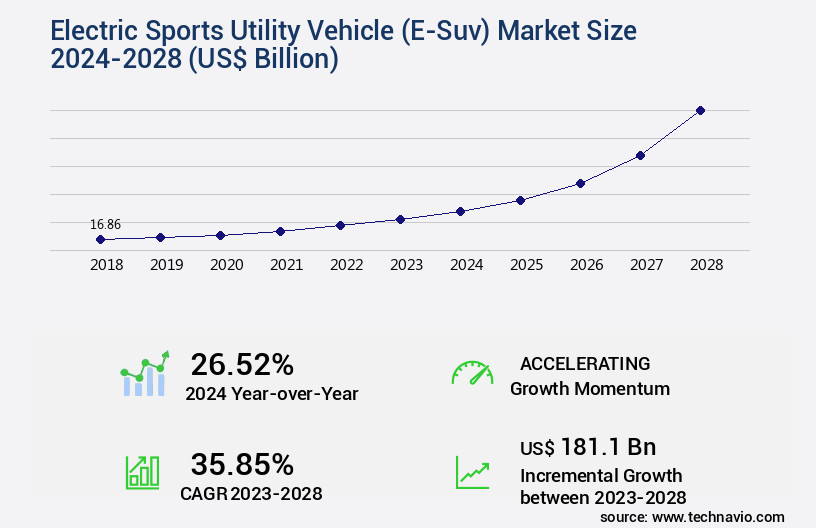
The electric sports utility vehicle (e-SUV) market size is valued to increase USD 181.1 billion, at a CAGR of 35.85% from 2023 to 2028. Increasing demand and sales of BEVs in global market will drive the electric sports utility vehicle (e-suv) market.

Major Market Trends & Insights

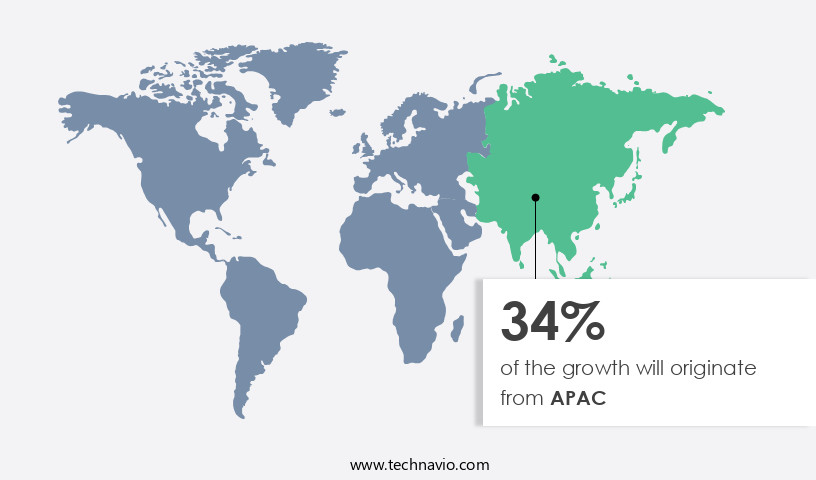
  • APAC dominated the market and accounted for a 34% growth during the forecast period.
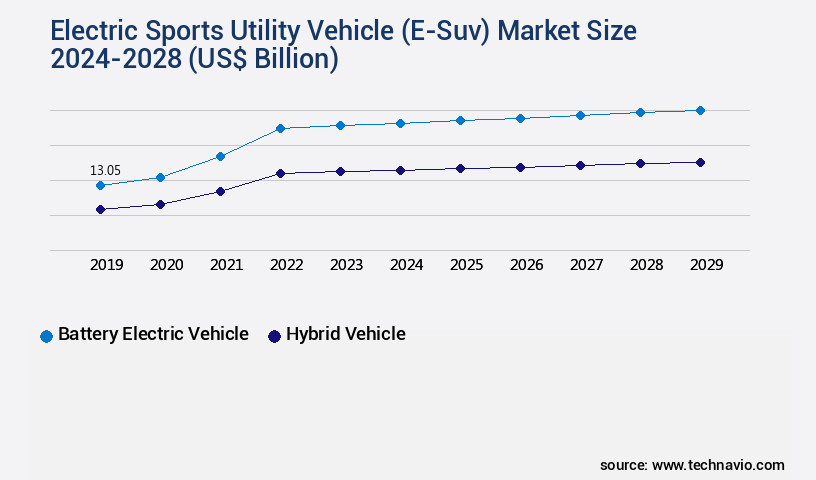
  • By Propulsion - Battery electric vehicle segment was valued at USD 10.33 billion in 2022
  • By Type - Small and medium size segment accounted for the largest market revenue share in 2022

Market Size & Forecast

  • Market Opportunities: USD 1.00 billion
  • Market Future Opportunities: USD 181101.30 billion
  • CAGR from 2023 to 2028 : 35.85%

Market Summary

  • The market is experiencing significant growth as the global shift towards sustainable transportation continues. Core technologies, such as lithium-ion batteries and electric motors, are driving the adoption of e-SUVs, with sales increasing at an impressive rate. For instance, according to a recent study, the global battery-electric vehicle (BEV) market share in the SUV segment is projected to reach 25% by 2025. Additionally, the emergence of wireless charging systems for EVs is addressing the challenge of long charging times, making e-SUVs a more viable option for consumers.
  • However, the high cost of ownership remains a significant barrier to widespread adoption. Despite this, the market continues to evolve, with new players entering the scene and regulations pushing for more stringent emissions standards. The E-Suv Market is poised for continued growth, offering numerous opportunities for stakeholders.

What will be the Size of the Electric Sports Utility Vehicle (E-Suv) Market during the forecast period?

Electric Sports Utility Vehicle (E-Suv) Market Size

Get Key Insights on Market Forecast (PDF) Request Free Sample

How is the Electric Sports Utility Vehicle (E-Suv) Market Segmented ?

The electric sports utility vehicle (e-suv) industry research report provides comprehensive data (region-wise segment analysis), with forecasts and estimates in "USD billion" for the period 2024-2028, as well as historical data from 2018-2022 for the following segments.

  • Propulsion
    • Battery electric vehicle
    • Hybrid vehicle
  • Type
    • Small and medium size
    • Large size
  • Geography
    • North America
      • US
    • Europe
      • Germany
      • Norway
    • APAC
      • China
      • Japan
    • Rest of World (ROW)

By Propulsion Insights

The battery electric vehicle segment is estimated to witness significant growth during the forecast period.

The market is experiencing significant growth, with the battery electric vehicle (BEV) segment leading the charge. This trend is driven by increasing consumer preference for eco-friendly, cost-effective alternatives to traditional gasoline-powered SUVs. Government incentives, such as tax credits and rebate programs, have further fueled the demand for e-SUVs. In the US, for instance, the Inflaition Reduction Act of 2022 offers a credit of up to USD7,500 for purchasing a new, qualified plug-in electric or fuel cell electric vehicle. Key market trends include advancements in range anxiety mitigation through regenerative braking systems and powertrain integration. Durability testing methods and energy density metrics are crucial for ensuring the longevity and efficiency of e-SUVs.

Compliance with emission standards is a priority, with electric motor efficiency, battery pack capacity, and wheel drive configuration all playing significant roles. Vehicle stability control, manufacturing processes, thermal management systems, and dc-dc converter efficiency are other essential factors. Performance optimization is achieved through connectivity technology, supply chain management, lightweight materials use, motor torque performance, onboard charger design, aerodynamic drag reduction, infotainment system integration, battery cell chemistry, reliability analysis methods, driver assistance features, power electronics design, charging infrastructure needs, autonomous driving tech, cybersecurity measures, vehicle-to-grid technology, fast charging technology, over-the-air updates, battery life expectancy, traction motor control, and energy consumption modeling.

According to recent studies, the e-SUV market is projected to grow by 25% in the next two years, with industry experts anticipating a 30% increase in demand for BEVs specifically. These figures reflect the continuous unfolding of market activities and the evolving patterns in the e-SUV sector.

Electric Sports Utility Vehicle (E-Suv) Market Size

Request Free Sample

The Battery electric vehicle segment was valued at USD 10.33 billion in 2018 and showed a gradual increase during the forecast period.

Electric Sports Utility Vehicle (E-Suv) Market Size

Request Free Sample

Regional Analysis

APAC is estimated to contribute 34% to the growth of the global market during the forecast period.Technavio's analysts have elaborately explained the regional trends and drivers that shape the market during the forecast period.

Electric Sports Utility Vehicle (E-Suv) Market Share by Geography

See How Electric Sports Utility Vehicle (E-Suv) Market Demand is Rising in APAC Request Free Sample

In the global e-SUV market, the Asia Pacific region (APAC) represents a significant growth area. Factors fueling this expansion include the increasing sales of small and medium-sized electric SUVs in countries like China and India. Government initiatives aimed at reducing carbon emissions, stringent emission norms, and incentive schemes are key drivers in the region. For instance, China and India's efforts to combat air pollution in their major cities have led to a surge in e-SUV adoption.

Additionally, the expansion of EV charging infrastructure and increased participation by both foreign and local Original Equipment Manufacturers (OEMs) are further propelling market growth in the region. These developments underscore the e-SUV market's potential for continued expansion in APAC.

Market Dynamics

Our researchers analyzed the data with 2023 as the base year, along with the key drivers, trends, and challenges. A holistic analysis of drivers will help companies refine their marketing strategies to gain a competitive advantage.

The market is witnessing significant growth, driven by advancements in battery technology, thermal management strategies, and the optimization of regenerative braking systems. Battery chemistry plays a pivotal role in determining vehicle range, with lithium-ion batteries currently dominating the market due to their energy density and long life cycle. Manufacturers are focusing on improving the efficiency of electric motors, with permanent magnet motors and induction motors being the primary types. Tire design also impacts vehicle range, with low rolling resistance tires gaining popularity. Integration of advanced driver assistance systems (ADAS) and lightweight material selection for improved efficiency are other key trends.

Aerodynamics plays a crucial role in reducing energy consumption, with e-SUVs adopting streamlined designs and active aerodynamic features. High-voltage architectures and methods for improving battery life expectancy, such as thermal management and battery cell optimization, are also under active research. Fast charging without battery degradation is a significant challenge, with companies exploring strategies like liquid cooling, thermal conditioning, and battery management system algorithms. Charging infrastructure development is crucial for e-SUV adoption, with investments in public charging stations and home charging solutions increasing. Implementing vehicle-to-grid (V2G) technology poses challenges due to cybersecurity vulnerabilities in connected vehicles. Comparatively, more than 60% of new e-SUV developments focus on enhancing autonomous driving features, reflecting the growing importance of this technology in the automotive industry.

Energy consumption patterns in electric vehicles vary significantly based on driving conditions, vehicle weight, and battery size. Power electronics design also impacts vehicle efficiency, with companies investing in advanced semiconductor technologies and control algorithms. Testing methodologies for electric vehicle components, including battery cells, electric motors, and power electronics, are under constant evolution to ensure reliability and performance. The comparison of various electric motor drive types, such as AC and DC motors, reveals that AC motors offer higher efficiency and better torque control, making them a popular choice for e-SUVs.

Electric Sports Utility Vehicle (E-Suv) Market Size

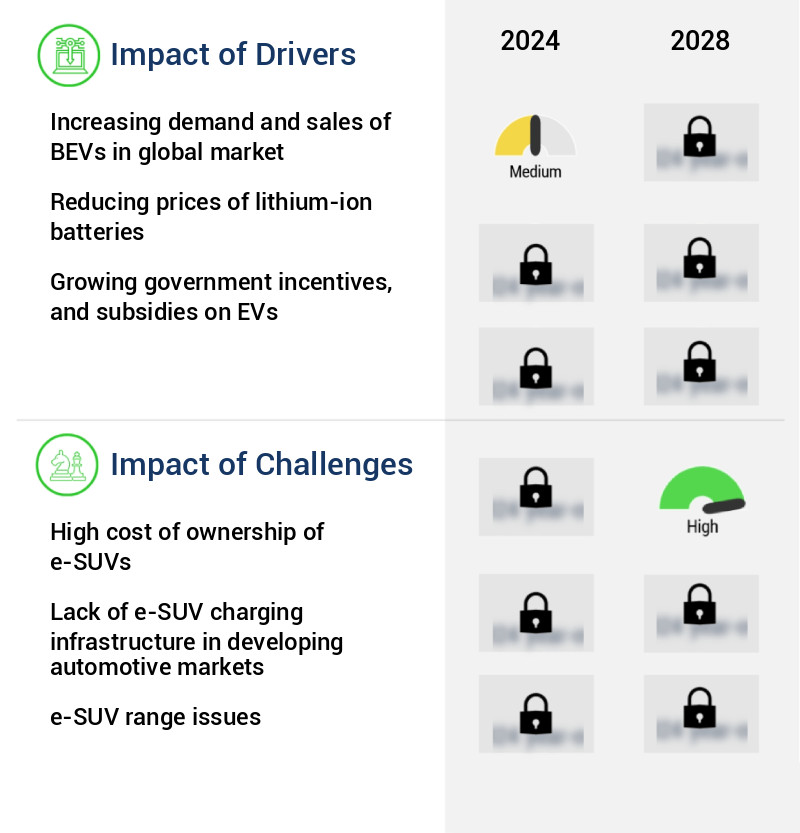
What are the key market drivers leading to the rise in the adoption of Electric Sports Utility Vehicle (E-Suv) Industry?

  • The global market is driven primarily by the escalating demand and sales of Battery Electric Vehicles (BEVs), signifying a significant shift in consumer preferences towards sustainable and eco-friendly transportation solutions. 
  • The global Electrical Vehicles (EVs) market experienced a notable surge in demand during 2021, with sales reaching an all-time high of over 7 million units. This growth was particularly evident in China and the US, as well as certain European countries. The EV sector has seen substantial expansion over the past five years, with BEVs accounting for a significant portion of this growth. In 2021, BEVs accounted for approximately 60% of the global EV sales. China remained the leading market for BEV sales, delivering the highest number of units.
  • Europe and the US followed closely behind, with Europe witnessing a steady increase in BEV adoption. The global BEV market's continuous growth is driven by advancements in technology, increasing environmental concerns, and government incentives.

What are the market trends shaping the Electric Sports Utility Vehicle (E-Suv) Industry?

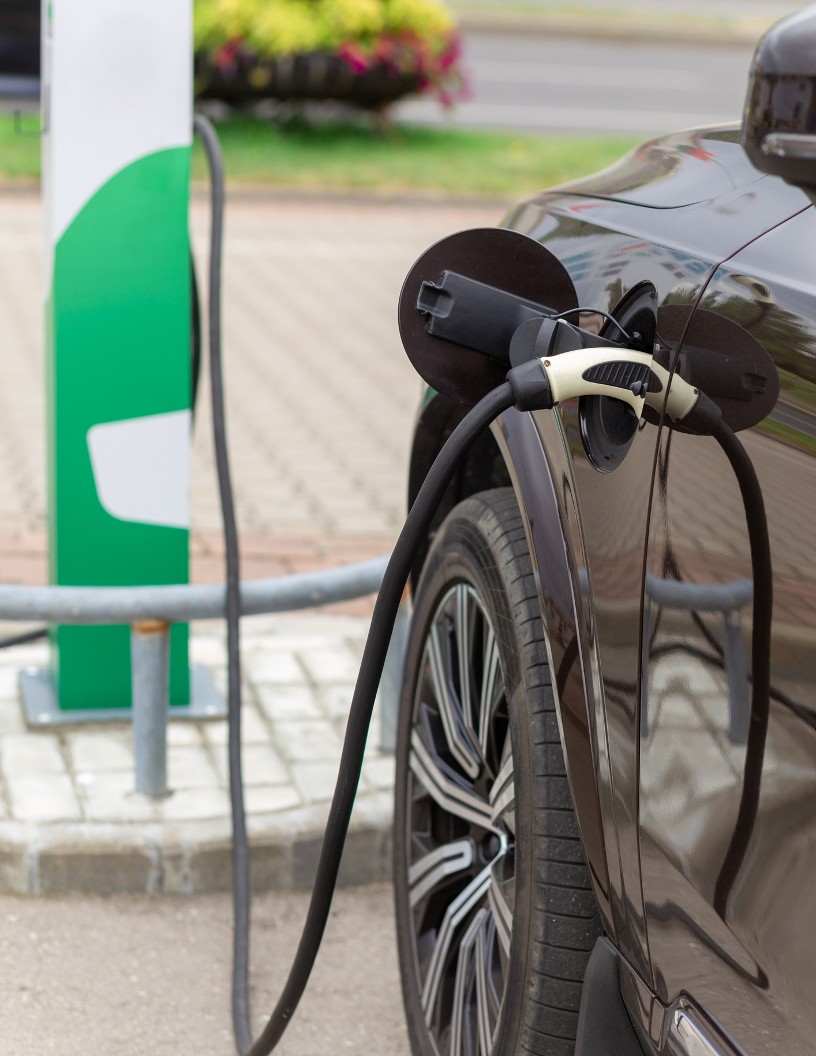
  • The emergence of wireless charging systems represents a significant market trend in the electric vehicle industry. Wireless charging technology is gaining popularity as a convenient and efficient solution for charging electric vehicles.
  • Electrical vehicle charging infrastructure plays a crucial role in the sustainability of all-electric cars, leading to substantial investments in its development and enhancement. With the escalating focus on eco-friendly transportation and the increasing popularity of higher levels of autonomy in EVs, demand for wireless charging systems is on the rise. These systems, which enable charging on the go, are becoming increasingly essential to maintain optimal vehicle range. Key industry players are collaborating to develop efficient wireless charging models for future EVs, allowing vehicles to perfectly align over charging pads for maximum efficiency.
  • This innovative approach is expected to significantly impact the EV charging infrastructure landscape, catering to the evolving needs of the market. The continuous advancements in wireless charging technology and the growing acceptance of all-electric vehicles are set to drive market growth during the forecast period.

What challenges does the Electric Sports Utility Vehicle (E-Suv) Industry face during its growth?

  • The high cost of ownership is a significant challenge impeding the growth of the e-SUV industry. 
  • E-SUVs represent a growing segment in the automotive market, offering consumers the benefits of electric vehicles (BEVs) in a larger, more versatile package. However, their cost remains a significant barrier, particularly in developing markets. In developed markets, factors such as improved socio-economic conditions, developed EV infrastructure, higher localization of manufacturing, and government incentives make e-SUVs increasingly affordable. Consequently, the cost differential between e-SUVs and their internal combustion engine (ICE) counterparts is minimal. Conversely, in emerging markets, the cost of e-SUV ownership is higher compared to ICE SUVs due to various factors, including higher upfront costs and limited charging infrastructure.
  • The manufacturing cost of BEVs, including e-SUVs, is influenced by factors such as intended range, hours of use, and fuel cost savings. Government subsidies also play a crucial role in reducing the overall cost. Despite these challenges, the e-SUV market continues to evolve, driven by advancements in battery technology, increasing consumer awareness, and government initiatives to reduce carbon emissions. As a professional, it is essential to recognize the ongoing changes and adapt to the evolving market landscape.

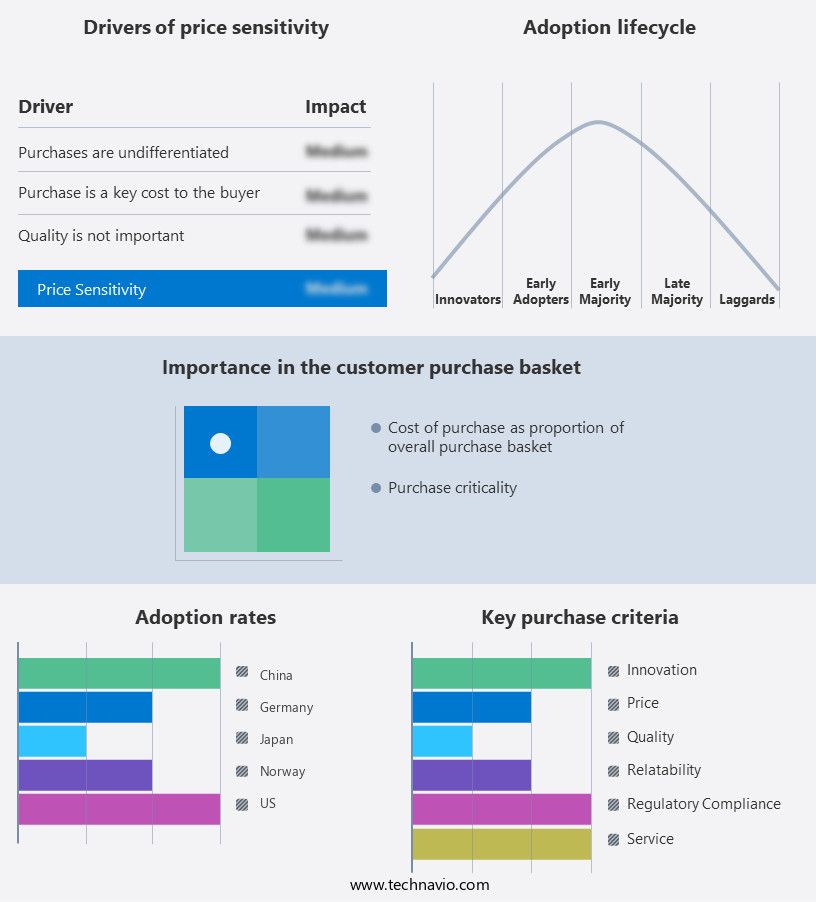
Exclusive Technavio Analysis on Customer Landscape

The electric sports utility vehicle (e-suv) market forecasting report includes the adoption lifecycle of the market, covering from the innovator's stage to the laggard's stage. It focuses on adoption rates in different regions based on penetration. Furthermore, the electric sports utility vehicle (e-suv) market report also includes key purchase criteria and drivers of price sensitivity to help companies evaluate and develop their market growth analysis strategies.

Electric Sports Utility Vehicle (E-Suv) Market Share by Geography

 Customer Landscape of Electric Sports Utility Vehicle (E-Suv) Industry

Competitive Landscape

Companies are implementing various strategies, such as strategic alliances, electric sports utility vehicle (e-suv) market forecast, partnerships, mergers and acquisitions, geographical expansion, and product/service launches, to enhance their presence in the industry.

AEHRA - The company introduces electric Sport Utility Vehicles (e-SUVs) into the market, with the BMW iX as an example. This eco-friendly vehicle category represents a significant growth area in the global automotive industry, driven by increasing consumer demand for sustainable transportation solutions. The company's commitment to innovation and technological advancement positions it as a key player in this expanding sector.

The industry research and growth report includes detailed analyses of the competitive landscape of the market and information about key companies, including:

  • AEHRA
  • Bayerische Motoren Werke AG
  • BYD Co. Ltd.
  • Dr. Ing. h.c. F. Porsche AG
  • Ford Motor Co.
  • General Motors Co.
  • Honda Motor Co. Ltd.
  • Hyundai Motor Co.
  • KIA CORP.
  • Mahindra and Mahindra Ltd.
  • Maruti Suzuki India Ltd.
  • Mercedes Benz Group AG
  • Nissan Motor Co. Ltd.
  • Pravaig Dynamics Pvt Ltd.
  • Renault SAS
  • Tata Motors Ltd.
  • Tesla Inc.
  • Toyota Motor Corp.
  • Volkswagen AG
  • Volvo Car Corp.

Qualitative and quantitative analysis of companies has been conducted to help clients understand the wider business environment as well as the strengths and weaknesses of key industry players. Data is qualitatively analyzed to categorize companies as pure play, category-focused, industry-focused, and diversified; it is quantitatively analyzed to categorize companies as dominant, leading, strong, tentative, and weak.

Recent Development and News in Electric Sports Utility Vehicle (E-Suv) Market

  • In January 2024, Tesla, the leading electric vehicle (EV) manufacturer, unveiled its new model Y SUV in its Shanghai Gigafactory, marking its first locally produced electric SUV in China (Tesla Press Release, 2024). This strategic expansion was a significant milestone for Tesla, as China is the world's largest automotive market and a crucial growth area for electric vehicles.
  • In March 2024, Volkswagen and Ford announced a strategic partnership to develop commercial vehicles and electric vehicles for the European and North American markets (Volkswagen Press Release, 2024). This collaboration aimed to reduce development costs and capitalize on each other's expertise in the EV sector, signifying a major shift in the competitive landscape of the electric SUV market.
  • In April 2025, Rivian, an emerging electric vehicle manufacturer, raised USD2.5 billion in a funding round led by Amazon, bringing its total funding to over USD10 billion (Rivian Press Release, 2025). This significant investment allowed Rivian to accelerate the production of its R1S electric SUV, further intensifying competition in the rapidly growing electric SUV market.
  • In May 2025, the European Union announced a proposed regulation to ban the sale of new petrol and diesel cars from 2035, accelerating the transition to electric vehicles (European Commission Press Release, 2025). This policy change is expected to significantly boost the demand for electric SUVs in Europe, making it a crucial market for automakers to invest in and innovate within the electric SUV segment.

Dive into Technavio's robust research methodology, blending expert interviews, extensive data synthesis, and validated models for unparalleled Electric Sports Utility Vehicle (E-Suv) Market insights. See full methodology.

Market Scope

Report Coverage

Details

Page number

165

Base year

2023

Historic period

2018-2022

Forecast period

2024-2028

Growth momentum & CAGR

Accelerate at a CAGR of 35.85%

Market growth 2024-2028

USD 181.1 billion

Market structure

Fragmented

YoY growth 2023-2024(%)

26.52

Key countries

China, US, Norway, Germany, and Japan

Competitive landscape

Leading Companies, Market Positioning of Companies, Competitive Strategies, and Industry Risks

Request Free Sample

Research Analyst Overview

  • In the dynamic and evolving the market, several key trends are shaping the industry's future. One significant development is the ongoing advancement of range anxiety mitigation technologies. Regenerative braking systems, for instance, have become increasingly sophisticated, effectively extending e-SUVs' driving range. Powertrain integration is another crucial area of innovation, with manufacturers focusing on optimizing the interplay between the electric motor, battery pack, and other components. Durability testing methods have evolved to simulate real-world conditions, ensuring e-SUVs meet the rigorous demands of consumers. Energy density metrics have gained prominence, with manufacturers striving to improve battery pack capacity and efficiency.
  • Emission standards compliance remains a priority, driving the development of cleaner, more efficient electric motor systems. Wheel drive configuration, vehicle stability control, and thermal management systems are also undergoing continuous refinement, enhancing e-SUV performance and driving comfort. Manufacturing processes have become more streamlined, with an emphasis on lightweight materials use and supply chain management. Performance optimization, connectivity technology, and infotainment system integration are key areas of competition, as e-SUVs increasingly offer advanced features to cater to the growing demand for convenience and entertainment. Battery cell chemistry, reliability analysis methods, and driver assistance features are other essential aspects of the e-SUV market, with manufacturers investing in research and development to stay ahead of the competition.
  • Efforts to improve DC-DC converter efficiency, electrical safety standards, and charging infrastructure needs are also underway, addressing consumer concerns and driving the adoption of e-SUVs. Autonomous driving technology, cybersecurity measures, vehicle-to-grid technology, fast charging technology, over-the-air updates, battery life expectancy, traction motor control, energy consumption modeling, and other emerging trends continue to shape the e-SUV market, making it an exciting and dynamic space to watch.

What are the Key Data Covered in this Electric Sports Utility Vehicle (E-Suv) Market Research and Growth Report?

  • What is the expected growth of the Electric Sports Utility Vehicle (E-Suv) Market between 2024 and 2028?

    • USD 181.1 billion, at a CAGR of 35.85%

  • What segmentation does the market report cover?

    • The report is segmented by Propulsion (Battery electric vehicle and Hybrid vehicle), Type (Small and medium size and Large size), and Geography (APAC, North America, Europe, South America, and Middle East and Africa)

  • Which regions are analyzed in the report?

    • APAC, North America, Europe, South America, and Middle East and Africa

  • What are the key growth drivers and market challenges?

    • Increasing demand and sales of BEVs in global market, High cost of ownership of e-SUVs

  • Who are the major players in the Electric Sports Utility Vehicle (E-Suv) Market?

    • AEHRA, Bayerische Motoren Werke AG, BYD Co. Ltd., Dr. Ing. h.c. F. Porsche AG, Ford Motor Co., General Motors Co., Honda Motor Co. Ltd., Hyundai Motor Co., KIA CORP., Mahindra and Mahindra Ltd., Maruti Suzuki India Ltd., Mercedes Benz Group AG, Nissan Motor Co. Ltd., Pravaig Dynamics Pvt Ltd., Renault SAS, Tata Motors Ltd., Tesla Inc., Toyota Motor Corp., Volkswagen AG, and Volvo Car Corp.

Market Research Insights

  • The market continues to gain momentum, with global sales projected to reach 12 million units by 2026, up from 2 million in 2021. This growth is driven by advancements in technology, consumer demand for sustainability, and government incentives. For instance, the adoption of range extender technology and high voltage architecture enhances e-SUVs' driving range and performance, while motor control algorithms and battery management systems optimize energy usage. Additionally, the integration of vehicle-to-grid systems and advanced driver-assistance features, such as lane keeping assistance and adaptive cruise control, further boosts market appeal. Notably, the use of brushless DC motors and power electronics cooling ensures efficient power conversion and thermal management.
  • As competition intensifies, e-SUV manufacturers focus on reducing charging time through faster charging infrastructure and improving battery pack design for increased energy density and longer life. Despite these advancements, challenges persist, including battery cell degradation and thermal runaway risks, which necessitate rigorous battery cell and motor performance testing.

We can help! Our analysts can customize this electric sports utility vehicle (e-suv) market research report to meet your requirements.

Get in touch

1 Executive Summary

  • 1.1 Market overview
    • Executive Summary - Chart on Market Overview
    • Executive Summary - Data Table on Market Overview
    • Executive Summary - Chart on Global Market Characteristics
    • Executive Summary - Chart on Market by Geography
    • Executive Summary - Chart on Market Segmentation by Propulsion
    • Executive Summary - Chart on Market Segmentation by Type
    • Executive Summary - Chart on Incremental Growth
    • Executive Summary - Data Table on Incremental Growth
    • Executive Summary - Chart on Company Market Positioning

2 Market Landscape

  • 2.1 Market ecosystem
    • Parent Market
    • Data Table on - Parent Market
  • 2.2 Market characteristics
    • Market characteristics analysis
  • 2.3 Value chain analysis
    • Value Chain Analysis

3 Market Sizing

  • 3.1 Market definition
    • Offerings of companies included in the market definition
  • 3.2 Market segment analysis
    • Market segments
  • 3.3 Market size 2023
    • 3.4 Market outlook: Forecast for 2023-2028
      • Chart on Global - Market size and forecast 2023-2028 ($ million)
      • Data Table on Global - Market size and forecast 2023-2028 ($ million)
      • Chart on Global Market: Year-over-year growth 2023-2028 (%)
      • Data Table on Global Market: Year-over-year growth 2023-2028 (%)

    4 Historic Market Size

    • 4.1 Global Electric Sports Utility Vehicle (E-SUV) Market 2018 - 2022
      • Historic Market Size - Data Table on Global Electric Sports Utility Vehicle (E-SUV) Market 2018 - 2022 ($ million)
    • 4.2 Propulsion segment analysis 2018 - 2022
      • Historic Market Size - Propulsion Segment 2018 - 2022 ($ million)
    • 4.3 Type segment analysis 2018 - 2022
      • Historic Market Size - Type Segment 2018 - 2022 ($ million)
    • 4.4 Geography segment analysis 2018 - 2022
      • Historic Market Size - Geography Segment 2018 - 2022 ($ million)
    • 4.5 Country segment analysis 2018 - 2022
      • Historic Market Size - Country Segment 2018 - 2022 ($ million)

    5 Five Forces Analysis

    • 5.1 Five forces summary
      • Five forces analysis - Comparison between 2023 and 2028
    • 5.2 Bargaining power of buyers
      • Bargaining power of buyers - Impact of key factors 2023 and 2028
    • 5.3 Bargaining power of suppliers
      • Bargaining power of suppliers - Impact of key factors in 2023 and 2028
    • 5.4 Threat of new entrants
      • Threat of new entrants - Impact of key factors in 2023 and 2028
    • 5.5 Threat of substitutes
      • Threat of substitutes - Impact of key factors in 2023 and 2028
    • 5.6 Threat of rivalry
      • Threat of rivalry - Impact of key factors in 2023 and 2028
    • 5.7 Market condition
      • Chart on Market condition - Five forces 2023 and 2028

    6 Market Segmentation by Propulsion

    • 6.1 Market segments
      • Chart on Propulsion - Market share 2023-2028 (%)
      • Data Table on Propulsion - Market share 2023-2028 (%)
    • 6.2 Comparison by Propulsion
      • Chart on Comparison by Propulsion
      • Data Table on Comparison by Propulsion
    • 6.3 Battery electric vehicle - Market size and forecast 2023-2028
      • Chart on Battery electric vehicle - Market size and forecast 2023-2028 ($ million)
      • Data Table on Battery electric vehicle - Market size and forecast 2023-2028 ($ million)
      • Chart on Battery electric vehicle - Year-over-year growth 2023-2028 (%)
      • Data Table on Battery electric vehicle - Year-over-year growth 2023-2028 (%)
    • 6.4 Hybrid vehicle - Market size and forecast 2023-2028
      • Chart on Hybrid vehicle - Market size and forecast 2023-2028 ($ million)
      • Data Table on Hybrid vehicle - Market size and forecast 2023-2028 ($ million)
      • Chart on Hybrid vehicle - Year-over-year growth 2023-2028 (%)
      • Data Table on Hybrid vehicle - Year-over-year growth 2023-2028 (%)
    • 6.5 Market opportunity by Propulsion
      • Market opportunity by Propulsion ($ million)
      • Data Table on Market opportunity by Propulsion ($ million)

    7 Market Segmentation by Type

    • 7.1 Market segments
      • Chart on Type - Market share 2023-2028 (%)
      • Data Table on Type - Market share 2023-2028 (%)
    • 7.2 Comparison by Type
      • Chart on Comparison by Type
      • Data Table on Comparison by Type
    • 7.3 Small and medium size - Market size and forecast 2023-2028
      • Chart on Small and medium size - Market size and forecast 2023-2028 ($ million)
      • Data Table on Small and medium size - Market size and forecast 2023-2028 ($ million)
      • Chart on Small and medium size - Year-over-year growth 2023-2028 (%)
      • Data Table on Small and medium size - Year-over-year growth 2023-2028 (%)
    • 7.4 Large size - Market size and forecast 2023-2028
      • Chart on Large size - Market size and forecast 2023-2028 ($ million)
      • Data Table on Large size - Market size and forecast 2023-2028 ($ million)
      • Chart on Large size - Year-over-year growth 2023-2028 (%)
      • Data Table on Large size - Year-over-year growth 2023-2028 (%)
    • 7.5 Market opportunity by Type
      • Market opportunity by Type ($ million)
      • Data Table on Market opportunity by Type ($ million)

    8 Customer Landscape

    • 8.1 Customer landscape overview
      • Analysis of price sensitivity, lifecycle, customer purchase basket, adoption rates, and purchase criteria

    9 Geographic Landscape

    • 9.1 Geographic segmentation
      • Chart on Market share by geography 2023-2028 (%)
      • Data Table on Market share by geography 2023-2028 (%)
    • 9.2 Geographic comparison
      • Chart on Geographic comparison
      • Data Table on Geographic comparison
    • 9.3 APAC - Market size and forecast 2023-2028
      • Chart on APAC - Market size and forecast 2023-2028 ($ million)
      • Data Table on APAC - Market size and forecast 2023-2028 ($ million)
      • Chart on APAC - Year-over-year growth 2023-2028 (%)
      • Data Table on APAC - Year-over-year growth 2023-2028 (%)
    • 9.4 North America - Market size and forecast 2023-2028
      • Chart on North America - Market size and forecast 2023-2028 ($ million)
      • Data Table on North America - Market size and forecast 2023-2028 ($ million)
      • Chart on North America - Year-over-year growth 2023-2028 (%)
      • Data Table on North America - Year-over-year growth 2023-2028 (%)
    • 9.5 Europe - Market size and forecast 2023-2028
      • Chart on Europe - Market size and forecast 2023-2028 ($ million)
      • Data Table on Europe - Market size and forecast 2023-2028 ($ million)
      • Chart on Europe - Year-over-year growth 2023-2028 (%)
      • Data Table on Europe - Year-over-year growth 2023-2028 (%)
    • 9.6 South America - Market size and forecast 2023-2028
      • Chart on South America - Market size and forecast 2023-2028 ($ million)
      • Data Table on South America - Market size and forecast 2023-2028 ($ million)
      • Chart on South America - Year-over-year growth 2023-2028 (%)
      • Data Table on South America - Year-over-year growth 2023-2028 (%)
    • 9.7 Middle East and Africa - Market size and forecast 2023-2028
      • Chart on Middle East and Africa - Market size and forecast 2023-2028 ($ million)
      • Data Table on Middle East and Africa - Market size and forecast 2023-2028 ($ million)
      • Chart on Middle East and Africa - Year-over-year growth 2023-2028 (%)
      • Data Table on Middle East and Africa - Year-over-year growth 2023-2028 (%)
    • 9.8 China - Market size and forecast 2023-2028
      • Chart on China - Market size and forecast 2023-2028 ($ million)
      • Data Table on China - Market size and forecast 2023-2028 ($ million)
      • Chart on China - Year-over-year growth 2023-2028 (%)
      • Data Table on China - Year-over-year growth 2023-2028 (%)
    • 9.9 US - Market size and forecast 2023-2028
      • Chart on US - Market size and forecast 2023-2028 ($ million)
      • Data Table on US - Market size and forecast 2023-2028 ($ million)
      • Chart on US - Year-over-year growth 2023-2028 (%)
      • Data Table on US - Year-over-year growth 2023-2028 (%)
    • 9.10 Norway - Market size and forecast 2023-2028
      • Chart on Norway - Market size and forecast 2023-2028 ($ million)
      • Data Table on Norway - Market size and forecast 2023-2028 ($ million)
      • Chart on Norway - Year-over-year growth 2023-2028 (%)
      • Data Table on Norway - Year-over-year growth 2023-2028 (%)
    • 9.11 Germany - Market size and forecast 2023-2028
      • Chart on Germany - Market size and forecast 2023-2028 ($ million)
      • Data Table on Germany - Market size and forecast 2023-2028 ($ million)
      • Chart on Germany - Year-over-year growth 2023-2028 (%)
      • Data Table on Germany - Year-over-year growth 2023-2028 (%)
    • 9.12 Japan - Market size and forecast 2023-2028
      • Chart on Japan - Market size and forecast 2023-2028 ($ million)
      • Data Table on Japan - Market size and forecast 2023-2028 ($ million)
      • Chart on Japan - Year-over-year growth 2023-2028 (%)
      • Data Table on Japan - Year-over-year growth 2023-2028 (%)
    • 9.13 Market opportunity by geography
      • Market opportunity by geography ($ million)
      • Data Tables on Market opportunity by geography ($ million)

    10 Drivers, Challenges, and Opportunity/Restraints

    • 10.1 Market drivers
      • 10.2 Market challenges
        • 10.3 Impact of drivers and challenges
          • Impact of drivers and challenges in 2023 and 2028
        • 10.4 Market opportunities/restraints

          11 Competitive Landscape

          • 11.1 Overview
            • 11.2 Competitive Landscape
              • Overview on criticality of inputs and factors of differentiation
            • 11.3 Landscape disruption
              • Overview on factors of disruption
            • 11.4 Industry risks
              • Impact of key risks on business

            12 Competitive Analysis

            • 12.1 Companies profiled
              • Companies covered
            • 12.2 Market positioning of companies
              • Matrix on companies position and classification
            • 12.3 Bayerische Motoren Werke AG
              • Bayerische Motoren Werke AG - Overview
              • Bayerische Motoren Werke AG - Business segments
              • Bayerische Motoren Werke AG - Key news
              • Bayerische Motoren Werke AG - Key offerings
              • Bayerische Motoren Werke AG - Segment focus
            • 12.4 BYD Co. Ltd.
              • BYD Co. Ltd. - Overview
              • BYD Co. Ltd. - Business segments
              • BYD Co. Ltd. - Key offerings
              • BYD Co. Ltd. - Segment focus
            • 12.5 Dr. Ing. h.c. F. Porsche AG
              • Dr. Ing. h.c. F. Porsche AG - Overview
              • Dr. Ing. h.c. F. Porsche AG - Product / Service
              • Dr. Ing. h.c. F. Porsche AG - Key offerings
            • 12.6 Ford Motor Co.
              • Ford Motor Co. - Overview
              • Ford Motor Co. - Business segments
              • Ford Motor Co. - Key news
              • Ford Motor Co. - Key offerings
              • Ford Motor Co. - Segment focus
            • 12.7 Honda Motor Co. Ltd.
              • Honda Motor Co. Ltd. - Overview
              • Honda Motor Co. Ltd. - Business segments
              • Honda Motor Co. Ltd. - Key news
              • Honda Motor Co. Ltd. - Key offerings
              • Honda Motor Co. Ltd. - Segment focus
            • 12.8 Hyundai Motor Co.
              • Hyundai Motor Co. - Overview
              • Hyundai Motor Co. - Business segments
              • Hyundai Motor Co. - Key news
              • Hyundai Motor Co. - Key offerings
              • Hyundai Motor Co. - Segment focus
            • 12.9 KIA CORP.
              • KIA CORP. - Overview
              • KIA CORP. - Product / Service
              • KIA CORP. - Key offerings
            • 12.10 Mercedes Benz Group AG
              • Mercedes Benz Group AG - Overview
              • Mercedes Benz Group AG - Business segments
              • Mercedes Benz Group AG - Key news
              • Mercedes Benz Group AG - Key offerings
              • Mercedes Benz Group AG - Segment focus
            • 12.11 Nissan Motor Co. Ltd.
              • Nissan Motor Co. Ltd. - Overview
              • Nissan Motor Co. Ltd. - Business segments
              • Nissan Motor Co. Ltd. - Key news
              • Nissan Motor Co. Ltd. - Key offerings
              • Nissan Motor Co. Ltd. - Segment focus
            • 12.12 Renault SAS
              • Renault SAS - Overview
              • Renault SAS - Product / Service
              • Renault SAS - Key news
              • Renault SAS - Key offerings
            • 12.13 Tata Motors Ltd.
              • Tata Motors Ltd. - Overview
              • Tata Motors Ltd. - Business segments
              • Tata Motors Ltd. - Key news
              • Tata Motors Ltd. - Key offerings
              • Tata Motors Ltd. - Segment focus
            • 12.14 Tesla Inc.
              • Tesla Inc. - Overview
              • Tesla Inc. - Business segments
              • Tesla Inc. - Key news
              • Tesla Inc. - Key offerings
              • Tesla Inc. - Segment focus
            • 12.15 Toyota Motor Corp.
              • Toyota Motor Corp. - Overview
              • Toyota Motor Corp. - Business segments
              • Toyota Motor Corp. - Key news
              • Toyota Motor Corp. - Key offerings
              • Toyota Motor Corp. - Segment focus
            • 12.16 Volkswagen AG
              • Volkswagen AG - Overview
              • Volkswagen AG - Business segments
              • Volkswagen AG - Key news
              • Volkswagen AG - Key offerings
              • Volkswagen AG - Segment focus
            • 12.17 Volvo Car Corp.
              • Volvo Car Corp. - Overview
              • Volvo Car Corp. - Product / Service
              • Volvo Car Corp. - Key offerings

            13 Appendix

            • 13.1 Scope of the report
              • 13.2 Inclusions and exclusions checklist
                • Inclusions checklist
                • Exclusions checklist
              • 13.3 Currency conversion rates for US$
                • Currency conversion rates for US$
              • 13.4 Research methodology
                • Research methodology
              • 13.5 Data procurement
                • Information sources
              • 13.6 Data validation
                • Data validation
              • 13.7 Validation techniques employed for market sizing
                • Validation techniques employed for market sizing
              • 13.8 Data synthesis
                • Data synthesis
              • 13.9 360 degree market analysis
                • 360 degree market analysis
              • 13.10 List of abbreviations
                • List of abbreviations

              Research Methodology

              Technavio presents a detailed picture of the market by way of study, synthesis, and summation of data from multiple sources. The analysts have presented the various facets of the market with a particular focus on identifying the key industry influencers. The data thus presented is comprehensive, reliable, and the result of extensive research, both primary and secondary.

              INFORMATION SOURCES

              Primary sources

              • Manufacturers and suppliers
              • Channel partners
              • Industry experts
              • Strategic decision makers

              Secondary sources

              • Industry journals and periodicals
              • Government data
              • Financial reports of key industry players
              • Historical data
              • Press releases

              DATA ANALYSIS

              Data Synthesis

              • Collation of data
              • Estimation of key figures
              • Analysis of derived insights

              Data Validation

              • Triangulation with data models
              • Reference against proprietary databases
              • Corroboration with industry experts

              REPORT WRITING

              Qualitative

              • Market drivers
              • Market challenges
              • Market trends
              • Five forces analysis

              Quantitative

              • Market size and forecast
              • Market segmentation
              • Geographical insights
              • Competitive landscape

              Interested in this report?

              Get your sample now to see our research methodology and insights!

              Download Now

              Frequently Asked Questions

              Electric Sports Utility Vehicle (E-Suv) market growth will increase by $ 181.1 bn during 2024-2028 .

              The Electric Sports Utility Vehicle (E-Suv) market is expected to grow at a CAGR of 35.85% during 2024-2028 .

              Electric Sports Utility Vehicle (E-Suv) market is segmented by Propulsion( Battery electric vehicle, Hybrid vehicle) Type( Small and medium size, Large size, Large size)

              AEHRA, Bayerische Motoren Werke AG, BYD Co. Ltd., Dr. Ing. h.c. F. Porsche AG, Ford Motor Co., General Motors Co., Honda Motor Co. Ltd., Hyundai Motor Co., KIA CORP., Mahindra and Mahindra Ltd., Maruti Suzuki India Ltd., Mercedes Benz Group AG, Nissan Motor Co. Ltd., Pravaig Dynamics Pvt Ltd., Renault SAS, Tata Motors Ltd., Tesla Inc., Toyota Motor Corp., Volkswagen AG, Volvo Car Corp. are a few of the key vendors in the Electric Sports Utility Vehicle (E-Suv) market.

              APAC will register the highest growth rate of 34% among the other regions. Therefore, the Electric Sports Utility Vehicle (E-Suv) market in APAC is expected to garner significant business opportunities for the vendors during the forecast period.

              China, US, Norway, Germany, Japan

              • Increasing demand and sales of BEVs in global marketThe global demand for EVs is increasing year on year. The sales of BEVs recorded significant growth in 2021 globally is the driving factor this market.
              • especially in China and the US and a few countries in Europe. BEVs have witnessed considerable growth in sales in the last five years worldwide.  In 2021 is the driving factor this market.
              • the global deliveries of EVs surpassed 7 million units. These included the sales of plug-in hybrid vehicles and BEVs. However is the driving factor this market.
              • all e-SUVs contributed more than 60% of global EV sales. In terms of geography is the driving factor this market.
              • China dominated global BEV sales in terms of units delivered. Europe and US followed China in the number of BEV deliveries. The number of BEV manufacturers has increased in China over the past couple of years. This is due to the growing demand for new energy vehicles in the country. As a result is the driving factor this market.
              • the Chinese manufacturers of all e-SUVs is the driving factor this market.
              • such as BYD Co and BAIC is the driving factor this market.
              • are witnessing increased demand for BEVs is the driving factor this market.
              • leading to significant growth in sales volumes. In addition is the driving factor this market.
              • the presence of BEVs supporting infrastructure is the driving factor this market.
              • government regulations is the driving factor this market.
              • and subsidies and incentives on the use of all-EVs are a few important factors driving the growth of the all-e-SUVs market in China. In Europe is the driving factor this market.
              • countries such as Norway is the driving factor this market.
              • the Netherlands is the driving factor this market.
              • Germany is the driving factor this market.
              • Iceland is the driving factor this market.
              • and Poland dominated the regional sales. In North America is the driving factor this market.
              • the US contributed to significant sales of e-SUVs in 2022. Therefore is the driving factor this market.
              • the growing demand and sales of BEVs in these countries and regions will drive the growth of the global electric sports utility vehicle (e-SUV) market during the forecast period. is the driving factor this market.

              The Electric Sports Utility Vehicle (E-Suv) market vendors should focus on grabbing business opportunities from the Battery electric vehicle segment as it accounted for the largest market share in the base year.