Battery Pack Market Analysis APAC, Europe, North America, South America, Middle East and Africa - US, China, Japan, India, Germany - Size and Forecast 2024-2028

Battery Pack Market Analysis APAC, Europe, North America, South America, Middle East and Africa - US, China, Japan, India, Germany - Size and Forecast 2024-2028

Published: May 2024 180 Pages SKU: IRTNTR77897

Market Overview at a Glance

$124.4 B
Market Opportunity
14.48%
CAGR
13.08
YoY growth 2023-2024(%)

Battery Pack Market Size 2024-2028 

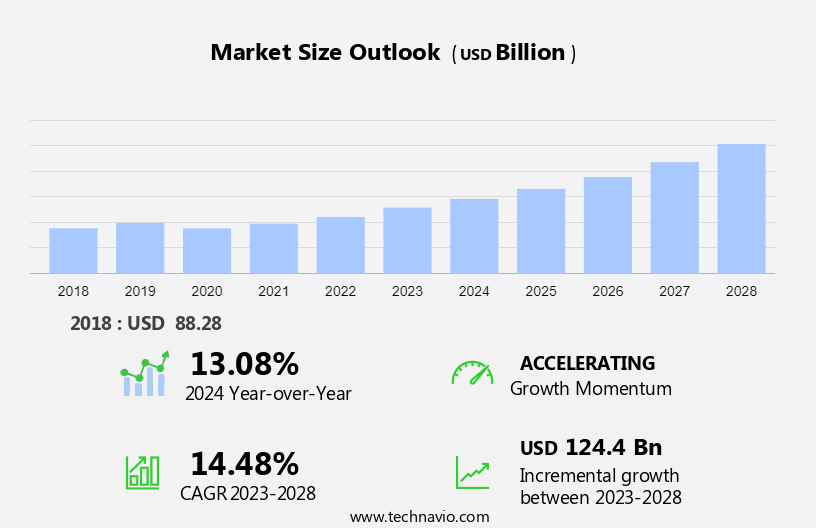
The battery pack market size is forecast to increase by USD 124.4 billion at a CAGR of 14.48% between 2023 and 2028. The market is experiencing significant growth, driven by several key trends and factors. One notable trend is the increase in mergers and acquisitions among market companies, reflecting the competitive nature of the industry and the quest for innovation and market dominance. Another growth factor is the expansion of renewable energy storage applications, as governments and businesses seek sustainable energy solutions. However, high costs associated with battery packs remain a challenge, limiting widespread adoption in certain industries and applications. Despite this, the market is expected to continue its strong growth trajectory, fueled by technological advancements and increasing demand for energy storage solutions.

Market Analysis

Battery Pack Market Size

 Request Free Sample

The market is witnessing significant growth due to the increasing demand for lithium-ion batteries in various applications such as portable electronics, electric vehicles (EVs), military, aerospace, and continuous energy. Lithium-ion batteries have become the preferred choice for these applications due to their high power capacity and long-lasting performance. The market is segmented into battery packs for electric vehicles, hybrid vehicles, consumer electronics, and others. The electric vehicle segment is expected to dominate the market due to the increasing sales of electric cars and the need to reduce carbon footprint and greenhouse gas emissions. Battery packaging solutions play a crucial role in ensuring the safety and reliability of batteries.

Moreover, the market for battery packaging solutions is expected to grow in tandem with the market. The voltage of battery packs is also a crucial factor influencing the market's growth. The market for lead-acid batteries is expected to face stiff competition from lithium-ion batteries due to their superior performance and longer life cycle. The market is expected to continue its growth trajectory in the coming years, driven by the increasing demand for clean energy and the need to reduce reliance on fossil fuels.

Market Segmentation

The market research report provides comprehensive data (region-wise segment analysis), with forecasts and estimates in "USD billion" for the period 2024-2028, as well as historical data from 2018-2022 for the following segments.

  • Application
    • Automotive
    • Industrial
    • Others
  • Type
    • Lithium-ion (Li-ion)
    • Sodium-ion
    • Others
  • Geography
    • APAC
      • China
      • India
      • Japan
    • Europe
      • Germany
    • North America
      • US
    • South America
    • Middle East and Africa

By Application Insights

The automotive segment is estimated to witness significant growth during the forecast period. The market is witnessing significant growth due to the increasing adoption of lithium-ion batteries in portable electronics, electric vehicles (EVs), military, aerospace, and renewable energy projects. Strict emission regulations and targets imposed by governments worldwide are driving the demand for EVs and hybrid electric vehicles (HEVs) to reduce carbon footprint and combat climate change. This regulatory pressure is leading to an increase in the production and demand for battery packs as the primary energy storage solution in EVs and HEVs. Continuous advancements in battery technology, including improvements in energy density, voltage capacity, and charging time, are enhancing the performance and driving range of EVs and HEVs.

Moreover, the proliferation of portable electronic devices such as smartphones, laptops, tablets, and wearables, as well as the growing popularity of marine vessels, is increasing the demand for small-sized batteries. However, factors such as battery size, electricity consumption, charging infrastructure, and self-discharge rate are critical considerations for battery packaging solutions. The battery packaging market is offering innovative solutions to address these challenges, including lightweight, compact, and durable packaging materials, as well as advanced cooling systems to ensure optimal battery performance and safety.

Additionally, the increasing use of renewable energy projects and the need for energy storage solutions are providing new opportunities for battery packaging solutions. Despite the benefits, challenges such as the high sulfur content in lead-acid batteries, pollution, and air pollutants, as well as transportation regulations, are limiting the growth of the market. However, the increasing focus on reducing the use of fossil fuels and the shift towards renewable energy sources is expected to drive the market's growth in the coming years.

Battery Pack Market Size

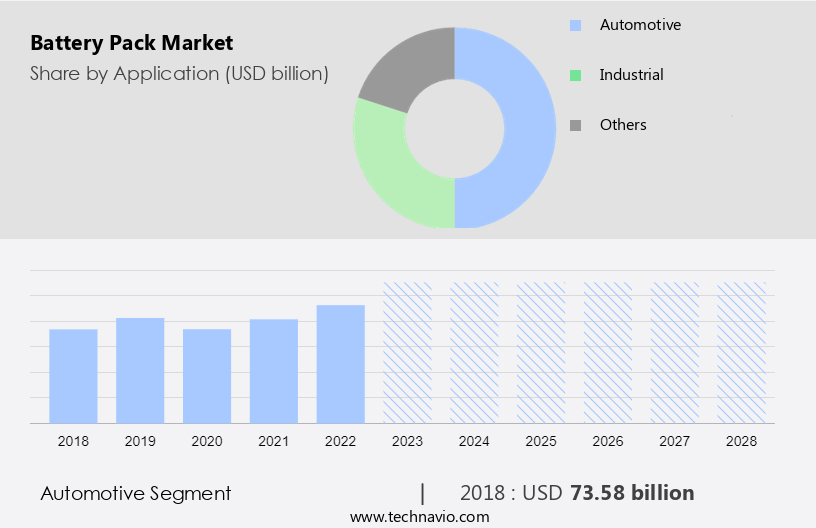
Get a glance at the market share of various segments Request Free Sample

The automotive segment was valued at USD 73.58 billion in 2018 and showed a gradual increase during the forecast period.

Regional Insights

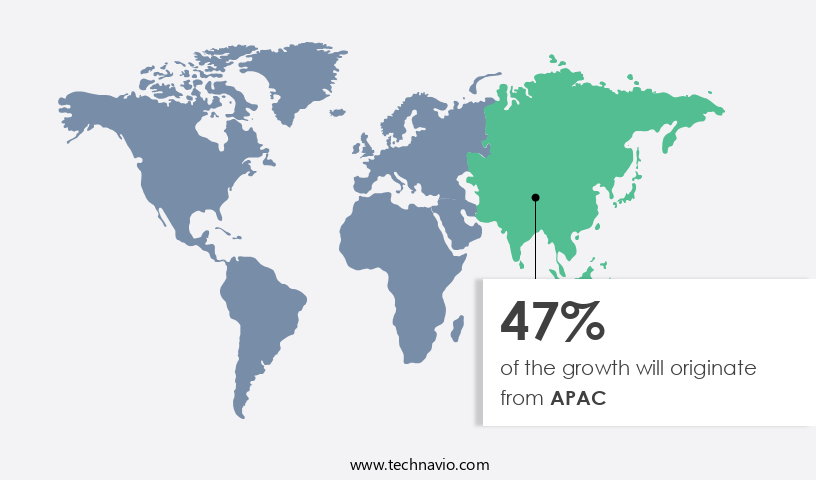
APAC is estimated to contribute 47% to the growth of the global market during the forecast period. Technavio's analysts have elaborately explained the regional trends and drivers that shape the market during the forecast period.

Battery Pack Market Share by Geography

For more insights on the market share of various regions Request Free Sample

The market is witnessing significant growth, particularly in the sector of Hybrid Vehicles, due to advancements in Battery Technology. The integration of Renewable Energy sources, such as Solar Power and Wind Power, into Energy Storage Systems is driving the demand for high-performance Battery Cells with increased Power Capacity and Voltage. The Electric Mobility sector, including Consumer Electronics, Transportation, and Aerospace and Defense, is a major consumer of these batteries. In the APAC region, which is a global leader in EV production and adoption, the demand for advanced Battery Types is escalating. Government initiatives to promote cleaner transportation and consumer preference for eco-friendly options are fueling this growth.

Furthermore, the increasing number of Renewable Energy Installations in the region is creating a need for efficient Battery Storage Systems. Major players in the market who are based in the region and contributing significantly to the market growth.

Market Dynamics

Our researchers analyzed the data with 2023 as the base year, along with the key drivers, trends, and challenges. A holistic analysis of drivers will help companies refine their marketing strategies to gain a competitive advantage.

Market Driver

Increase in number of mergers and acquisitions by market companies is the key driver of the market. The market is characterized by a high level of competition among various players. Companies in this industry are continually seeking ways to expand their market presence and improve their offerings. One strategy for achieving this is through mergers and acquisitions. By acquiring complementary businesses, battery pack companies can vertically integrate their operations, gaining control over the entire value chain from battery cell manufacturing to distribution. This reduces dependence on external suppliers, enhances supply chain efficiency, and ultimately lowers costs.

Moreover, this move enables Honda to enter the electric vehicle market with a competitive and locally sourced battery solution. Battery packs are essential components in various applications, including portable electronics, electric vehicles, military, aerospace, and marine vessels. As the demand for renewable energy projects and the proliferation of portable electronic devices continues to grow, the need for high-performance battery packs with optimal energy density, voltage capacity, and charging time becomes increasingly important. Moreover, as transportation regulations become more stringent, the adoption of electric vehicles is accelerating. Electric car sales are on the rise, and battery packs play a crucial role in their success.

Further, in this context, battery packaging solutions are gaining importance to ensure the safety, reliability, and efficiency of these battery packs. Battery packs come in various sizes, from small-sized batteries for portable electronic devices to large-scale battery packs for electric vehicles and renewable energy projects. The choice of battery technology, such as lithium-ion or lead-acid, depends on the specific application requirements. Battery packs are not only essential for powering electric vehicles and portable electronics but also play a significant role in reducing carbon footprint and greenhouse gas emissions by replacing fossil fuels. The transition to renewable energy sources and the development of charging infrastructure are crucial factors driving the growth of the market.

However, battery packs also pose challenges, such as self-discharge rate and pollution concerns. Marine vessels, for instance, use bunker fuel, which contributes significantly to air pollutants and greenhouse gas emissions. Replacing bunker fuel with battery packs can help reduce these emissions. Nevertheless, the high sulfur content in bunker fuel can affect battery performance and require specialized battery packaging solutions. In conclusion, the market is a dynamic and evolving industry, with various players competing to offer innovative and high-performance battery pack solutions for various applications. Vertical integration, mergers and acquisitions, and partnerships are essential strategies for battery pack companies to stay competitive and meet the growing demand for energy storage solutions.

The transition to renewable energy sources and the development of charging infrastructure are crucial factors driving the growth of the market. However, challenges such as self-discharge rate and pollution concerns necessitate ongoing research and development efforts to improve battery performance and safety.

Market Trends

Growth in renewable energy storage is the upcoming trend in the market. Lithium-ion battery packs have gained significant importance in various industries due to their high energy density, voltage capacity, and long charging time. These batteries are extensively used in portable electronics, electric vehicles (EVs), military, aerospace, and marine vessels to provide continuous energy and reduce carbon footprint and greenhouse gas emissions. Renewable energy projects, such as solar and wind, generate intermittent power. Battery packs, specifically lithium-ion and flow batteries, serve as crucial energy storage solutions, enabling the integration of these renewables into the power grid and balancing electricity consumption during peak and off-peak hours. As the world transitions away from fossil fuels, the demand for battery packs is increasing.

Moreover, in the transportation sector, the proliferation of electric cars and the need for charging infrastructure necessitate the use of battery packs. Similarly, in the context of renewable energy projects, battery packs help mitigate the intermittency of solar and wind power. In addition, battery packs are essential for military, aerospace, and marine applications, where continuous power supply is necessary. Battery packs come in various sizes, from small-sized batteries for portable electronic devices like smartphones, laptops, tablets, and wearables to large-scale battery packs for electric vehicles and renewable energy projects. The battery packaging market offers innovative solutions to address the challenges of battery size, energy consumption, and charging time.

With the increasing focus on reducing pollution and air pollutants, battery packs are expected to play a pivotal role in the transition to a more sustainable energy future. The self-discharge rate and battery packaging solutions are critical factors that influence the overall performance and efficiency of battery packs.

Market Challenge

High costs associated with battery packs is a key challenge affecting the market growth. The market encompasses the production and supply of various types of battery packs, including lithium-ion batteries, for use in diverse applications such as portable electronics, electric vehicles (EVs), military, aerospace, marine vessels, and renewable energy projects. The materials used in battery production, including lithium, cobalt, nickel, and graphite, contribute significantly to the cost of battery packs due to their expensive nature and price volatility. For instance, cobalt, a crucial component in some lithium-ion batteries, has experienced price fluctuations due to supply chain constraints and ethical concerns regarding mining practices. To address these challenges, battery manufacturing companies invest heavily in research and development (R&D) to improve battery energy density, safety, cycle life, and other performance parameters.

However, this investment adds to the overall cost of battery packs, particularly for advanced technologies. Additionally, the proliferation of portable electronic devices, such as smartphones, laptops, tablets, and wearables, and the increasing sales of electric cars further drive the demand for battery packs, necessitating the development of efficient battery packaging solutions to meet the growing energy storage requirements while minimizing carbon footprint and reducing greenhouse gas emissions, ultimately transitioning from fossil fuels to renewable energy sources. The battery packaging market offers various solutions to cater to the diverse needs of different applications, focusing on factors such as battery size, voltage capacity, charging time, electricity consumption, self-discharge rate, and charging infrastructure. The transportation sector, including EVs, is subject to stringent regulations, further emphasizing the importance of battery performance and safety.

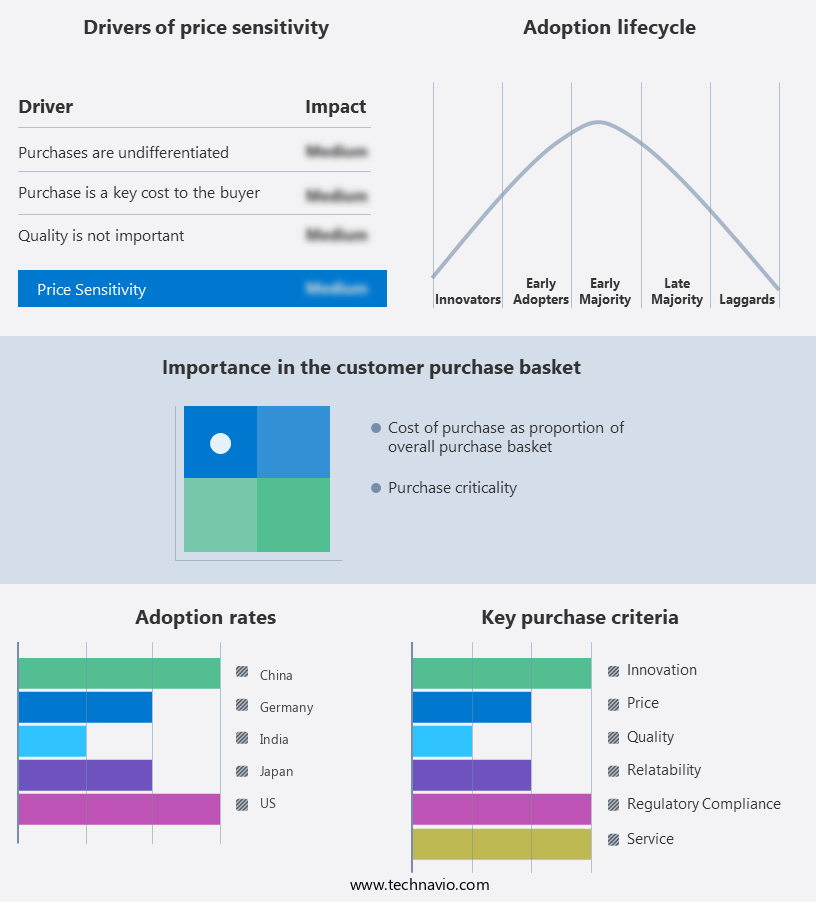
Exclusive Customer Landscape

The market forecasting report includes the adoption lifecycle of the market, covering from the innovator's stage to the laggard's stage. It focuses on adoption rates in different regions based on penetration. Furthermore, the report also includes key purchase criteria and drivers of price sensitivity to help companies evaluate and develop their market growth analysis strategies.

Battery Pack Market Share by Geography

 Customer Landscape

Key Companies & Market Insights

Companies are implementing various strategies, such as strategic alliances, partnerships, mergers and acquisitions, geographical expansion, and product/service launches, to enhance their presence in the market.

East Penn Manufacturing Co. Inc.: The company offers battery pack such as Deka Ready Power Lithium-ion batteries with high intensity performance for Class I, II, and III trucks.

The market research and growth report includes detailed analyses of the competitive landscape of the market and information about key companies, including:

  • Berkshire Hathaway Inc.
  • BYD Co. Ltd.
  • CLARIOS LLC
  • Contemporary Amperex Technology Co. Ltd.
  • East Penn Manufacturing Co. Inc.
  • EnerSys
  • Eveready Industries India Ltd.
  • Freudenberg and Co. KG
  • GS Yuasa International Ltd.
  • Hitachi Ltd.
  • Johnson Controls
  • Kabra Extrusiontechnik Ltd.
  • Leoch International Technology Ltd.
  • LG Electronics Inc.
  • Nikola Corp.
  • NIO Ltd.
  • Panasonic Holdings Corp.
  • Samsung Electronics Co. Ltd.
  • Tesla Inc.
  • Toshiba Corp.
  • TotalEnergies SE
  • VARTA AG
  • Wanxiang Group

Qualitative and quantitative analysis of companies has been conducted to help clients understand the wider business environment as well as the strengths and weaknesses of key market players. Data is qualitatively analyzed to categorize companies as pure play, category-focused, industry-focused, and diversified; it is quantitatively analyzed to categorize companies as dominant, leading, strong, tentative, and weak.

Research Analyst Overview

The market is witnessing significant growth due to the increasing demand for portable electronics, electric vehicles (EVs), and renewable energy projects. Lithium-ion batteries have emerged as the preferred choice due to their high energy density, voltage capacity, and shorter charging time. Portable electronics, including smartphones, laptops, tablets, and wearables, are fueling the growth of the market. The proliferation of these devices has led to an increase in electricity consumption, necessitating the need for efficient and compact battery solutions. The transportation sector, particularly the electric vehicle industry, is another major contributor to the market.

Moreover, EV sales are on the rise, and battery packs play a crucial role in powering these vehicles. The demand for larger battery packs in EVs is increasing due to the need for longer driving ranges and faster charging times. The military and aerospace industries also rely heavily on battery packs for continuous energy supply in remote locations. In addition, the marine vessels industry is adopting battery packs as an alternative to bunker fuel to reduce carbon footprint and greenhouse gas emissions. Battery packaging solutions are essential to ensure the safety and durability of batteries. These solutions help in reducing self-discharge rate, improving battery life, and ensuring proper ventilation.

Similarly, the battery packaging market is expected to grow further due to the increasing focus on renewable energy projects and the need for reliable energy storage solutions. The market is also being driven by stringent transportation regulations aimed at reducing pollution and air pollutants, particularly those with high sulfur content. In conclusion, the market is poised for significant growth in the coming years, driven by the increasing demand for portable electronics, electric vehicles, and renewable energy projects. The market is expected to continue to evolve, with a focus on improving energy density, voltage capacity, and charging time while reducing battery size and carbon footprint.

Market Scope

Report Coverage

Details

Page number

180

Base year

2023

Historic period

2018-2022

Forecast period

2024-2028

Growth momentum & CAGR

Accelerate at a CAGR of 14.48%

Market growth 2024-2028

USD 124.4 billion

Market structure

Fragmented

YoY growth 2023-2024(%)

13.08

Regional analysis

APAC, Europe, North America, South America, and Middle East and Africa

Performing market contribution

APAC at 47%

Key countries

US, China, Japan, India, and Germany

Competitive landscape

Leading Companies, Market Positioning of Companies, Competitive Strategies, and Industry Risks

Key companies profiled

Berkshire Hathaway Inc., BYD Co. Ltd., CLARIOS LLC, Contemporary Amperex Technology Co. Ltd., East Penn Manufacturing Co. Inc., EnerSys, Eveready Industries India Ltd., Freudenberg and Co. KG, GS Yuasa International Ltd., Hitachi Ltd., Johnson Controls, Kabra Extrusiontechnik Ltd., Leoch International Technology Ltd., LG Electronics Inc., Nikola Corp., NIO Ltd., Panasonic Holdings Corp., Samsung Electronics Co. Ltd., Tesla Inc., Toshiba Corp., TotalEnergies SE, VARTA AG, and Wanxiang Group

Market dynamics

Parent market analysis, market growth inducers and obstacles, market forecast, fast-growing and slow-growing segment analysis, COVID-19 impact and recovery analysis and future consumer dynamics, market condition analysis for the forecast period

Customization purview

If our market report has not included the data that you are looking for, you can reach out to our analysts and get segments customized.

Request Free Sample

What are the Key Data Covered in this Market Research and Growth Report?

  • CAGR of the market during the forecast period
  • Detailed information on factors that will drive the market growth and forecasting between 2024 and 2028
  • Precise estimation of the size of the market  and its contribution of the market in focus to the parent market
  • Accurate predictions about upcoming market growth and trends and changes in consumer behaviour
  • Growth of the market across APAC, Europe, North America, South America, and Middle East and Africa
  • Thorough analysis of the market's competitive landscape and detailed information about companies
  • Comprehensive analysis of factors that will challenge the growth of market companies

We can help! Our analysts can customize this market research report to meet your requirements. Get in touch

1 Executive Summary

  • 1.1 Market overview
    • Exhibit 01: Executive Summary – Chart on Market Overview
    • Exhibit 02: Executive Summary – Data Table on Market Overview
    • Exhibit 03: Executive Summary – Chart on Global Market Characteristics
    • Exhibit 04: Executive Summary – Chart on Market by Geography
    • Exhibit 05: Executive Summary – Chart on Market Segmentation by Application
    • Exhibit 06: Executive Summary – Chart on Market Segmentation by Type
    • Exhibit 07: Executive Summary – Chart on Incremental Growth
    • Exhibit 08: Executive Summary – Data Table on Incremental Growth
    • Exhibit 09: Executive Summary – Chart on Vendor Market Positioning

2 Market Landscape

  • 2.1 Market ecosystem
    • Exhibit 10: Parent market
    • Exhibit 11: Market Characteristics

3 Market Sizing

  • 3.1 Market definition
    • Exhibit 12: Offerings of vendors included in the market definition
  • 3.2 Market segment analysis
    • Exhibit 13: Market segments
  • 3.3 Market size 2023
    • 3.4 Market outlook: Forecast for 2023-2028
      • Exhibit 14: Chart on Global - Market size and forecast 2023-2028 ($ billion)
      • Exhibit 15: Data Table on Global - Market size and forecast 2023-2028 ($ billion)
      • Exhibit 16: Chart on Global Market: Year-over-year growth 2023-2028 (%)
      • Exhibit 17: Data Table on Global Market: Year-over-year growth 2023-2028 (%)

    4 Historic Market Size

    • 4.1 Global battery pack market 2018 - 2022
      • Exhibit 18: Historic Market Size – Data Table on global battery pack market 2018 - 2022 ($ billion)
    • 4.2 Application Segment Analysis 2018 - 2022
      • Exhibit 19: Historic Market Size – Application Segment 2018 - 2022 ($ billion)
    • 4.3 Type Segment Analysis 2018 - 2022
      • Exhibit 20: Historic Market Size – Type Segment 2018 - 2022 ($ billion)
    • 4.4 Geography Segment Analysis 2018 - 2022
      • Exhibit 21: Historic Market Size – Geography Segment 2018 - 2022 ($ billion)
    • 4.5 Country Segment Analysis 2018 - 2022
      • Exhibit 22: Historic Market Size – Country Segment 2018 - 2022 ($ billion)

    5 Five Forces Analysis

    • 5.1 Five forces summary
      • Exhibit 23: Five forces analysis - Comparison between 2023 and 2028
    • 5.2 Bargaining power of buyers
      • Exhibit 24: Chart on Bargaining power of buyers – Impact of key factors 2023 and 2028
    • 5.3 Bargaining power of suppliers
      • Exhibit 25: Bargaining power of suppliers – Impact of key factors in 2023 and 2028
    • 5.4 Threat of new entrants
      • Exhibit 26: Threat of new entrants – Impact of key factors in 2023 and 2028
    • 5.5 Threat of substitutes
      • Exhibit 27: Threat of substitutes – Impact of key factors in 2023 and 2028
    • 5.6 Threat of rivalry
      • Exhibit 28: Threat of rivalry – Impact of key factors in 2023 and 2028
    • 5.7 Market condition
      • Exhibit 29: Chart on Market condition - Five forces 2023 and 2028

    6 Market Segmentation by Application

    • 6.1 Market segments
      • Exhibit 30: Chart on Application - Market share 2023-2028 (%)
      • Exhibit 31: Data Table on Application - Market share 2023-2028 (%)
    • 6.2 Comparison by Application
      • Exhibit 32: Chart on Comparison by Application
      • Exhibit 33: Data Table on Comparison by Application
    • 6.3 Automotive - Market size and forecast 2023-2028
      • Exhibit 34: Chart on Automotive - Market size and forecast 2023-2028 ($ billion)
      • Exhibit 35: Data Table on Automotive - Market size and forecast 2023-2028 ($ billion)
      • Exhibit 36: Chart on Automotive - Year-over-year growth 2023-2028 (%)
      • Exhibit 37: Data Table on Automotive - Year-over-year growth 2023-2028 (%)
    • 6.4 Industrial - Market size and forecast 2023-2028
      • Exhibit 38: Chart on Industrial - Market size and forecast 2023-2028 ($ billion)
      • Exhibit 39: Data Table on Industrial - Market size and forecast 2023-2028 ($ billion)
      • Exhibit 40: Chart on Industrial - Year-over-year growth 2023-2028 (%)
      • Exhibit 41: Data Table on Industrial - Year-over-year growth 2023-2028 (%)
    • 6.5 Others - Market size and forecast 2023-2028
      • Exhibit 42: Chart on Others - Market size and forecast 2023-2028 ($ billion)
      • Exhibit 43: Data Table on Others - Market size and forecast 2023-2028 ($ billion)
      • Exhibit 44: Chart on Others - Year-over-year growth 2023-2028 (%)
      • Exhibit 45: Data Table on Others - Year-over-year growth 2023-2028 (%)
    • 6.6 Market opportunity by Application
      • Exhibit 46: Market opportunity by Application ($ billion)
      • Exhibit 47: Data Table on Market opportunity by Application ($ billion)

    7 Market Segmentation by Type

    • 7.1 Market segments
      • Exhibit 48: Chart on Type - Market share 2023-2028 (%)
      • Exhibit 49: Data Table on Type - Market share 2023-2028 (%)
    • 7.2 Comparison by Type
      • Exhibit 50: Chart on Comparison by Type
      • Exhibit 51: Data Table on Comparison by Type
    • 7.3 Lithium-ion (Li-ion) - Market size and forecast 2023-2028
      • Exhibit 52: Chart on Lithium-ion (Li-ion) - Market size and forecast 2023-2028 ($ billion)
      • Exhibit 53: Data Table on Lithium-ion (Li-ion) - Market size and forecast 2023-2028 ($ billion)
      • Exhibit 54: Chart on Lithium-ion (Li-ion) - Year-over-year growth 2023-2028 (%)
      • Exhibit 55: Data Table on Lithium-ion (Li-ion) - Year-over-year growth 2023-2028 (%)
    • 7.4 Sodium-ion - Market size and forecast 2023-2028
      • Exhibit 56: Chart on Sodium-ion - Market size and forecast 2023-2028 ($ billion)
      • Exhibit 57: Data Table on Sodium-ion - Market size and forecast 2023-2028 ($ billion)
      • Exhibit 58: Chart on Sodium-ion - Year-over-year growth 2023-2028 (%)
      • Exhibit 59: Data Table on Sodium-ion - Year-over-year growth 2023-2028 (%)
    • 7.5 Others - Market size and forecast 2023-2028
      • Exhibit 60: Chart on Others - Market size and forecast 2023-2028 ($ billion)
      • Exhibit 61: Data Table on Others - Market size and forecast 2023-2028 ($ billion)
      • Exhibit 62: Chart on Others - Year-over-year growth 2023-2028 (%)
      • Exhibit 63: Data Table on Others - Year-over-year growth 2023-2028 (%)
    • 7.6 Market opportunity by Type
      • Exhibit 64: Market opportunity by Type ($ billion)
      • Exhibit 65: Data Table on Market opportunity by Type ($ billion)

    8 Customer Landscape

    • 8.1 Customer landscape overview
      • Exhibit 66: Analysis of price sensitivity, lifecycle, customer purchase basket, adoption rates, and purchase criteria

    9 Geographic Landscape

    • 9.1 Geographic segmentation
      • Exhibit 67: Chart on Market share by geography 2023-2028 (%)
      • Exhibit 68: Data Table on Market share by geography 2023-2028 (%)
    • 9.2 Geographic comparison
      • Exhibit 69: Chart on Geographic comparison
      • Exhibit 70: Data Table on Geographic comparison
    • 9.3 APAC - Market size and forecast 2023-2028
      • Exhibit 71: Chart on APAC - Market size and forecast 2023-2028 ($ billion)
      • Exhibit 72: Data Table on APAC - Market size and forecast 2023-2028 ($ billion)
      • Exhibit 73: Chart on APAC - Year-over-year growth 2023-2028 (%)
      • Exhibit 74: Data Table on APAC - Year-over-year growth 2023-2028 (%)
    • 9.4 Europe - Market size and forecast 2023-2028
      • Exhibit 75: Chart on Europe - Market size and forecast 2023-2028 ($ billion)
      • Exhibit 76: Data Table on Europe - Market size and forecast 2023-2028 ($ billion)
      • Exhibit 77: Chart on Europe - Year-over-year growth 2023-2028 (%)
      • Exhibit 78: Data Table on Europe - Year-over-year growth 2023-2028 (%)
    • 9.5 North America - Market size and forecast 2023-2028
      • Exhibit 79: Chart on North America - Market size and forecast 2023-2028 ($ billion)
      • Exhibit 80: Data Table on North America - Market size and forecast 2023-2028 ($ billion)
      • Exhibit 81: Chart on North America - Year-over-year growth 2023-2028 (%)
      • Exhibit 82: Data Table on North America - Year-over-year growth 2023-2028 (%)
    • 9.6 South America - Market size and forecast 2023-2028
      • Exhibit 83: Chart on South America - Market size and forecast 2023-2028 ($ billion)
      • Exhibit 84: Data Table on South America - Market size and forecast 2023-2028 ($ billion)
      • Exhibit 85: Chart on South America - Year-over-year growth 2023-2028 (%)
      • Exhibit 86: Data Table on South America - Year-over-year growth 2023-2028 (%)
    • 9.7 Middle East and Africa - Market size and forecast 2023-2028
      • Exhibit 87: Chart on Middle East and Africa - Market size and forecast 2023-2028 ($ billion)
      • Exhibit 88: Data Table on Middle East and Africa - Market size and forecast 2023-2028 ($ billion)
      • Exhibit 89: Chart on Middle East and Africa - Year-over-year growth 2023-2028 (%)
      • Exhibit 90: Data Table on Middle East and Africa - Year-over-year growth 2023-2028 (%)
    • 9.8 China - Market size and forecast 2023-2028
      • Exhibit 91: Chart on China - Market size and forecast 2023-2028 ($ billion)
      • Exhibit 92: Data Table on China - Market size and forecast 2023-2028 ($ billion)
      • Exhibit 93: Chart on China - Year-over-year growth 2023-2028 (%)
      • Exhibit 94: Data Table on China - Year-over-year growth 2023-2028 (%)
    • 9.9 US - Market size and forecast 2023-2028
      • Exhibit 95: Chart on US - Market size and forecast 2023-2028 ($ billion)
      • Exhibit 96: Data Table on US - Market size and forecast 2023-2028 ($ billion)
      • Exhibit 97: Chart on US - Year-over-year growth 2023-2028 (%)
      • Exhibit 98: Data Table on US - Year-over-year growth 2023-2028 (%)
    • 9.10 Japan - Market size and forecast 2023-2028
      • Exhibit 99: Chart on Japan - Market size and forecast 2023-2028 ($ billion)
      • Exhibit 100: Data Table on Japan - Market size and forecast 2023-2028 ($ billion)
      • Exhibit 101: Chart on Japan - Year-over-year growth 2023-2028 (%)
      • Exhibit 102: Data Table on Japan - Year-over-year growth 2023-2028 (%)
    • 9.11 India - Market size and forecast 2023-2028
      • Exhibit 103: Chart on India - Market size and forecast 2023-2028 ($ billion)
      • Exhibit 104: Data Table on India - Market size and forecast 2023-2028 ($ billion)
      • Exhibit 105: Chart on India - Year-over-year growth 2023-2028 (%)
      • Exhibit 106: Data Table on India - Year-over-year growth 2023-2028 (%)
    • 9.12 Germany - Market size and forecast 2023-2028
      • Exhibit 107: Chart on Germany - Market size and forecast 2023-2028 ($ billion)
      • Exhibit 108: Data Table on Germany - Market size and forecast 2023-2028 ($ billion)
      • Exhibit 109: Chart on Germany - Year-over-year growth 2023-2028 (%)
      • Exhibit 110: Data Table on Germany - Year-over-year growth 2023-2028 (%)
    • 9.13 Market opportunity by geography
      • Exhibit 111: Market opportunity by geography ($ billion)
      • Exhibit 112: Data Tables on Market opportunity by geography ($ billion)

    10 Drivers, Challenges, and Trends

    • 10.1 Market drivers
      • 10.2 Market challenges
        • 10.3 Impact of drivers and challenges
          • Exhibit 113: Impact of drivers and challenges in 2023 and 2028
        • 10.4 Market trends

          11 Vendor Landscape

          • 11.1 Overview
            • 11.2 Vendor landscape
              • Exhibit 114: Overview on Criticality of inputs and Factors of differentiation
            • 11.3 Landscape disruption
              • Exhibit 115: Overview on factors of disruption
            • 11.4 Industry risks
              • Exhibit 116: Impact of key risks on business

            12 Vendor Analysis

            • 12.1 Vendors covered
              • Exhibit 117: Vendors covered
            • 12.2 Market positioning of vendors
              • Exhibit 118: Matrix on vendor position and classification
            • 12.3 BYD Co. Ltd.
              • Exhibit 119: BYD Co. Ltd. - Overview
              • Exhibit 120: BYD Co. Ltd. - Business segments
              • Exhibit 121: BYD Co. Ltd. - Key offerings
              • Exhibit 122: BYD Co. Ltd. - Segment focus
            • 12.4 Contemporary Amperex Technology Co. Ltd.
              • Exhibit 123: Contemporary Amperex Technology Co. Ltd. - Overview
              • Exhibit 124: Contemporary Amperex Technology Co. Ltd. - Product / Service
              • Exhibit 125: Contemporary Amperex Technology Co. Ltd. - Key offerings
            • 12.5 East Penn Manufacturing Co. Inc.
              • Exhibit 126: East Penn Manufacturing Co. Inc. - Overview
              • Exhibit 127: East Penn Manufacturing Co. Inc. - Product / Service
              • Exhibit 128: East Penn Manufacturing Co. Inc. - Key offerings
            • 12.6 EnerSys
              • Exhibit 129: EnerSys - Overview
              • Exhibit 130: EnerSys - Business segments
              • Exhibit 131: EnerSys - Key offerings
              • Exhibit 132: EnerSys - Segment focus
            • 12.7 Freudenberg and Co. KG
              • Exhibit 133: Freudenberg and Co. KG - Overview
              • Exhibit 134: Freudenberg and Co. KG - Business segments
              • Exhibit 135: Freudenberg and Co. KG - Key news
              • Exhibit 136: Freudenberg and Co. KG - Key offerings
              • Exhibit 137: Freudenberg and Co. KG - Segment focus
            • 12.8 GS Yuasa International Ltd.
              • Exhibit 138: GS Yuasa International Ltd. - Overview
              • Exhibit 139: GS Yuasa International Ltd. - Business segments
              • Exhibit 140: GS Yuasa International Ltd. - Key offerings
              • Exhibit 141: GS Yuasa International Ltd. - Segment focus
            • 12.9 Hitachi Ltd.
              • Exhibit 142: Hitachi Ltd. - Overview
              • Exhibit 143: Hitachi Ltd. - Business segments
              • Exhibit 144: Hitachi Ltd. - Key news
              • Exhibit 145: Hitachi Ltd. - Key offerings
              • Exhibit 146: Hitachi Ltd. - Segment focus
            • 12.10 Johnson Controls
              • Exhibit 147: Johnson Controls - Overview
              • Exhibit 148: Johnson Controls - Business segments
              • Exhibit 149: Johnson Controls - Key news
              • Exhibit 150: Johnson Controls - Key offerings
              • Exhibit 151: Johnson Controls - Segment focus
            • 12.11 Leoch International Technology Ltd.
              • Exhibit 152: Leoch International Technology Ltd. - Overview
              • Exhibit 153: Leoch International Technology Ltd. - Product / Service
              • Exhibit 154: Leoch International Technology Ltd. - Key offerings
            • 12.12 LG Electronics Inc.
              • Exhibit 155: LG Electronics Inc. - Overview
              • Exhibit 156: LG Electronics Inc. - Product / Service
              • Exhibit 157: LG Electronics Inc. - Key offerings
            • 12.13 Panasonic Holdings Corp.
              • Exhibit 158: Panasonic Holdings Corp. - Overview
              • Exhibit 159: Panasonic Holdings Corp. - Product / Service
              • Exhibit 160: Panasonic Holdings Corp. - Key news
              • Exhibit 161: Panasonic Holdings Corp. - Key offerings
            • 12.14 Samsung Electronics Co. Ltd.
              • Exhibit 162: Samsung Electronics Co. Ltd. - Overview
              • Exhibit 163: Samsung Electronics Co. Ltd. - Business segments
              • Exhibit 164: Samsung Electronics Co. Ltd. - Key news
              • Exhibit 165: Samsung Electronics Co. Ltd. - Key offerings
              • Exhibit 166: Samsung Electronics Co. Ltd. - Segment focus
            • 12.15 Tesla Inc.
              • Exhibit 167: Tesla Inc. - Overview
              • Exhibit 168: Tesla Inc. - Business segments
              • Exhibit 169: Tesla Inc. - Key news
              • Exhibit 170: Tesla Inc. - Key offerings
              • Exhibit 171: Tesla Inc. - Segment focus
            • 12.16 Toshiba Corp.
              • Exhibit 172: Toshiba Corp. - Overview
              • Exhibit 173: Toshiba Corp. - Business segments
              • Exhibit 174: Toshiba Corp. - Key news
              • Exhibit 175: Toshiba Corp. - Key offerings
              • Exhibit 176: Toshiba Corp. - Segment focus
            • 12.17 TotalEnergies SE
              • Exhibit 177: TotalEnergies SE - Overview
              • Exhibit 178: TotalEnergies SE - Business segments
              • Exhibit 179: TotalEnergies SE - Key news
              • Exhibit 180: TotalEnergies SE - Key offerings
              • Exhibit 181: TotalEnergies SE - Segment focus

            13 Appendix

            • 13.1 Scope of the report
              • 13.2 Inclusions and exclusions checklist
                • Exhibit 182: Inclusions checklist
                • Exhibit 183: Exclusions checklist
              • 13.3 Currency conversion rates for US$
                • Exhibit 184: Currency conversion rates for US$
              • 13.4 Research methodology
                • Exhibit 185: Research methodology
                • Exhibit 186: Validation techniques employed for market sizing
                • Exhibit 187: Information sources
              • 13.5 List of abbreviations
                • Exhibit 188: List of abbreviations

              Research Methodology

              Technavio presents a detailed picture of the market by way of study, synthesis, and summation of data from multiple sources. The analysts have presented the various facets of the market with a particular focus on identifying the key industry influencers. The data thus presented is comprehensive, reliable, and the result of extensive research, both primary and secondary.

              INFORMATION SOURCES

              Primary sources

              • Manufacturers and suppliers
              • Channel partners
              • Industry experts
              • Strategic decision makers

              Secondary sources

              • Industry journals and periodicals
              • Government data
              • Financial reports of key industry players
              • Historical data
              • Press releases

              DATA ANALYSIS

              Data Synthesis

              • Collation of data
              • Estimation of key figures
              • Analysis of derived insights

              Data Validation

              • Triangulation with data models
              • Reference against proprietary databases
              • Corroboration with industry experts

              REPORT WRITING

              Qualitative

              • Market drivers
              • Market challenges
              • Market trends
              • Five forces analysis

              Quantitative

              • Market size and forecast
              • Market segmentation
              • Geographical insights
              • Competitive landscape

              Interested in this report?

              Get your sample now to see our research methodology and insights!

              Download Now

              Frequently Asked Questions

              Battery Pack market growth will increase by $ 124.4 bn during 2024-2028 .

              The Battery Pack market is expected to grow at a CAGR of 14.48% during 2024-2028 .

              Battery Pack market is segmented by Application( Automotive, Industrial, Others) Type( Lithium-ion (Li-ion), Sodium-ion, Others)

              Berkshire Hathaway Inc., BYD Co. Ltd., CLARIOS LLC, Contemporary Amperex Technology Co. Ltd., East Penn Manufacturing Co. Inc., EnerSys, Eveready Industries India Ltd., Freudenberg and Co. KG, GS Yuasa International Ltd., Hitachi Ltd., Johnson Controls, Kabra Extrusiontechnik Ltd., Leoch International Technology Ltd., LG Electronics Inc., Nikola Corp., NIO Ltd., Panasonic Holdings Corp., Samsung Electronics Co. Ltd., Tesla Inc., Toshiba Corp., TotalEnergies SE, VARTA AG, Wanxiang Group are a few of the key vendors in the Battery Pack market.

              APAC will register the highest growth rate of 47% among the other regions. Therefore, the Battery Pack market in APAC is expected to garner significant business opportunities for the vendors during the forecast period.

              US, China, Japan, India, Germany

              • Increase in number of mergers and acquisitions by market vendorsThe global battery pack market is highly fragmented is the driving factor this market.
              • with numerous vendors competing for market shares. Mergers and acquisitions allow companies to consolidate their market positions is the driving factor this market.
              • expand their product portfolios is the driving factor this market.
              • and achieve economies of scale. Battery pack vendors are seeking to vertically integrate their operations by acquiring complementary businesses across the value chain is the driving factor this market.
              • such as battery cell manufacturers is the driving factor this market.
              • component suppliers is the driving factor this market.
              • or distribution channels. Vertical integration enhances supply chain control is the driving factor this market.
              • reduces dependence on external suppliers is the driving factor this market.
              • and improves cost efficiency. Some partnerships and acquisitions in the market in focus are mentioned below: In October 2023 is the driving factor this market.
              • Honda Motorcycles and Scooters (India) is the driving factor this market.
              • the only significant two-wheeler brand without an electric vehicle yet is the driving factor this market.
              • announced is the driving factor this market.
              • that it will produce battery packs locally in a partnership with Navitasys is the driving factor this market.
              • based in Haryana. This partnership has changed the competitive landscape in a market sector leading the way in the green transformation of personal mobility. In August 2022 is the driving factor this market.
              • Nikola Corporation acquired California-based Romeo Power for in-house engineering and production of battery packs. This acquisition will allow Nikola Corporation to improve its operational efficiency and reduce the cost of battery packs significantly. In March 2022 is the driving factor this market.
              • Kabra ExtrusionTechnik Ltd.s subsidiary Battrixx is the driving factor this market.
              • a manufacturer of lithium-ion battery packs is the driving factor this market.
              • acquired Pune-based Varos Technology Pvt Ltd. With this acquisition is the driving factor this market.
              • the company is focused on expanding its battery pack production. As companies continue to pursue growth opportunities and strategic alliances is the driving factor this market.
              • mergers and acquisitions are expected to remain a prominent feature of the global battery pack market is the driving factor this market.
              • which will positively impact its growth during the forecast period. is the driving factor this market.

              The Battery Pack market vendors should focus on grabbing business opportunities from the Automotive segment as it accounted for the largest market share in the base year.