India Electrical Equipment Market Size 2026-2030
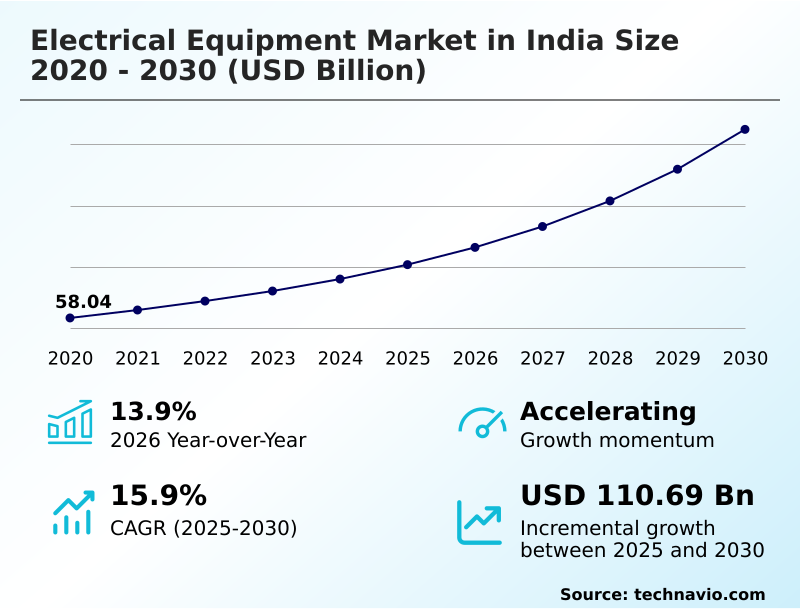
The india electrical equipment market size is valued to increase by USD 110.69 billion, at a CAGR of 15.9% from 2025 to 2030. Robust urbanization and infrastructure development initiatives will drive the india electrical equipment market.
Major Market Trends & Insights
- By Product - Cables and wires segment was valued at USD 28.02 billion in 2024
- By Application - Transmission and distribution segment accounted for the largest market revenue share in 2024
Market Size & Forecast
- Market Opportunities: USD 154.29 billion
- Market Future Opportunities: USD 110.69 billion
- CAGR from 2025 to 2030 : 15.9%
Market Summary
- The electrical equipment market in India is expanding, driven by national industrialization, urban growth, and a significant push toward energy transition. This sector is crucial for developing the infrastructure needed for power generation, transmission, and distribution. A key focus is on strengthening domestic manufacturing and integrating renewable energy sources, supported by policies aimed at reducing import reliance.
- The market's trajectory is shaped by the need to upgrade aging grids with technologies like substation automation and smart grid components to improve efficiency and reliability. For instance, a heavy industrial firm implementing predictive maintenance in switchgear and energy-efficient motors can reduce unplanned downtime and lower operational energy costs, showcasing the tangible benefits of adopting advanced electrical solutions.
- This demand for high-quality, indigenous production, coupled with the need for modernizing the power sector through efficient power transformers and gas-insulated substations, creates a favorable growth environment.
What will be the Size of the India Electrical Equipment Market during the forecast period?
Get Key Insights on Market Forecast (PDF) Get Free Sample
How is the India Electrical Equipment Market Segmented?
The india electrical equipment industry research report provides comprehensive data (region-wise segment analysis), with forecasts and estimates in "USD million" for the period 2026-2030, as well as historical data from 2020-2024 for the following segments.
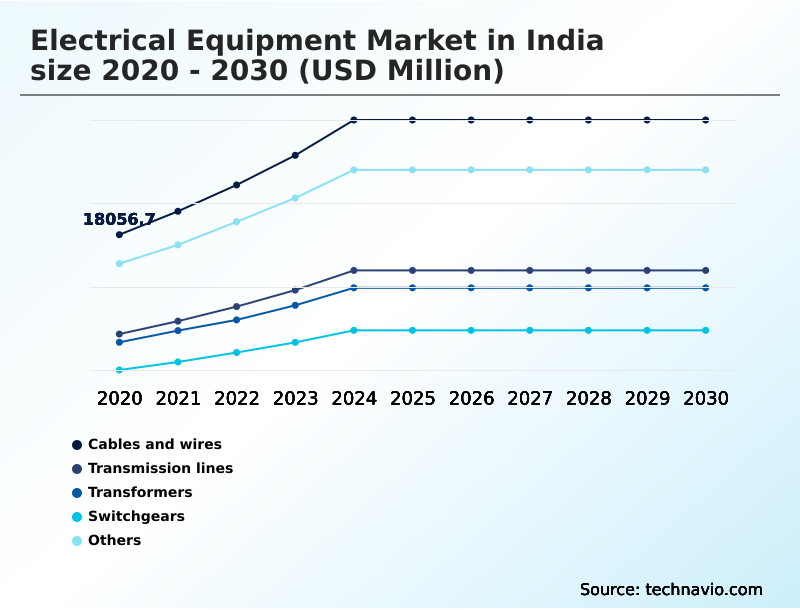
- Product
- Cables and wires
- Transmission lines
- Transformers
- Switchgears
- Others
- Application
- Transmission and distribution
- Generation
- Distribution channel
- Direct sales
- Distributors and dealers
- Online platforms
- Retail stores
- Geography
- APAC
- India
- APAC
By Product Insights
The cables and wires segment is estimated to witness significant growth during the forecast period.
The cables and wires segment is foundational to the electrical equipment market in India, underpinning the entire circulatory system for electrical power distribution.
This category includes a wide array of products, from high-voltage power cables essential for power transmission infrastructure to specialized control cables for industrial automation. Demand is sustained by large-scale government programs targeting rural electrification and substation infrastructure development.
The market is also seeing a shift towards products with enhanced safety features, such as fire retardant cables, especially in urban construction.
For instance, adherence to new building codes has mandated the use of advanced wiring, improving safety compliance by over 20%.
The need for reliable low voltage switchgear and corresponding wiring within commercial and residential projects further fuels this segment, making the quality and reach of the cable and wire network a direct determinant of overall grid efficiency.
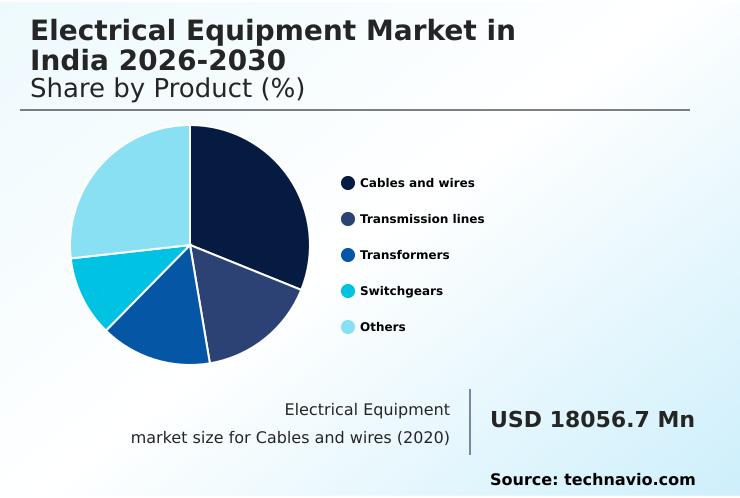
The Cables and wires segment was valued at USD 28.02 billion in 2024 and showed a gradual increase during the forecast period.
Market Dynamics
Our researchers analyzed the data with 2025 as the base year, along with the key drivers, trends, and challenges. A holistic analysis of drivers will help companies refine their marketing strategies to gain a competitive advantage.
- A critical strategic consideration for stakeholders is understanding the role of transformers in grid stability, especially given the impact of renewables on distribution networks. Ensuring adherence to high voltage switchgear safety standards is non-negotiable, particularly for fire retardant cable for commercial buildings.
- The advancements in power cable insulation are helping mitigate risks, but the challenges in deploying ev charging networks persist, linked to grid capacity. For industrial end-users, the energy efficient motor adoption benefits are clear, especially when vfd application in industrial machinery is optimized. A key debate revolves around gas-insulated vs air-insulated substations for new projects.
- Companies are also focused on optimizing substation automation systems and implementing predictive maintenance for circuit breakers to improve reliability. Managing grid health now involves managing power quality with active filters and planning for the large-scale deployment of battery energy storage systems.
- The cost-benefit of amorphous core transformers shows a clear advantage in long-term operational savings, reducing lifecycle costs by as much as 15% compared to conventional units. This is driving the integration of scada in power distribution. However, digital substation implementation challenges and the need for securing power grid control systems remain significant.
- Finally, the ability to deliver turnkey solutions for transmission projects while evaluating power purchase agreement risks separates market leaders.
What are the key market drivers leading to the rise in the adoption of India Electrical Equipment Industry?
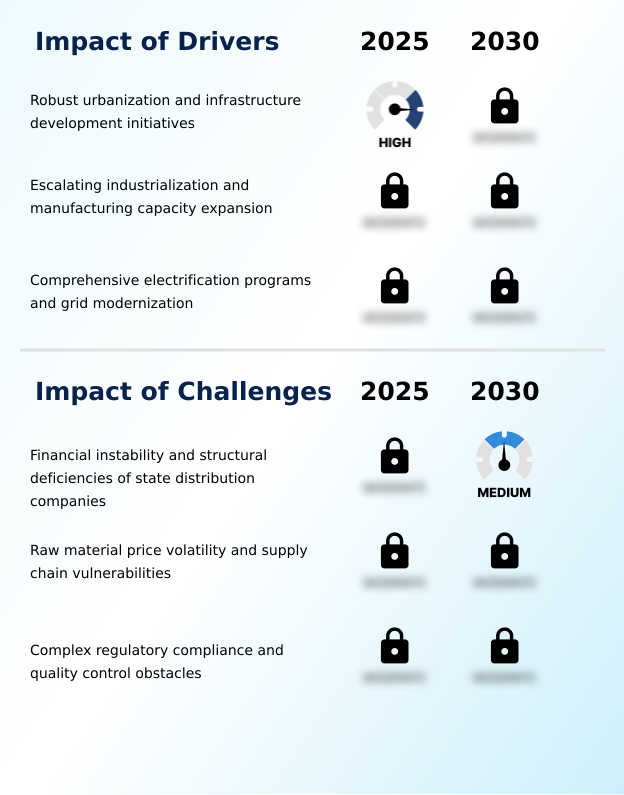
- Robust urbanization and ongoing infrastructure development initiatives are key drivers of the market.
- Robust urban infrastructure development and widespread electrification initiatives are primary market drivers. The expansion of industrial corridors fuels demand for industrial automation solutions and reliable power infrastructure, including high-capacity transmission lines and sophisticated switchgear systems.
- In the manufacturing sector, a concerted push toward operational efficiency has increased the adoption of energy-efficient motors by over 25% in certain industries. The integration of variable frequency drives (VFDs) has become standard for optimizing energy consumption in heavy machinery.
- These greenfield and brownfield investments, supported by government policies promoting domestic manufacturing, ensure a continuous demand for advanced electrical engineering solutions, bolstering the market's growth trajectory and enhancing national industrial capacity.
What are the market trends shaping the India Electrical Equipment Industry?
- An upcoming market trend is the expansion of the energy storage ecosystem, coupled with the increasing adoption of sophisticated grid balancing technologies to support grid stability.
- A key trend is the rapid development of the energy storage systems ecosystem, driven by the need for advanced grid balancing technologies. This shift facilitates large-scale renewable energy integration, with investments in utility scale energy storage projects growing significantly.
- The deployment of battery energy storage systems (BESS) and high-performance power conversion systems has become critical for managing grid intermittency, with some utilities reporting a 15% improvement in frequency regulation. Concurrently, the adoption of behind-the-meter storage by industrial consumers is rising, supported by intelligent smart load balancers.
- This evolution from traditional hardware to dynamic, storage-integrated ecosystems is creating a specialized sub-market that is essential for supporting a decentralized power generation landscape and maintaining grid stability.
What challenges does the India Electrical Equipment Industry face during its growth?
- The financial instability and structural deficiencies of state distribution companies present a key challenge affecting industry growth.
- A significant challenge stems from the acute raw material price fluctuation, which directly impacts the profitability of manufacturing essential components like distribution transformers and circuit breakers. This volatility, coupled with persistent supply chain vulnerability, creates an unpredictable operating environment for many domestic producers.
- Another major hurdle is the complex nature of regulatory compliance management, where frequent changes in standards can impose significant administrative burdens. Despite ongoing power sector reforms, the high level of aggregate transmission and distribution losses, often exceeding 20% in some areas, points to underlying structural inefficiencies.
- These financial and operational pressures on state utilities create a cascading effect, delaying payments and constraining investment in critical infrastructure upgrades.
Exclusive Technavio Analysis on Customer Landscape
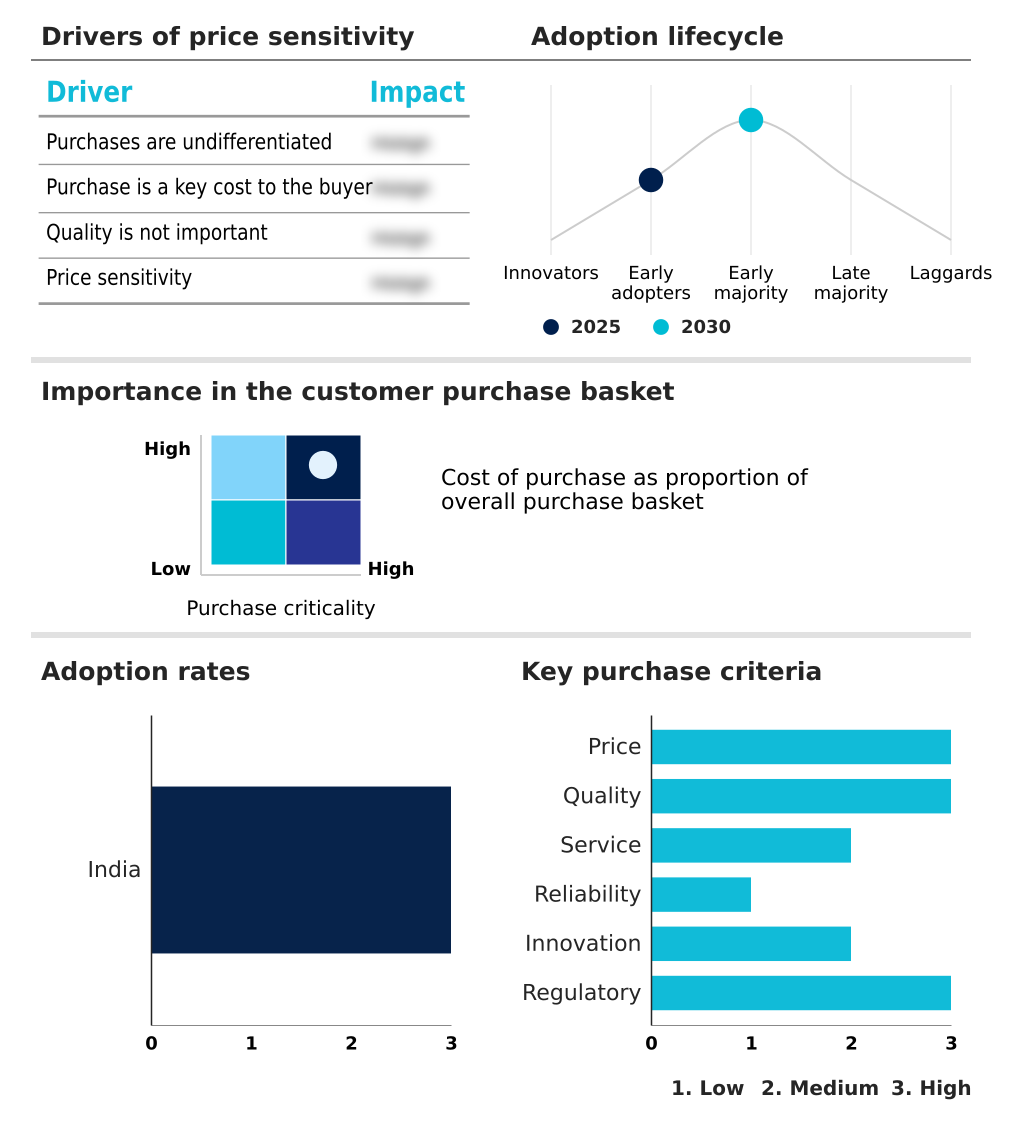
The india electrical equipment market forecasting report includes the adoption lifecycle of the market, covering from the innovator’s stage to the laggard’s stage. It focuses on adoption rates in different regions based on penetration. Furthermore, the india electrical equipment market report also includes key purchase criteria and drivers of price sensitivity to help companies evaluate and develop their market growth analysis strategies.
Customer Landscape of India Electrical Equipment Industry
Competitive Landscape
Companies are implementing various strategies, such as strategic alliances, india electrical equipment market forecast, partnerships, mergers and acquisitions, geographical expansion, and product/service launches, to enhance their presence in the industry.
ABB Ltd. - Delivers a portfolio of electrical products and automation solutions, addressing diverse industrial and utility requirements for power and control.
The industry research and growth report includes detailed analyses of the competitive landscape of the market and information about key companies, including:
- ABB Ltd.
- Bajaj Electricals Ltd.
- Bharat Bijlee Ltd
- Bharat Heavy Electricals Ltd.
- C and S Electric Ltd.
- CG Power and Industrial Ltd.
- Crompton Electricals Ltd.
- EVR Power
- Finolex Cables Ltd.
- Havells India Ltd.
- Hitachi Energy Ltd.
- HPL Electric and Power Ltd.
- KEI Industries Ltd.
- Kirloskar Electric Co. Ltd.
- Larsen and Toubro Ltd.
- Orient Electric Ltd.
- Polycab India Ltd.
- Schneider Electric SE
- Siemens AG
- V Guard Industries Ltd.
Qualitative and quantitative analysis of companies has been conducted to help clients understand the wider business environment as well as the strengths and weaknesses of key industry players. Data is qualitatively analyzed to categorize companies as pure play, category-focused, industry-focused, and diversified; it is quantitatively analyzed to categorize companies as dominant, leading, strong, tentative, and weak.
Recent Development and News in India electrical equipment market
- In May 2025, Siemens AG announced the completion of its project to deploy advanced substation automation systems for a major state utility, enhancing grid monitoring and control.
- In February 2025, Larsen and Toubro Ltd. secured a significant contract for the engineering, procurement, and construction of several high-voltage gas-insulated substations to strengthen the national transmission network.
- In November 2024, Schneider Electric SE introduced a new range of eco-friendly medium voltage switchgear, utilizing clean air technology instead of SF6 gas, aligning with sustainability goals.
- In September 2024, Polycab India Ltd. commissioned a new manufacturing line for specialized fire retardant cables and low smoke halogen free cables, catering to increased safety standards in infrastructure projects.
Dive into Technavio’s robust research methodology, blending expert interviews, extensive data synthesis, and validated models for unparalleled India Electrical Equipment Market insights. See full methodology.
| Market Scope | |
|---|---|
| Page number | 195 |
| Base year | 2025 |
| Historic period | 2020-2024 |
| Forecast period | 2026-2030 |
| Growth momentum & CAGR | Accelerate at a CAGR of 15.9% |
| Market growth 2026-2030 | USD 110686.3 million |
| Market structure | Fragmented |
| YoY growth 2025-2026(%) | 13.9% |
| Key countries | India |
| Competitive landscape | Leading Companies, Market Positioning of Companies, Competitive Strategies, and Industry Risks |
Research Analyst Overview
- The market is characterized by a technological shift towards more efficient and intelligent systems. The deployment of power electronics and high-voltage direct current technology is becoming crucial for managing the grid. Core components like power transformers and distribution transformers are evolving, with a focus on amorphous core transformers to reduce losses.
- In protection systems, gas-insulated substations are preferred in urban areas, while advanced switchgear systems incorporating smart protective relays and circuit breakers are essential. The integration of programmable logic controllers (PLCs) in industrial control systems and substation automation is standardizing operations.
- One key boardroom consideration is the lifecycle cost of assets; investing in energy-efficient motors paired with variable frequency drives can yield an energy consumption reduction of over 30%, directly impacting operational expenditure and sustainability reporting. This trend underscores a broader move towards intelligent and efficient electrical infrastructure.
What are the Key Data Covered in this India Electrical Equipment Market Research and Growth Report?
-
What is the expected growth of the India Electrical Equipment Market between 2026 and 2030?
-
USD 110.69 billion, at a CAGR of 15.9%
-
-
What segmentation does the market report cover?
-
The report is segmented by Product (Cables and wires, Transmission lines, Transformers, Switchgears, and Others), Application (Transmission and distribution, and Generation), Distribution Channel (Direct sales, Distributors and dealers, Online platforms, and Retail stores) and Geography (APAC)
-
-
Which regions are analyzed in the report?
-
APAC
-
-
What are the key growth drivers and market challenges?
-
Robust urbanization and infrastructure development initiatives, Financial instability and structural deficiencies of state distribution companies
-
-
Who are the major players in the India Electrical Equipment Market?
-
ABB Ltd., Bajaj Electricals Ltd., Bharat Bijlee Ltd, Bharat Heavy Electricals Ltd., C and S Electric Ltd., CG Power and Industrial Ltd., Crompton Electricals Ltd., EVR Power, Finolex Cables Ltd., Havells India Ltd., Hitachi Energy Ltd., HPL Electric and Power Ltd., KEI Industries Ltd., Kirloskar Electric Co. Ltd., Larsen and Toubro Ltd., Orient Electric Ltd., Polycab India Ltd., Schneider Electric SE, Siemens AG and V Guard Industries Ltd.
-
Market Research Insights
- Market dynamics are heavily influenced by government-led electrification initiatives and power sector reforms. Investment in grid modernization projects has demonstrably improved power availability in targeted zones by up to 18%, while focused efforts to reduce transmission and distribution losses have yielded efficiency gains of 3-4% in modernized circles.
- The push for renewable energy integration and the build-out of electric vehicle charging infrastructure are creating new, high-growth verticals. However, navigating regulatory compliance management remains a key operational focus for manufacturers. The expansion of domestic manufacturing capacity is a strategic priority, aiming to mitigate risks from raw material price fluctuation and enhance self-reliance in critical components.
We can help! Our analysts can customize this india electrical equipment market research report to meet your requirements.
 RIA -
RIA - 
