
Electronics Manufacturing Service Market Size 2026-2030
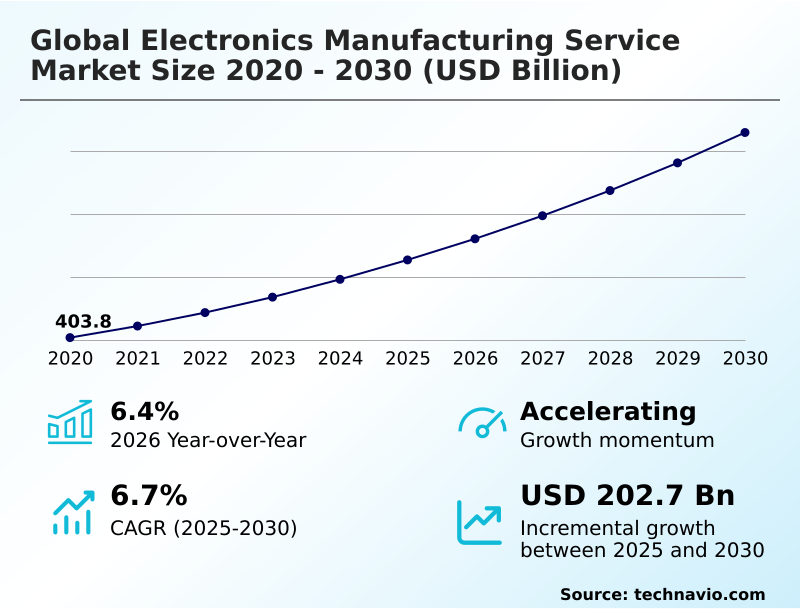
The electronics manufacturing service market size is valued to increase by USD 202.7 billion, at a CAGR of 6.7% from 2025 to 2030. Strategic proliferation of artificial intelligence infrastructure and high-performance computing will drive the electronics manufacturing service market.
Major Market Trends & Insights
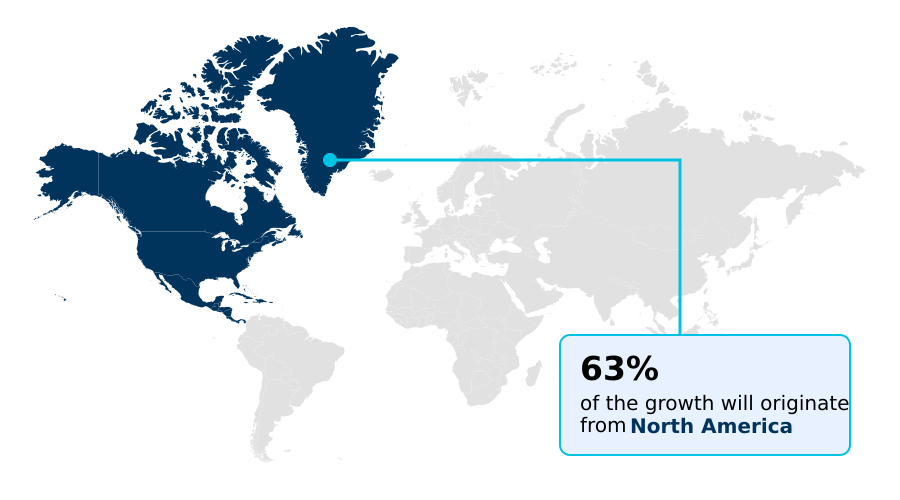
- North America dominated the market and accounted for a 63% growth during the forecast period.
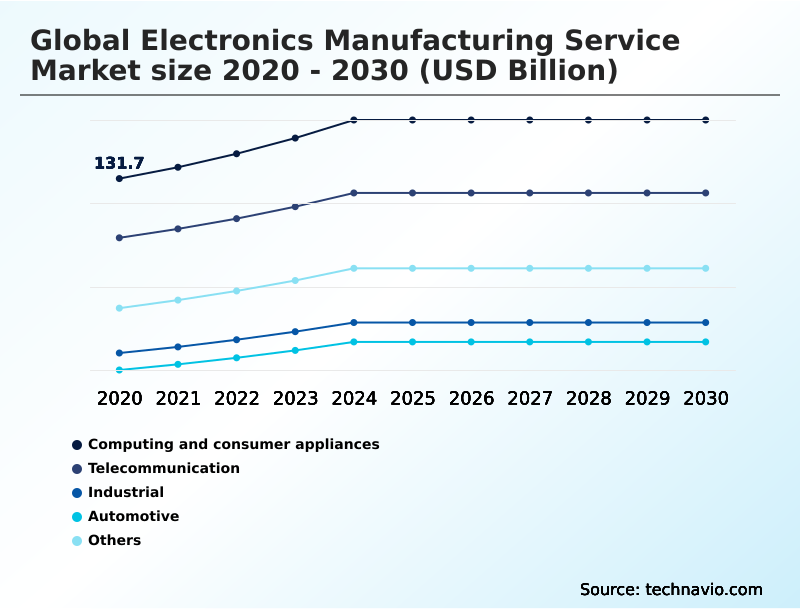
- By End-user - Computing and consumer appliances segment was valued at USD 158.6 billion in 2024
- By Service Type - Electronics design and engineering segment accounted for the largest market revenue share in 2024
Market Size & Forecast
- Market Opportunities: USD 326.3 billion
- Market Future Opportunities: USD 202.7 billion
- CAGR from 2025 to 2030 : 6.7%
Market Summary
- The Electronics Manufacturing Service market is undergoing a significant transformation, moving beyond traditional assembly to offer comprehensive lifecycle management solutions. This evolution is driven by the escalating complexity of electronic products across sectors, compelling original equipment manufacturers to seek partners with deep engineering expertise.
- A primary catalyst is the demand for sophisticated hardware to support artificial intelligence and high-performance computing, which requires advanced capabilities in thermal management and high-density interconnects. Concurrently, the automotive industry's shift to electric vehicles and autonomous systems creates a need for high-reliability electronics for components like battery management systems.
- For instance, an automotive OEM might partner with an EMS provider to co-design and manufacture a new battery management system, ensuring adherence to stringent ISO 26262 safety standards and optimizing the supply chain to reduce time-to-market. This strategic reliance on external partners is further amplified by geopolitical trends favoring supply chain diversification, leading to investment in new manufacturing hubs.
- However, this dynamic landscape is not without its challenges, including a persistent shortage of skilled technical labor and the complexities of navigating a fragmented global logistics network, which places pressure on operational efficiency and profitability.
What will be the Size of the Electronics Manufacturing Service Market during the forecast period?
Get Key Insights on Market Forecast (PDF) Get Free Sample
How is the Electronics Manufacturing Service Market Segmented?
The electronics manufacturing service industry research report provides comprehensive data (region-wise segment analysis), with forecasts and estimates in "USD billion" for the period 2026-2030, as well as historical data from 2020-2024 for the following segments.
- End-user
- Computing and consumer appliances
- Telecommunication
- Industrial
- Automotive
- Others
- Service type
- Electronics design and engineering
- Electronics assembly
- Electronics manufacturing
- Others
- Technology
- Surface mount technology
- Advanced packaging or hybrid processes
- Through-hole technology
- Geography
- North America
- US
- Mexico
- Canada
- Europe
- Germany
- France
- UK
- APAC
- China
- Japan
- South Korea
- South America
- Brazil
- Argentina
- Middle East and Africa
- South Africa
- Israel
- UAE
- Rest of World (ROW)
- North America
By End-user Insights
The computing and consumer appliances segment is estimated to witness significant growth during the forecast period.
The computing and consumer appliances segment is a primary volume driver, characterized by high-velocity production from initial design for manufacturability to final box-build integration.
Original equipment manufacturers increasingly utilize outsourced manufacturing and electronics assembly services for a range of products, from cloud computing hardware to consumer electronics assembly.
These contract manufacturing solutions manage complex printed circuit board assembly and system integration services, adapting to rapid product cycles.
This approach to end-to-end manufacturing is critical for new product introduction, especially as the complexity of components for applications like in-vehicle infotainment grows, with advanced assembly techniques improving final yields by over 12%.
This segment's reliance on specialized pcb fabrication ensures that even with high volumes, quality standards are maintained throughout the production lifecycle.
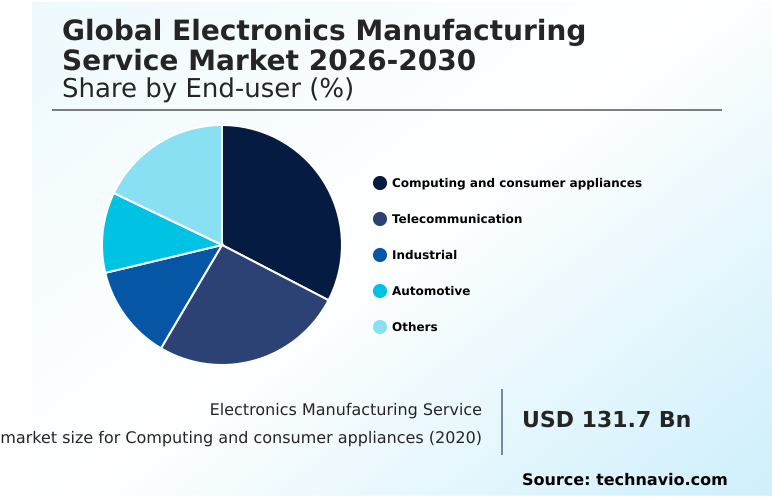
The Computing and consumer appliances segment was valued at USD 158.6 billion in 2024 and showed a gradual increase during the forecast period.
Regional Analysis
North America is estimated to contribute 63% to the growth of the global market during the forecast period.Technavio’s analysts have elaborately explained the regional trends and drivers that shape the market during the forecast period.
See How Electronics Manufacturing Service Market Demand is Rising in North America Get Free Sample
The geographic landscape is defined by the strategic management of the semiconductor supply chain and component procurement, with APAC remaining a dominant production hub.
However, there is a clear trend toward regionalization to enhance supply chain resilience, with North America capturing 63.0% of the market's incremental growth, largely driven by nearshoring to Mexico.
Firms are focusing on comprehensive lifecycle management, including reverse logistics and logistics and fulfillment, to serve local markets more efficiently. Emerging hubs in India and Vietnam are gaining prominence for surface mount technology and assembly, supported by government incentives.
This diversification supports industrial automation electronics, telecom hardware manufacturing, and data center hardware production globally.
The production of specialized radio frequency modules and iot device manufacturing is also becoming more geographically dispersed to mitigate risks, while facilities focused on low-volume high-mix production are being established closer to end markets.
Market Dynamics
Our researchers analyzed the data with 2025 as the base year, along with the key drivers, trends, and challenges. A holistic analysis of drivers will help companies refine their marketing strategies to gain a competitive advantage.
- Original equipment manufacturers are increasingly evaluating the benefits of outsourcing electronics design to specialized partners, a critical first step in a complex decision-making process. Selecting an ems partner for npi requires careful consideration of their capabilities in handling advanced technologies and managing intricate supply chains.
- For an ems provider for automotive sector, this means demonstrating expertise in the role of ems in ev battery systems and adhering to strict quality standards. The technical debate between smt vs through-hole for reliability continues, with the choice depending on the application's specific mechanical and thermal stress requirements.
- In high-performance computing, the focus is on advanced packaging for ai accelerators to enhance performance. Strategically, the impact of tariffs on ems providers is forcing a re-evaluation of global footprints, with many exploring the nearshoring electronics to mexico benefits. This is weighed against the advantages of electronics manufacturing in vietnam vs india, creating a complex multi-regional strategy.
- The cost of pcb assembly services and the challenges in high-volume electronics manufacturing are central to managing supply chain in electronics. Efficiently automating inspection in pcb assembly can reduce defects, but adherence to ems quality standards for aerospace remains paramount in high-reliability sectors.
- This strategic balancing act can result in supply chain cost differentials exceeding 20% between regionalized and single-source models.
What are the key market drivers leading to the rise in the adoption of Electronics Manufacturing Service Industry?
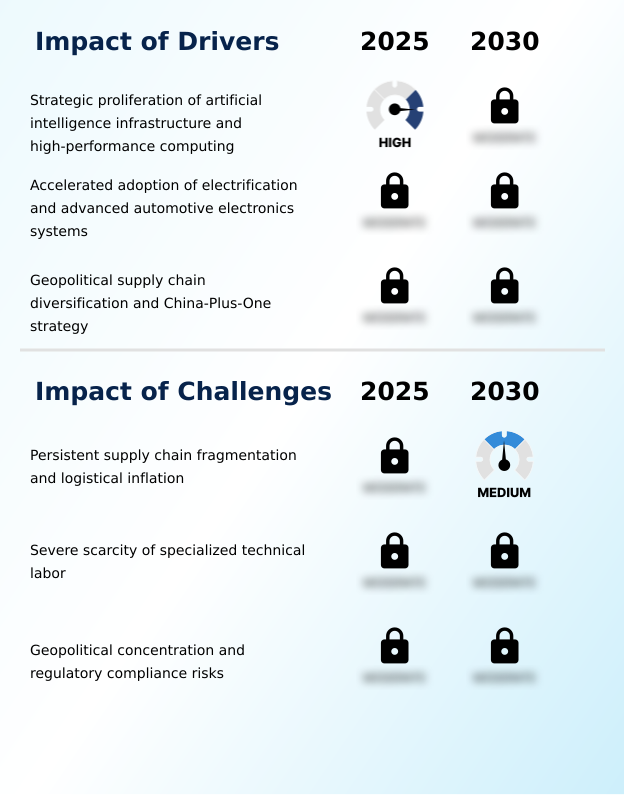
- The strategic proliferation of artificial intelligence infrastructure and high-performance computing hardware is a key driver for the electronics manufacturing service market.
- The market's growth is propelled by strategic shifts in technology and global supply chains. A primary driver is the widespread adoption of the china-plus-one strategy, which fosters the development of regionalized supply chains and enhances geopolitical risk mitigation.
- This push for supply chain resilience is complemented by a growing focus on the circular economy in electronics and sustainable manufacturing practices, with firms reporting a 15% reduction in material waste through improved processes.
- Technologically, the integration of digital twin technology and predictive maintenance is optimizing operations, while robotic process automation is addressing labor shortages.
- The demand for advanced power electronics, driven by the electric vehicle and renewable energy sectors, necessitates specialized electromechanical assembly and expertise in thermal management, with effective signal integrity testing reducing product failure rates by over 20%.
What are the market trends shaping the Electronics Manufacturing Service Industry?
- The proliferation of artificial intelligence and growing demand for data infrastructure are key trends shaping the market. This surge necessitates advanced manufacturing capabilities for high-performance computing hardware.
- Key market trends are redefining manufacturing paradigms, with a strong emphasis on technological sophistication and supply chain agility. The adoption of industry 4.0 in electronics, particularly through smart factory implementation, has enabled a 25% improvement in operational equipment effectiveness. This facilitates high-mix low-volume production, where advanced supply chain orchestration is crucial.
- Technically, the industry is advancing with system-in-package designs and heterogeneous integration to meet miniaturization demands. The use of automated optical inspection for high-density interconnect boards is now standard, while a strategic mix of surface mount technology and through-hole technology addresses diverse reliability needs.
- Geopolitically, the trend toward on-shoring manufacturing and near-shoring electronics production is accelerating, diversifying production away from single regions and reducing lead times for western markets by over 40%.
What challenges does the Electronics Manufacturing Service Industry face during its growth?
- Persistent supply chain fragmentation and logistical inflation present a key challenge affecting industry growth.
- The market confronts significant operational and structural challenges that temper growth. The complexity of managing global data center infrastructure and high-performance computing hardware, including server rack assembly and liquid-cooling solutions, strains existing manufacturing capabilities. The rollout of 5g infrastructure adds another layer of technical difficulty.
- In the automotive electronics sector, ensuring iso 26262 compliance for critical systems like battery management systems and advanced driver-assistance systems represents a high barrier to entry, with audit processes increasing project timelines by up to 25%. Furthermore, regulatory pressures around e-waste management require substantial investment in sustainable practices.
- A pervasive scarcity of skilled technicians capable of servicing high-reliability electronics for medical device manufacturing and aerospace electronics assembly remains a critical bottleneck, with 71% of firms citing labor availability as a direct constraint on their current business operations.
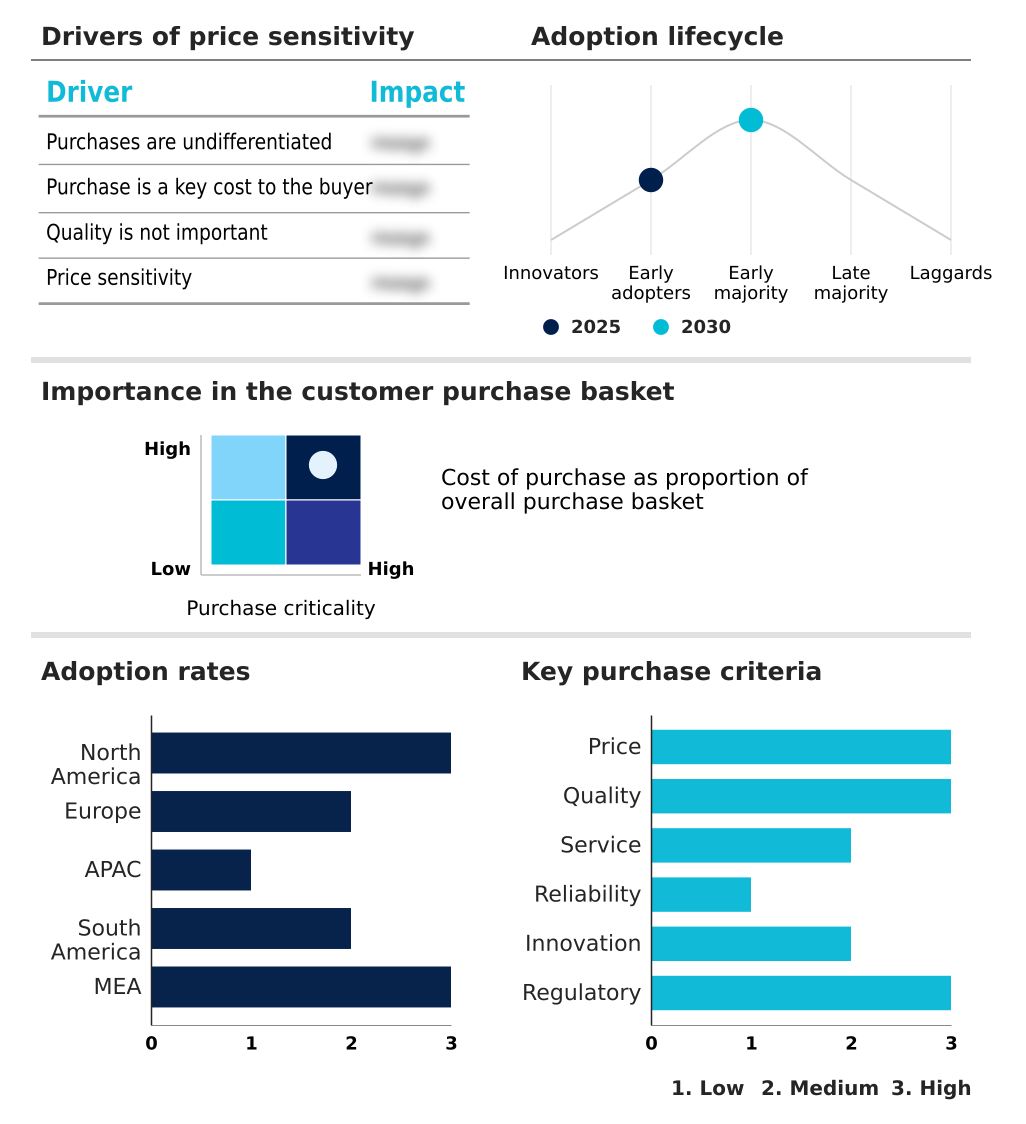
Exclusive Technavio Analysis on Customer Landscape
The electronics manufacturing service market forecasting report includes the adoption lifecycle of the market, covering from the innovator’s stage to the laggard’s stage. It focuses on adoption rates in different regions based on penetration. Furthermore, the electronics manufacturing service market report also includes key purchase criteria and drivers of price sensitivity to help companies evaluate and develop their market growth analysis strategies.
Customer Landscape of Electronics Manufacturing Service Industry
Competitive Landscape
Companies are implementing various strategies, such as strategic alliances, electronics manufacturing service market forecast, partnerships, mergers and acquisitions, geographical expansion, and product/service launches, to enhance their presence in the industry.
Asteelflash Group - Electronics manufacturing service includes product design, engineering, and global supply chain manufacturing for the consumer electronics, industrial, and automotive sectors.
The industry research and growth report includes detailed analyses of the competitive landscape of the market and information about key companies, including:
- Asteelflash Group
- Benchmark Electronics Inc.
- BYD Co. Ltd.
- Celestica Inc.
- Compal Electronics Inc.
- Fabrinet
- Flex Ltd.
- Hon Hai Precision. Ltd.
- Jabil Inc.
- Luxshare Precision Industry
- MiTAC Holdings Corp.
- Pegatron Corp.
- Plexus Corp.
- Qisda Corp.
- Quanta Computer Inc.
- Sanmina Corp.
- Shenzhen Kaifa Technology Co
- USI Insurance Services
- Venture Corp. Ltd.
- Wistron Corp.
Qualitative and quantitative analysis of companies has been conducted to help clients understand the wider business environment as well as the strengths and weaknesses of key industry players. Data is qualitatively analyzed to categorize companies as pure play, category-focused, industry-focused, and diversified; it is quantitatively analyzed to categorize companies as dominant, leading, strong, tentative, and weak.
Recent Development and News in Electronics manufacturing service market
- In May 2025, Jabil Inc. expanded its global manufacturing footprint by opening two new facilities focused on producing advanced automotive components and parts for electric vehicles.
- In May 2025, Sanmina Corp. acquired the data center infrastructure manufacturing business from Advanced Micro Devices Inc. (AMD), establishing a preferred partnership for new product introduction manufacturing in the cloud and AI sectors.
- In May 2025, Jabil Inc. entered into a strategic Memorandum of Understanding with AVL Software and Functions to co-develop design and manufacturing solutions for the automotive and transportation sectors.
- In January 2025, the Competition Commission of India (CCI) approved the acquisition of a majority shareholding in Pegatron Technology India Pvt. Ltd. by Tata Electronics Pvt. Ltd., signaling a major shift in the regional electronics manufacturing landscape.
Dive into Technavio’s robust research methodology, blending expert interviews, extensive data synthesis, and validated models for unparalleled Electronics Manufacturing Service Market insights. See full methodology.
| Market Scope | |
|---|---|
| Page number | 310 |
| Base year | 2025 |
| Historic period | 2020-2024 |
| Forecast period | 2026-2030 |
| Growth momentum & CAGR | Accelerate at a CAGR of 6.7% |
| Market growth 2026-2030 | USD 202.7 billion |
| Market structure | Fragmented |
| YoY growth 2025-2026(%) | 6.4% |
| Key countries | US, Mexico, Canada, Germany, France, UK, Poland, Czech Republic, The Netherlands, China, Japan, South Korea, India, Vietnam, Indonesia, Brazil, Argentina, Chile, South Africa, Israel, UAE, Saudi Arabia and Egypt |
| Competitive landscape | Leading Companies, Market Positioning of Companies, Competitive Strategies, and Industry Risks |
Research Analyst Overview
- The market is undergoing a structural shift from high-volume assembly to high-value, integrated services. Providers are moving beyond basic printed circuit board assembly and box-build integration to offer sophisticated design for manufacturability and full lifecycle management solutions.
- This transition is driven by the immense technical demands of new product introduction for high-performance computing and cloud computing hardware, which require expertise in thermal management, signal integrity testing, and advanced liquid-cooling solutions. The proliferation of 5g infrastructure and the complexity of its radio frequency modules further necessitate this expertise.
- Simultaneously, the automotive sector's evolution requires deep capabilities in power electronics, battery management systems, and advanced driver-assistance systems. To manage this complexity, leading firms are implementing digital twin technology, which has been shown to reduce development validation cycles by over 30%.
- This focus on engineering-led services, from component procurement through the entire semiconductor supply chain to reverse logistics, defines the industry's forward trajectory.
What are the Key Data Covered in this Electronics Manufacturing Service Market Research and Growth Report?
-
What is the expected growth of the Electronics Manufacturing Service Market between 2026 and 2030?
-
USD 202.7 billion, at a CAGR of 6.7%
-
-
What segmentation does the market report cover?
-
The report is segmented by End-user (Computing and consumer appliances, Telecommunication, Industrial, Automotive, and Others), Service Type (Electronics design and engineering, Electronics assembly, Electronics manufacturing, and Others), Technology (Surface mount technology, Advanced packaging or hybrid processes, and Through-hole technology) and Geography (North America, Europe, APAC, South America, Middle East and Africa)
-
-
Which regions are analyzed in the report?
-
North America, Europe, APAC, South America and Middle East and Africa
-
-
What are the key growth drivers and market challenges?
-
Strategic proliferation of artificial intelligence infrastructure and high-performance computing, Persistent supply chain fragmentation and logistical inflation
-
-
Who are the major players in the Electronics Manufacturing Service Market?
-
Asteelflash Group, Benchmark Electronics Inc., BYD Co. Ltd., Celestica Inc., Compal Electronics Inc., Fabrinet, Flex Ltd., Hon Hai Precision. Ltd., Jabil Inc., Luxshare Precision Industry, MiTAC Holdings Corp., Pegatron Corp., Plexus Corp., Qisda Corp., Quanta Computer Inc., Sanmina Corp., Shenzhen Kaifa Technology Co, USI Insurance Services, Venture Corp. Ltd. and Wistron Corp.
-
Market Research Insights
- Market dynamics are increasingly shaped by a strategic pivot toward supply chain resilience and specialized production capabilities. The adoption of smart factory implementation has been shown to reduce assembly line defects by over 20%, a critical metric for high-reliability electronics. Concurrently, near-shoring electronics production has allowed some North American firms to cut logistics-related lead times by up to 35%.
- This move is part of a broader geopolitical risk mitigation strategy, as companies adopt a China-Plus-One model to build regionalized supply chains. In this environment, the ability to handle high-mix low-volume production efficiently is a key differentiator, with advanced supply chain orchestration tools enabling a 15% improvement in inventory turnover for specialized industrial and medical device manufacturing.
- These shifts underscore a move away from pure cost considerations toward a more balanced approach focused on agility, quality, and supply continuity.
We can help! Our analysts can customize this electronics manufacturing service market research report to meet your requirements.
 RIA -
RIA - 
