
Intellectual Property Software Market Size 2026-2030
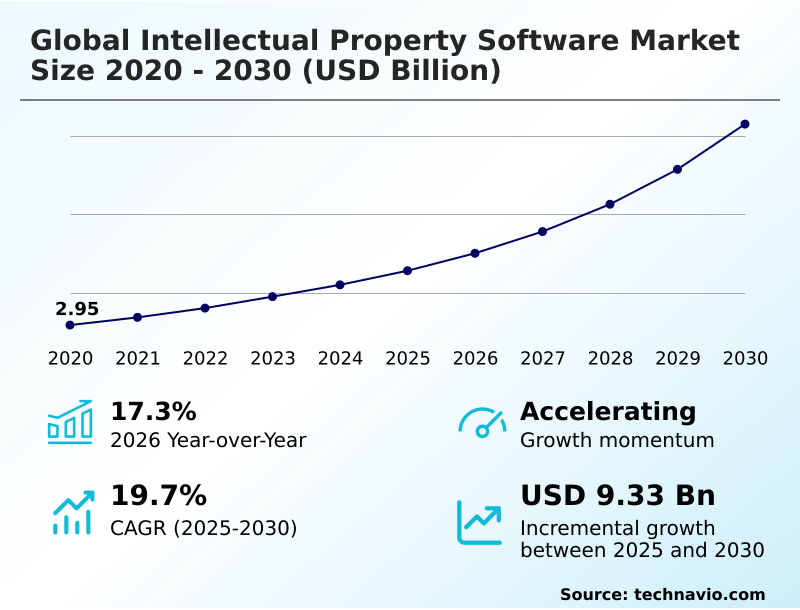
The intellectual property software market size is valued to increase by USD 9.33 billion, at a CAGR of 19.7% from 2025 to 2030. Acceleration of global patent filings and growing intellectual property asset complexity will drive the intellectual property software market.
Major Market Trends & Insights
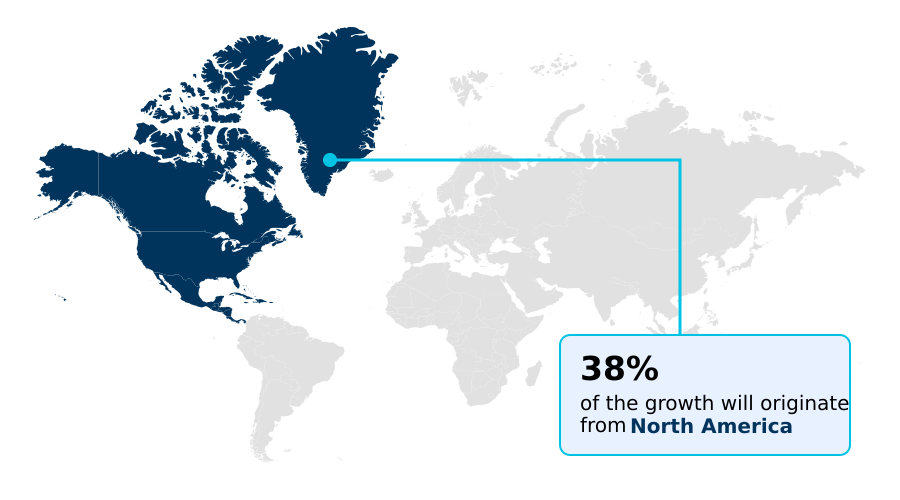
- North America dominated the market and accounted for a 38.2% growth during the forecast period.
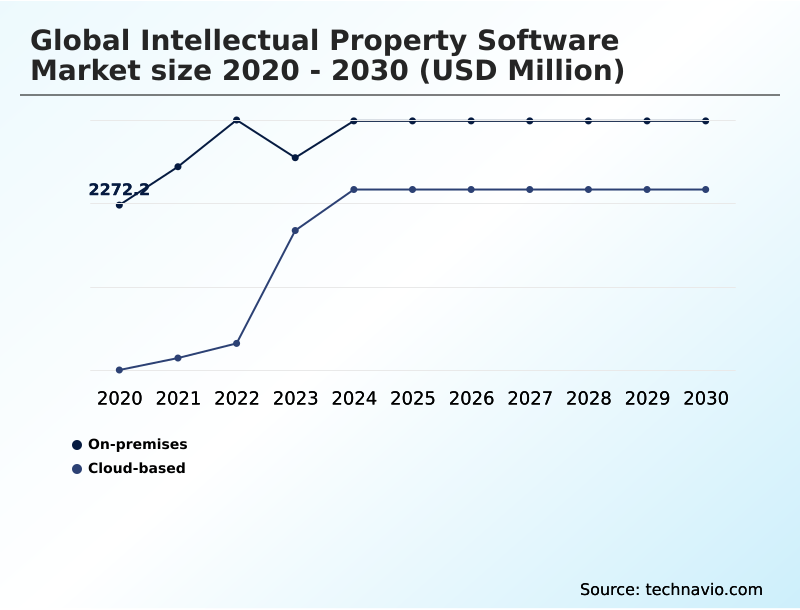
- By Deployment - On-premises segment was valued at USD 3.09 billion in 2024
- By Component - Software segment accounted for the largest market revenue share in 2024
Market Size & Forecast
- Market Opportunities: USD 12.79 billion
- Market Future Opportunities: USD 9.33 billion
- CAGR from 2025 to 2030 : 19.7%
Market Summary
- The intellectual property software market is undergoing a period of profound expansion, driven by the escalating complexity of intangible asset governance and the rapid acceleration of cross-border technological innovation. As organizations generate unprecedented volumes of patents, trademarks, and copyrights, the need for structured, centralized digital platforms has become urgent.
- Historically reliant on decentralized or manual record-keeping, enterprises now leverage these software ecosystems to mitigate legal risks, streamline prosecution timelines, and maximize the commercial value of innovations.
- For instance, a multinational pharmaceutical company can use an integrated platform to manage its global patent portfolio, tracking filing deadlines across dozens of jurisdictions, conducting AI-powered prior art searches for new compounds, and managing complex licensing agreements, all while ensuring rigorous data security for its sensitive research data.
- This shift from administrative compliance to proactive strategic management, powered by AI and cloud computing, is redefining how businesses protect and monetize their most valuable assets in a competitive global landscape.
What will be the Size of the Intellectual Property Software Market during the forecast period?
Get Key Insights on Market Forecast (PDF) Get Free Sample
How is the Intellectual Property Software Market Segmented?
The intellectual property software industry research report provides comprehensive data (region-wise segment analysis), with forecasts and estimates in "USD million" for the period 2026-2030, as well as historical data from 2020-2024 for the following segments.
- Deployment
- On-premises
- Cloud-based
- Component
- Software
- Service
- Application
- Patent management
- Trademark management
- Copyright management
- Others
- Geography
- North America
- US
- Canada
- Mexico
- Europe
- Germany
- UK
- France
- APAC
- China
- Japan
- India
- Middle East and Africa
- UAE
- Saudi Arabia
- South Africa
- South America
- Brazil
- Argentina
- Rest of World (ROW)
- North America
By Deployment Insights
The on-premises segment is estimated to witness significant growth during the forecast period.
On-premises deployment affords organizations unparalleled command over their intellectual property data. This architecture is favored by corporations with stringent internal data governance mandates, ensuring complete trade secret protection.
For large enterprises, an ip docketing system installed in-house provides a foundation for corporate ip management, enabling docketing automation and simplifying ip compliance management across the entire ip lifecycle management.
These integrated ip platforms offer deep customization for patent prosecution support and complex workflows, though they require significant upfront capital and internal expertise for ip cost management.
Firms using on-premises solutions report a 25% lower incidence of data synchronization errors due to robust ip data validation protocols within a controlled environment.
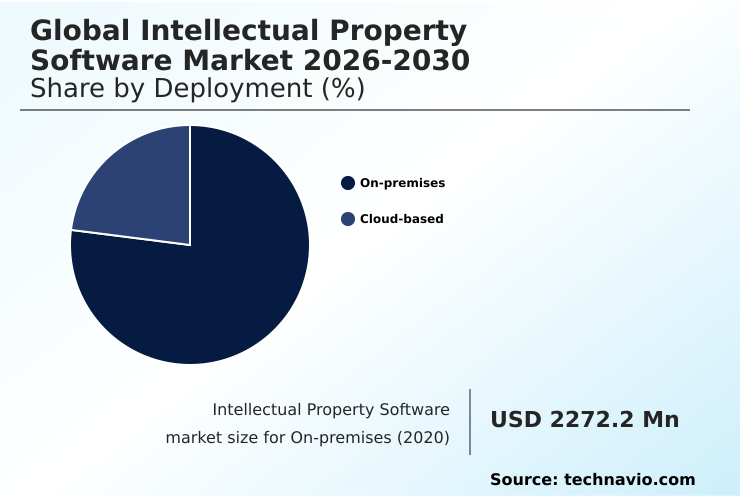
The On-premises segment was valued at USD 3.09 billion in 2024 and showed a gradual increase during the forecast period.
Regional Analysis
North America is estimated to contribute 38.2% to the growth of the global market during the forecast period.Technavio’s analysts have elaborately explained the regional trends and drivers that shape the market during the forecast period.
See How Intellectual Property Software Market Demand is Rising in North America Get Free Sample
The geographic landscape is led by North America, which accounts for over 38% of the market opportunity, driven by high R&D spending and a mature legal sector.
In this region, ip software for law firms focuses on ip litigation support and complex patent docketing. In contrast, APAC is the fastest-growing region, with an innovation boom demanding scalable tools for corporate ip management and intellectual asset management.
European adoption is shaped by strict data privacy regulations, influencing digital rights management and ip cost management strategies.
Across all regions, the focus is shifting toward ip asset monetization, with firms using analytics for trademark opposition tracking and to identify licensing opportunities, improving portfolio ROI by an average of 10-15%.
Market Dynamics
Our researchers analyzed the data with 2025 as the base year, along with the key drivers, trends, and challenges. A holistic analysis of drivers will help companies refine their marketing strategies to gain a competitive advantage.
- The modern enterprise requires sophisticated digital tools to navigate the complexities of intellectual property. The decision between cloud vs on-premise ip software often hinges on security needs and scalability, particularly for ip management software for smes, which benefit from the lower upfront costs of cloud solutions.
- A core function is the automating trademark renewal process to prevent accidental lapses in brand protection. For innovation-driven firms, having the best software for ip portfolio management is critical. This includes leveraging ai tools for prior art search to validate new inventions and using ip analytics for competitor monitoring to maintain a strategic edge.
- Effective tools for invention disclosure workflows streamline the initial stages of patenting, while ip software for university tech transfer helps academic institutions commercialize research. In legal departments, ip docketing software for paralegals enhances efficiency, while platforms for tracking ip litigation with software provide a unified view of ongoing disputes.
- The ability of integrating ip software with erp systems creates a holistic view of business operations. Financially, calculating ip portfolio valuation is a key feature, alongside tools for software for managing licensing agreements. For emerging technologies, blockchain for verifying ip ownership provides an immutable record.
- Finally, rich ip software with data visualization and dedicated patent landscape analysis tools turn raw data into actionable insights, while digital rights management for copyright and cost-effective trademark monitoring protect diverse assets.
- Firms using integrated systems for managing trade secrets in software and software for managing patent annuities report up to a 30% reduction in administrative errors compared to those using siloed, manual processes.
What are the key market drivers leading to the rise in the adoption of Intellectual Property Software Industry?
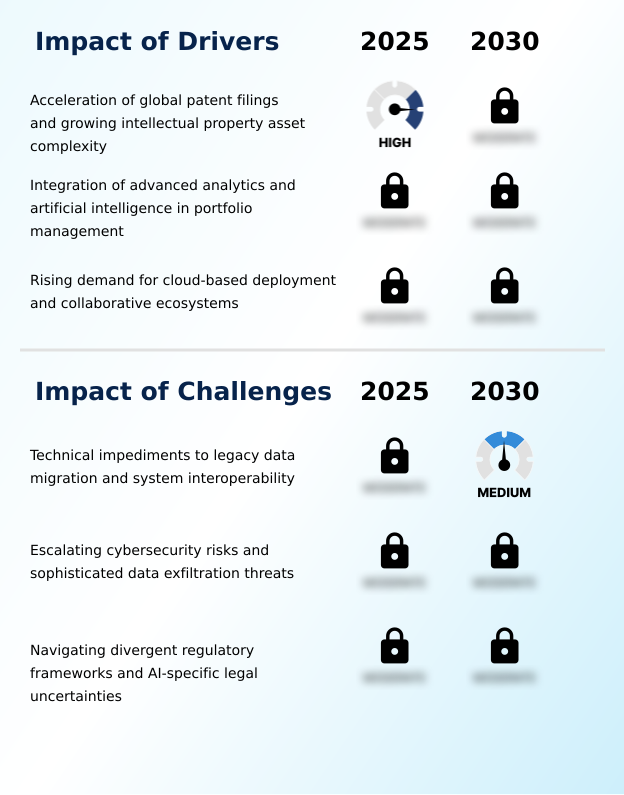
- The acceleration of global patent filings, coupled with the growing complexity of intellectual property assets, is a key driver for the market's growth.
- The surge in global patent filings is a primary driver, compelling firms to adopt cloud-based ip management for effective ip portfolio management.
- Automation is key, with ip workflow automation reducing administrative tasks by up to 50%, enabling a focus on strategic ip strategy formulation. Tools for automated patent drafting and advanced patent analytics are accelerating innovation cycles.
- Concurrently, the need for robust brand protection software and trademark monitoring service is escalating. These systems enhance infringement detection capabilities and are crucial during ip due diligence in M&A activities, where portfolio accuracy is paramount.
What are the market trends shaping the Intellectual Property Software Industry?
- The utilization of blockchain technology is an emerging trend, offering immutable provenance for intellectual property. This allows for more secure asset tracking and the execution of automated smart contracts.
- Decentralized ledger technology is reshaping the market, with blockchain for ip offering an immutable record for ownership, reducing disputes by over 15%. This trend augments traditional ip valuation methods and secures digital assets. AI in patent analysis is becoming standard, automating prior art search and patent landscaping to deliver results 40% faster than manual methods.
- This shift allows a focus on strategic activities like using ip commercialization tools and leveraging competitive intelligence in ip. For creative industries, automated copyright enforcement tools are critical, while software for trade secrets and platforms for managing trademark renewals are seeing increased adoption for holistic asset protection.
What challenges does the Intellectual Property Software Industry face during its growth?
- A key challenge affecting industry growth is the technical impediments associated with legacy data migration and ensuring system interoperability.
- Navigating fragmented regulatory landscapes presents a major challenge, complicating the ip governance framework for multinational corporations. The complexity of migrating legacy data into modern systems can delay adoption, with data cleansing and validation adding 20% to project timelines. This friction impacts the efficiency of docketing automation and annuity payment scheduling.
- Furthermore, sophisticated cyber threats escalate the need for advanced ip risk management protocols. Firms struggle to balance accessibility with security, impacting ip litigation support and royalty management data. Inaccurate ip performance metrics from poor ip data analytics and unreliable ip renewal services lead to suboptimal strategic decisions and potential asset loss during trademark clearance.
Exclusive Technavio Analysis on Customer Landscape
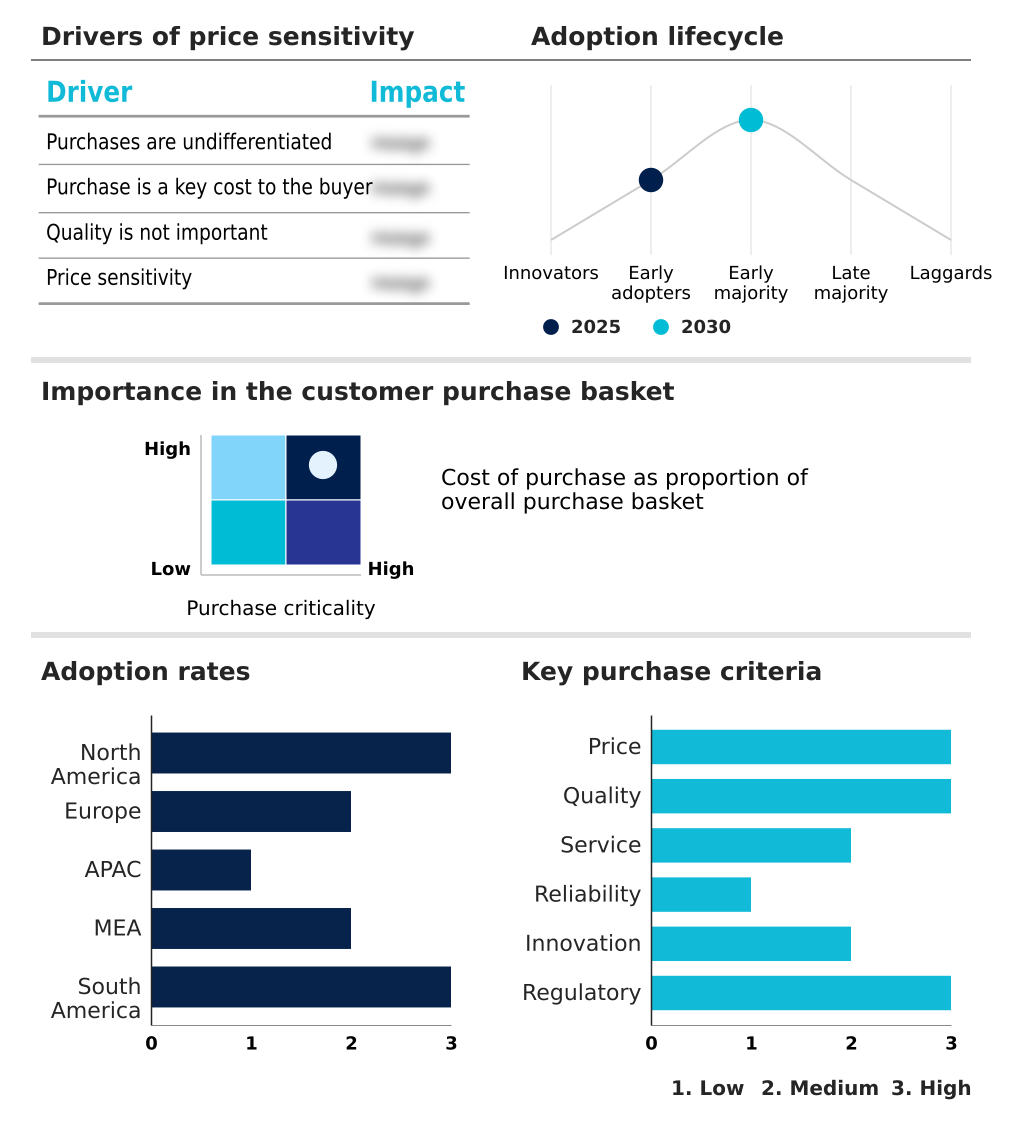
The intellectual property software market forecasting report includes the adoption lifecycle of the market, covering from the innovator’s stage to the laggard’s stage. It focuses on adoption rates in different regions based on penetration. Furthermore, the intellectual property software market report also includes key purchase criteria and drivers of price sensitivity to help companies evaluate and develop their market growth analysis strategies.
Customer Landscape of Intellectual Property Software Industry
Competitive Landscape
Companies are implementing various strategies, such as strategic alliances, intellectual property software market forecast, partnerships, mergers and acquisitions, geographical expansion, and product/service launches, to enhance their presence in the industry.
Alt Legal Inc - Delivers cloud-based trademark docketing and IP management tools, streamlining asset protection for legal professionals.
The industry research and growth report includes detailed analyses of the competitive landscape of the market and information about key companies, including:
- Alt Legal Inc
- Anaqua Inc.
- AppColl Inc
- Clarivate PLC
- Computer Packages Inc.
- Decipher IP LLC
- Dennemeyer Group
- Gridlogics Tech Pvt. Ltd.
- InQuartik Corp.
- Inteum Co. LLC
- IPwe Inc
- MaxVal Group Inc.
- PatentRenewal.com ApS
- Patrix AB
- PatSnap
- Quantify IP AB
- Questel
- RELX Plc
- Rowan Patents
- Wellspring Worldwide Inc.
Qualitative and quantitative analysis of companies has been conducted to help clients understand the wider business environment as well as the strengths and weaknesses of key industry players. Data is qualitatively analyzed to categorize companies as pure play, category-focused, industry-focused, and diversified; it is quantitatively analyzed to categorize companies as dominant, leading, strong, tentative, and weak.
Recent Development and News in Intellectual property software market
- In May 2025, Anaqua Inc. acquired RightHub, an intellectual property management software and services provider, to enhance its international footprint across Europe and integrate advanced artificial intelligence capabilities into its software portfolio.
- In March 2025, Clarivate PLC announced a strategic partnership with Iprova to integrate sophisticated artificial intelligence creation suites directly into the IPfolio intellectual property software platform, accelerating the transition of concepts into formal patent workflows.
- In February 2025, Elevate completed the acquisition of Sagacious IP, an India-based intellectual property solutions provider, to significantly enhance its service capabilities and deepen its penetration into the APAC market.
- In October 2024, the World Intellectual Property Organization completed a specialized intellectual property software and management training program, educating small and medium enterprises across the Middle East on the commercial value and management of intangible assets.
Dive into Technavio’s robust research methodology, blending expert interviews, extensive data synthesis, and validated models for unparalleled Intellectual Property Software Market insights. See full methodology.
| Market Scope | |
|---|---|
| Page number | 295 |
| Base year | 2025 |
| Historic period | 2020-2024 |
| Forecast period | 2026-2030 |
| Growth momentum & CAGR | Accelerate at a CAGR of 19.7% |
| Market growth 2026-2030 | USD 9328.8 million |
| Market structure | Fragmented |
| YoY growth 2025-2026(%) | 17.3% |
| Key countries | US, Canada, Mexico, Germany, UK, France, Italy, Spain, The Netherlands, China, Japan, India, South Korea, Australia, Indonesia, UAE, Saudi Arabia, South Africa, Israel, Turkey, Brazil, Argentina and Chile |
| Competitive landscape | Leading Companies, Market Positioning of Companies, Competitive Strategies, and Industry Risks |
Research Analyst Overview
- The market is driven by the strategic need for comprehensive ip portfolio management and strict ip compliance management. Enterprises are deploying sophisticated systems for ip lifecycle management, from invention disclosure management to ip asset monetization. Core operational tools for patent docketing, docketing automation, and annuity payment scheduling have become standard for mitigating risk.
- For strategic advantage, firms utilize patent analytics and patent landscaping to inform R&D, while prior art search and trademark clearance are critical pre-filing steps. Protecting assets involves advanced infringement detection, brand protection software, and robust copyright enforcement and trade secret protection measures. Boardroom decisions on M&A now heavily rely on thorough ip due diligence, which is streamlined by these platforms.
- The financial side is managed through royalty management and ip valuation tools. For legal teams, patent prosecution support, trademark opposition tracking, and ip litigation support are vital. Companies using integrated software have demonstrated a 40% improvement in managing trademark renewals, directly impacting brand equity retention and reducing administrative overhead.
What are the Key Data Covered in this Intellectual Property Software Market Research and Growth Report?
-
What is the expected growth of the Intellectual Property Software Market between 2026 and 2030?
-
USD 9.33 billion, at a CAGR of 19.7%
-
-
What segmentation does the market report cover?
-
The report is segmented by Deployment (On-premises, and Cloud-based), Component (Software, and Service), Application (Patent management, Trademark management, Copyright management, and Others) and Geography (North America, Europe, APAC, Middle East and Africa, South America)
-
-
Which regions are analyzed in the report?
-
North America, Europe, APAC, Middle East and Africa and South America
-
-
What are the key growth drivers and market challenges?
-
Acceleration of global patent filings and growing intellectual property asset complexity, Technical impediments to legacy data migration and system interoperability
-
-
Who are the major players in the Intellectual Property Software Market?
-
Alt Legal Inc, Anaqua Inc., AppColl Inc, Clarivate PLC, Computer Packages Inc., Decipher IP LLC, Dennemeyer Group, Gridlogics Tech Pvt. Ltd., InQuartik Corp., Inteum Co. LLC, IPwe Inc, MaxVal Group Inc., PatentRenewal.com ApS, Patrix AB, PatSnap, Quantify IP AB, Questel, RELX Plc, Rowan Patents and Wellspring Worldwide Inc.
-
Market Research Insights
- Market dynamics are shaped by a strategic shift toward integrated intellectual asset management and a robust ip governance framework. Organizations are adopting cloud-based ip management solutions to enhance collaboration, with such platforms improving remote team productivity by over 30%. The integration of ai in patent analysis and tools for automated patent drafting allows for more effective ip strategy formulation.
- An effective ip docketing system is central to corporate ip management, reducing filing errors by up to 25%. Specialized ip software for law firms and solutions for ip management for startups focus on ip risk management and ip cost management. Key functionalities include trademark monitoring service, ip renewal services, and advanced ip data analytics to track ip performance metrics.
- The goal is ip portfolio optimization and identifying opportunities with ip commercialization tools. This is achieved through ip workflow automation within integrated ip platforms that also protect assets via software for trade secrets and competitive intelligence in ip, all underpinned by rigorous ip data validation.
We can help! Our analysts can customize this intellectual property software market research report to meet your requirements.
 RIA -
RIA - 
